
記住我


This retrospective study was approved of by the institutional review board of the University Hospital of Basel. Informed patient consent was provided by all study subjects.
Study populationThis study consists of a Method Development as well as a Method Verification part.
For Method Development, the local radiology information system (RIS) was retrospectively searched for abdominal MRI examinations with DCE-MRI employing GRASP and weight-adapted doses of administered gadoterate meglumine performed between 03/2016 and 01/2021. Patients where included into the initial search when the following inclusion criterion was met: availability of serum creatinine measurement at the day of the MRI examination; excluded from the initial search were patients with multicystic or neoplastic kidney disease as well as presence of fresh renal infarctions or inflammatory foci.
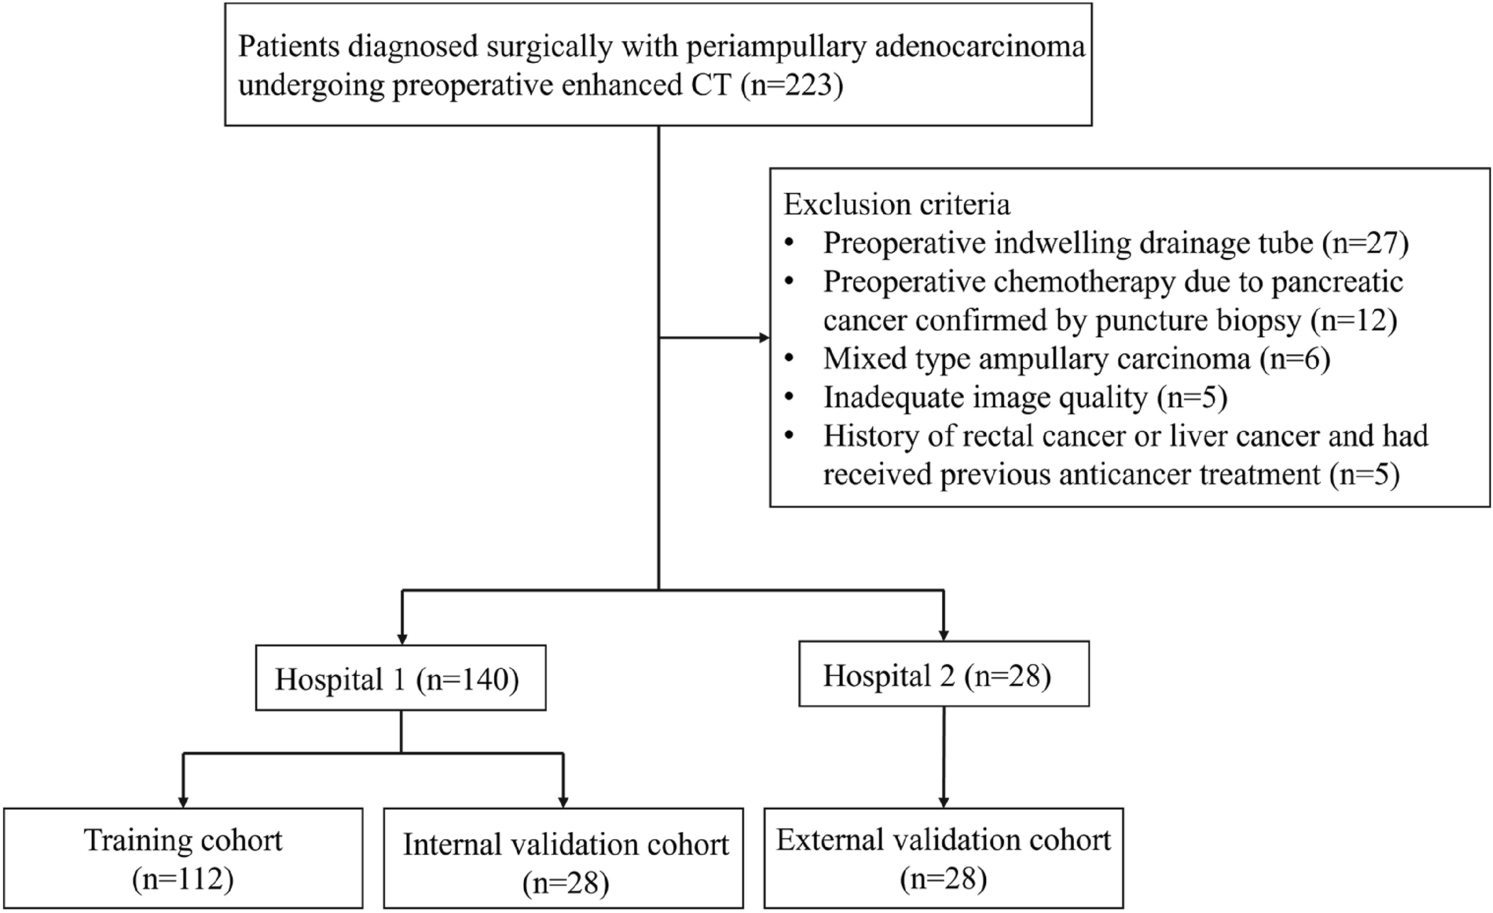
Subsequently, patients were grouped based on their kidney function defined by eGFR as calculated by the CKD-EPI formula8. The definition of the renal function groups closely followed the classification of chronic kidney disease as proposed by KDIGO (Kidney Disease: Improving Global Outcomes)9: ‘no impairment’, eGFR > 90 ml/min/1.73 m2; ‘mild impairment’, eGFR 60–89 ml/min/1.73 m2; ‘moderate impairment’, eGFR 36–59 ml/min/1.73 m2 and ‘severe impairment/renal failure’, eGFR 0–35 ml/min/1.73 m2, respectively. The final study population in the method development part consisted of 60 patients with 120 kidneys distributed into the four specified groups; all groups equal in patient number and matched for age and gender, Fig. 1.
Fig. 1
Study subject recruitment: method development and method verification
For Method Verification, the local RIS was analogously searched for patients not included in the Method Development part of the study using identical time window for inclusion and identical inclusion and exclusion criteria. Additionally, a 99mTc-MAG3 dynamic renal scintigraphy within 90 days from the MRI examination was required. If an entry in the available clinical history of the patients suggested a possible change in renal function between the MRI examination and the scintigraphy (e.g. occurrence of ureterolithiasis), the patient was excluded. Differential renal function (DRF) was calculated by multiplying eGFR with the percentage of total renal function of the left and the right kidney, respectively, as measured by dynamic renal scintigraphy. The single kidney’s quantitative DRF (qDRF) defined whether this kidney was assumed to have no impairment of renal function (qDRF > 45 ml/min/1.73 m2), a mild/moderate impairment of renal function (qDRF 18–45 ml/min/1.73 m2) or a severe reduction in renal function/renal failure (qDRF < 18 ml/min/1.73 m2). The final study population in the method verification part consisted of 15 consecutive patients with 30 kidneys.
MR parameters, acquisition and image reconstructionMR examinations were performed with 1.5-T or 3.0-T scanners (Avanto, Skyra; Siemens Healthineers, Forchheim, Germany). 30 channel body phased-array coils were used together with 18 channel spine phased-array coils. A weight-adapted dose (0.2 ml per kg bodyweight) of gadoterate meglumine (Dotarem, Guerbet AG, Zurich, Switzerland) was injected intravenously using a power injector with an injection rate of 2 ml/s, followed by a bolus of 10 ml saline solution.
All DCE MRI studies were performed using a free-breathing approach. The dynamic contrast-enhanced acquisition used a fat-saturated T1-weighted radial stack-of-stars 3D GRE sequence with compressed-sensing and parallel-imaging reconstruction (GRASP) covering the entire kidneys with the following parameters: repetition time (3.29 ms), echo time (1.64 ms), field of view (320 mm × 320 mm), flip angle (12°), receiver bandwidth (600 Hz/Rx), in plane spatial resolution (1.1 mm × 1.1 mm), slice resolution (2.5 mm).
The GRASP sequence was acquired continuously in axial orientation for up to 350 s, consisting of a 20-s non-contrast imaging phase prior to contrast-material administration and a subsequent contrast-enhanced imaging phase of up to 330 s. GRASP performs the continuous acquisition with a radial stack-of-stars k-space sampling scheme in which radial spokes are stacked along the slice direction and rotated at a fixed angular increment given by the “golden angle”, increasing the angle of consecutive spokes by approximately 111.25°, which results in nearly uniform k-space coverage during the complete acquisition. This enables retrospective post-hoc reconstruction of image series with flexible temporal resolution by binning a certain number of consecutive spokes into individual time frames. GRASP uses an iterative compressed-sensing type of reconstruction that exploits temporal correlations between successive time frames to suppress undersampling artifacts and is thus able to reconstruct motion-resolved images from highly undersampled data 10. In addition to the inherent free-breathing imaging capability, retrospective respiratory gating may be enabled in the sequence. This functionality takes advantage of the self-navigation property of radial sampling and sorts the acquired data into the end-expiratory state 11, as this is the longest in duration. Furthermore, GRASP incorporates the receive-sensitivity profiles of the individual coil elements. A detailed technical description of the sequence and its imaging properties is provided in the corresponding technical studies [13].
In our study, a five-spoke reconstruction was used, resulting in a temporal resolution of 0.81–1.08 frames/sec for the first 90 s. The remainder of the GRASP acquisition was reconstructed with temporal resolutions of 0.14–0.17 frames/sec (6–7 s per frame).
Renal dynamic scintigraphyRenal dynamic scintigraphy examinations were performed employing SPECT/CT scanners (Symbia T6/T16 or Intevo T16, Siemens Healthineers, Erlangen, Germany). 99mTc-MAG3, a highly protein bound substance with primarily extraction by the proximal tubules, was used for estimation of tubular extraction rate. The administered activity was 90–110 MBq. Dynamic image acquisition in supine position was conducted for 30 min with start concomitant with tracer injection; 20 mg furosemide (Sanofi-Aventis SA, Vernier, Switzerland) was administered intravenously 12 min post injection. For image acquisition, a low energy high resolution collimator was used (matrix 64 × 64 pixel). Processing was performed using commercially-available postprocessing software application (syngo.via VB30, MI Application, Siemens Healthineers, Erlangen, Germany) resulting in split function parameters 1.5–2.5 min post injection in the parenchymal phase via ROI analysis. Estimation of the MAG3-TER was performed using the same software after measurement of count rates of 2 blood samples taken 20 and 25 min post injection.
Quantitative assessment of GRASP DCE MR imagingAll GRASP datasets were analyzed to quantitatively evaluate the tracer’s passage through renal compartments. Under the assumption that a differentiated approach combining several independent measures would be more appropriate than a singular measurement and in order to avoid bias my renal hypoperfusion, a threefold approach was chosen with evaluation of (a) glomeruli perfusion, (b) tubular concentration, and (c) collecting system excretion. All post-processing was performed on a commercially-available software application (syngo.via VB30; Siemens Healthineers, Erlangen, Germany). Regions-of-interest (ROI) were drawn on renal cortex, medullary pyramids, and pelvises, each on three craniocaudal levels (upper pole, midsection, lower pole) covering an area of at least 0.5 cm2 as well as within abdominal aorta covering an area of at least 1 cm2 at the level of the renal artery origin. Each ROI was manually drawn on a single frame and automatically multiplicated for all other frames. All ROI placements were individually performed for right kidney anatomy as well as left kidney anatomy. ROIs were drawn by a board-certified radiologist with 2 years of experience in abdominal imaging (X.X.). ROI placements were reviewed by an expert in abdominal imaging with more than 20 years of experience in abdominal imaging (X.X.X.) If patient motion occurred, every ROI on every frame was checked to ensure correct placement. Multilevel ROIs were averaged. Normalized time-intensity parameters were extracted.
Glomeruli perfusion:The majority of renal blood flow is directed to the glomeruli, of which about 90% are located within the cortex13. The ROIs within the renal cortex can thus be characterized as surrogate for a mainly microvascular compartment. Within the glomeruli, the primary urine is formed as product of ultrafiltration of blood. Since gadoterate meglumine is freely filtrated4, its concentration in the primary urine can be assumed to be closely similar to its concentration in blood plasma, Fig. 2.
Tubular concentration:The primary urine passes from the glomeruli to the tubules, the majority of which are located in the medullary pyramids. The ROIs within the medullary pyramids can therefore be characterized as surrogate for a mostly tubular compartment. Here, water is being extracted, leading to a rise in the gadoterate meglumine concentration. Since renal medullary pyramids are less vascularized compared to renal cortex, an increase of signal intensity of the medullary pyramids above the level of the cortex indicates the accumulation of filtrated and at least partially concentrated gadoterate meglumine in the tubules, Fig. 2. The increasing concentration of gadoterate meglumine expressed as the slope of the intensity curve of the medullary pyramids can be perceived as velocity of gadoterate meglumine filtration with simultaneously occurring water reabsorption. Slope quantification (SlopeTubuli) was determined on normalized time-intensity curves within a time window which encompassed 10 s before and 10 s after the timepoint of crossing between the medullary and the normalized cortical intensity curves (TimeCortex=Pyramid), Fig. 2.
Collecting system excretion:Lastly, the concentrated urine is collected in the renal pelvises. The ROIs in the renal pelvis can therefore be defined as surrogate for excretion of concentrated gadoterate meglumine. Rise of signal intensity in the renal pelvis indicated excretion of contrast agent (TimeCollecting System), Fig. 2.
Fig. 2
Visualization of contrast bolus passage through various renal compartments in a 65-year-old female patients with mild renal function impairment: a non-contrast GRASP image (Time = 0 s); b glomeruli perfusion with contrast peak in the renal cortex (solid ROI, Time = 35 s); c tubuli concentration with equalization of contrastation in the renal cortex and medullary pyramids (solid and dotted ROIs, respectively, Time = 75 s); d collecting system exclusion with contrast rise in the collecting system (dashed ROI, Time = 140 s)
Statistical analysisAll quantitative results evaluating timepoint of crossing of cortical intensity and medullary pyramid intensity curves (TimeCortex=Pyramid) in sec, slope of the medullary curve (SlopeTubuli) in sec−1, and timepoint of signal intensity rise in the renal pelvises (TimeCollecting System) in sec, are presented as mean ± standard deviation (SD). Time points are referenced against the arrival of contrast agent in the renal arteries.
For method development, primarily ANalysis Of VAriance (ANOVA) methodology was used for statistical comparison. The estimated glomerular filtration rate (eGFR) (ml/min/1.73 m2) was defined as an independent factor for each analysis; Bonferroni post-hoc corrections were applied for fixed factor “renal function group”; values for TimeCortex=Pyramid (sec), SlopeTubuli (sec−1), and TimeCollecting System (sec) were successively selected as the dependent variable. The statistical investigation employed SPSS (SPSS Statistics 21, SPSS Inc., Chicago, IL) and a p-value < 0.05 was considered statistically significant.
Secondarily, receiver operating characteristics (ROC) analyses with consecutive Youden tests were conducted and yielded cut-off values for TimeCortex=Pyramid (sec), SlopeTubuli (sec−1), and TimeCollecting System (sec) to best discriminate between the following renal function groups: “no impairment” vs. “mild & moderate impairment” as well as “no & mild & moderate impairment” vs. “severe reduction in renal function/renal failure”.
For method verification, each kidney was assigned to the appropriate renal function group using the cut-off values determined during method development for TimeCortex=Pyramid (sec), SlopeTubuli (sec−1), and TimeCollecting System (sec); the two groups “mild impairment”/“moderate impairment” were combined for method verification assessment. In case of discordant group assignment based on the three cutoff values, the group indicated by two of the three measures was selected (majority principle). The reference standard for comparison was determined by qDRF as defined by means of dynamic renal scintigraphy. The method’s positive predictive value (PPV), negative predictive value (NPV) and accuracy were calculated focusing on detection of renal function (RF) group: ‘no impairment’, ‘mild/moderate reduction of RF’ and ‘severe reduction of RF/renal failure’.
留言 (0)