


記住我


Conceptualization, M.M.A., S.M.A., M.A.E.-N. and M.T.; methodology, M.M.A. and S.M.A.; software, M.M.A.; validation, M.M.A., S.M.A., M.A.E.-N. and M.T.; formal analysis, S.M.A.; investigation, S.M.A.; resources, M.M.A., S.M.A., M.A.E.-N. and M.T.; data curation, M.M.A.; writing—original draft preparation, M.M.A.; writing—review and editing, M.M.A., S.M.A., M.A.E.-N. and M.T.; supervision, M.M.A., M.A.E.-N. and M.T. All authors have read and agreed to the published version of the manuscript.
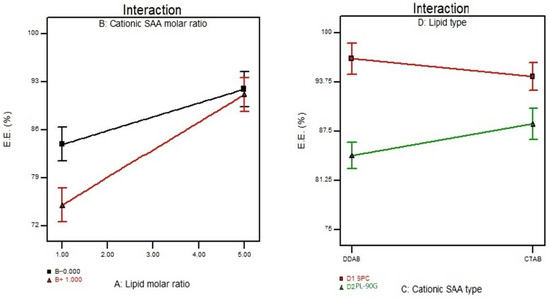
Figure 1. The effect of lipid molar ratio (X1), cationic surfactant molar ratio (X2), cationic surfactant type (X3), and lipid type (X4) on E.E.%. Abbreviation: E.E.%, entrapment efficiency percent.
Figure 1. The effect of lipid molar ratio (X1), cationic surfactant molar ratio (X2), cationic surfactant type (X3), and lipid type (X4) on E.E.%. Abbreviation: E.E.%, entrapment efficiency percent.
Figure 2. The effect of lipid molar ratio (X1), cationic surfactant molar ratio (X2), cationic surfactant type (X3), and lipid type (X4) on P.S. Abbreviation: P.S., particle size.
Figure 2. The effect of lipid molar ratio (X1), cationic surfactant molar ratio (X2), cationic surfactant type (X3), and lipid type (X4) on P.S. Abbreviation: P.S., particle size.
Figure 3. The effect of lipid molar ratio (X1), cationic surfactant molar ratio (X2), cationic surfactant type (X3), and lipid type (X4) on Z.P. Abbreviation: Z.P., zeta potential.
Figure 3. The effect of lipid molar ratio (X1), cationic surfactant molar ratio (X2), cationic surfactant type (X3), and lipid type (X4) on Z.P. Abbreviation: Z.P., zeta potential.
Figure 4. The effect of lipid molar ratio (X1), cationic surfactant molar ratio (X2), cationic surfactant type (X3), and lipid type (X4) on Jss. Abbreviation: Jss, steady-state flux.
Figure 4. The effect of lipid molar ratio (X1), cationic surfactant molar ratio (X2), cationic surfactant type (X3), and lipid type (X4) on Jss. Abbreviation: Jss, steady-state flux.
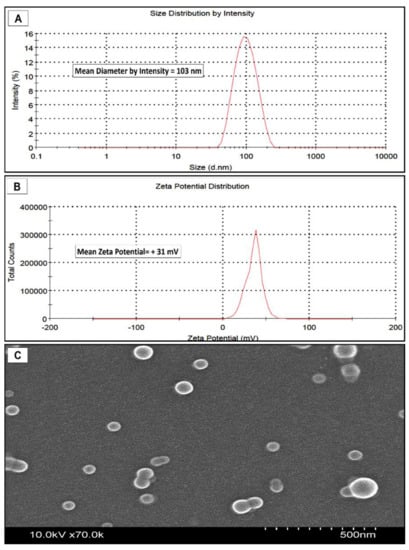
Figure 5. Morphology of the selected LPX. Abbreviation: LPX, leciplex.
Figure 5. Morphology of the selected LPX. Abbreviation: LPX, leciplex.
Figure 6. Cumulative amount permeated of VAN from the optimized LPX formula and aqueous solution. Abbreviations: VAN, Vancomycin hydrochloride; LPX, leciplex.
Figure 6. Cumulative amount permeated of VAN from the optimized LPX formula and aqueous solution. Abbreviations: VAN, Vancomycin hydrochloride; LPX, leciplex.
Figure 7. DSC thermograms; a, VAN; b, PL-90 G; c, CTAB; d, LPX formula. Abbreviations: DSC, differential scanning calorimetry; VAN, vancomycin hydrochloride; PL-90 G, phospholipon 90 G; CTAB, cetyltrimethylammonium bromide; LPX, leciplex.
Figure 7. DSC thermograms; a, VAN; b, PL-90 G; c, CTAB; d, LPX formula. Abbreviations: DSC, differential scanning calorimetry; VAN, vancomycin hydrochloride; PL-90 G, phospholipon 90 G; CTAB, cetyltrimethylammonium bromide; LPX, leciplex.
Figure 8. Cell viability percent using SRB colorimetric assay. Abbreviation: SRB, sulforhodamine B.
Figure 8. Cell viability percent using SRB colorimetric assay. Abbreviation: SRB, sulforhodamine B.
Figure 9. Mean plasma concentration-time curve of VAN following oral administration of the optimized LPX formula and VAN aqueous solution. Abbreviation: VAN, vancomycin hydrochloride; LPX, leciplex.
Figure 9. Mean plasma concentration-time curve of VAN following oral administration of the optimized LPX formula and VAN aqueous solution. Abbreviation: VAN, vancomycin hydrochloride; LPX, leciplex.
Table 1. DOD of VAN-loaded LPX.
Table 1. DOD of VAN-loaded LPX.
Independent Variables for LPX DesignLevels LowHighX1: lipid molar ratio01X2: cationic surfactant molar ratio15X3: cationic surfactant typeSPCPL-90 GX4: lipid typeCTABDDABTable 2. Experimental runs, independent variables, and measured response of the DOD of VAN-loaded LPX.
Table 2. Experimental runs, independent variables, and measured response of the DOD of VAN-loaded LPX.
FormulationTable 3. Output data of the DOD analysis of LPX formulations and predicted and observed values for the selected LPX formula.
Table 3. Output data of the DOD analysis of LPX formulations and predicted and observed values for the selected LPX formula.
SourceE.E.%Table 4. Intestinal permeability parameters of VAN after application of VAN solution and LPX.
Table 4. Intestinal permeability parameters of VAN after application of VAN solution and LPX.
Intestinal Permeability ParametersLPXVAN SolutionThe total amount of VAN permeated
留言 (0)