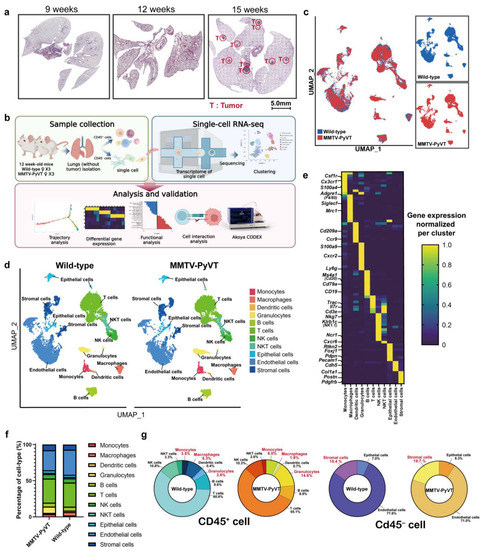
Analysis of CD45+ immune cells from the lungs of wild-type and MMTV-PyVT mice with SingleR revealed eight distinct clusters with specific markers (
Figure 2a). They were defined as immune cell types, including B cells, DCs, granulocytes, macrophages, monocytes, NK cells, NKT cells and T cells. The expression of classical markers for lymphoid cells (Cd79a for B cells, Cd3e for T cells, Ncr1 for NK cells and Cd3e plus Klrb1c for NKT cells), monocytes (Csf1r), macrophages (Mrc1), DCs (Cd209a) and granulocytes (Cxcr2) are shown in the corresponding cell clusters (
Figure 2b). By examining these cells in detail, 25 sub-clusters were annotated (
Figure 2b,c), and to better understand the involvement of monocytes/macrophages/DCs in the formation of lung PMNs, we classified seven subsets of these myeloid cells, including plasmacytoid dendritic cells (pDCs), alveolar macrophages (alv mø), intermediate mø, proliferative mø, classical monocytes, intermediate monocytes and non-classical monocytes (
Figure S2a,b). The cell number of classical monocytes was markedly increased whereas alv mø and proliferative mø were decreased in the lungs of MMTV-PyVT mice (
Figure 2d). The increase in classical monocytes was also validated by a CODEX-based staining (
Figure 2e). Trajectory analysis showed a gradual transition from the root non-classical monocytes state to the intermediate monocytes and then the classical monocytes (
Figure 2f and
Table S2). WGCNA analysis, a method to identify networks of connecting genes from transcriptomes [
25], showed that M1 and M2 modules were positively correlated with non-classical monocytes, whereas M4 module was strongly correlated with classical monocytes (
Figure 2g,
Figures S3a–d and S4;
Table S3). The gene set of M4 module underwent KEGG analysis and revealed association with “immune response trigger” (
Figure 2g and
Figure S5a,b;
Tables S4 and S5). To investigate hub genes contributing to non-classical and classical monocyte transition, we intersected the genes of trajectory analysis and WGCNA (M1 and M4). The results revealed that Pltp, Tgm2, Cd300e, Spn and Ace dropped markedly in cells as they transformed from non-classical monocytes into classical monocytes, while C3, Fn1, Hp, Osm, S100a6, Ccr2, Capg and Vim, were upregulated in cells as they transformed into classical monocytes (
Figure 2h and
Figure S6a;
Table S3). A comparison of the differentially expressed (DE) genes in classical monocytes from the lungs of wild-type and MMTV-PyVT mice revealed that the expression of inflammatory genes S100a9, Slpi, Wfdc17 and Apoc2 was upregulated (log2(FC) > 1, expression in >50% cells) in classical monocytes of the lungs of wild-type mice, whereas the expression of Irf8 and Jun was downregulated (−log2(FC) 50% cells) (
Figure S6b).We next focused on the granulocytes and further characterized their potential biological states. Following analysis of the granulocytes, we identified three distinct clusters, basophils, neutrophils (Cxcr2+Ly6g+) and Cxcr2+Ly6g- granulocytes with specific markers (
Figure 3a,b). The number of Cxcr2+Ly6g- granulocytes and neutrophils was dramatically increased in the lungs of MMTV-PyVT mice (
Figure 3c). Trajectory analysis showed that they began as Cxcr2+Ly6g- granulocytes, and then progressed to a neutrophil population followed by basophils (
Figure S7a).Previous studies indicated that neutrophil polarization influences the role they play in the tumor microenvironment [
26], so we then determined the phenotypes of the neutrophils, with results indicating that markers of N2-type neutrophils, such as Mmp9 and S100a8/9 were increased, whereas N1 markers Ccl3, Fas and Cxcl3 were decreased in the neutrophils of MMTV-PyVT mice (
Figure 3d,e). WGCNA also showed that neutrophils from the lungs of MMTV-PyVT mice exhibited a N2-type phenotype (
Figure 3f). Screening was performed for genes whose expression levels were correlated with N1- or N2-type by N1–N2-type trajectory analysis. The analysis yielded 28 genes whose increased expression levels were associated with N1-type and 25 genes whose expression levels were associated with N2-type (
Figure 3g and
Figure S7b;
Table S6). In addition, WGCNA analysis identified 10 modules of interest; M7 module had the most significant difference on the transition of N1 to N2-type neutrophils (
Figure 3h,
Figures S8a–g and S9;
Tables S7–S12). After analyzing the intersection of these two analysis databases, 14 genes were found to be involved in the phenotypic switch between N1/N2 neutrophils. Our analysis revealed an increased expression of transcription factor Ets2 and cytokine Ccl6 associated with the N1 phenotype, whereas increased expression of receptors (Anxa1 and Cd177) and secretory factors (Mmp8, Mmp9, S100a8, Lcn2, Lgals3, Ngp, Prdx5, Pglyrb1, Arhgdib and Ifitm6) were associated with the N2-type phenotype (
Figure 3i). Pathway analysis of M7 module showed that metabolism, leukocyte migration and NET cascade were involved in the phenotypic transition of neutrophils (
Figure 3j and
Figure S10a–d).

留言 (0)