1. IntroductionThe multifunctionality of the type 2 transglutaminase (TG2) includes several extra- and intracellular activities [
1,
2,
3]; regarding interactions with membrane and extracellular matrix proteins [
4,
5,
6,
7,
8]; GTPase functions [
9,
10], signaling cascades [
11,
12,
13]; modification of cytoskeletal structures [
14,
15], of transcription factors and of structural chromatin proteins [
16,
17,
18,
19]; or interference with calcium homeostasis [
20] and metabolism [
21,
22]. TG2 inhibitors have been described as suitable in the pathologies in which the enzyme displays pivotal biological functions [
23,
24,
25,
26,
27,
28,
29,
30], although it is difficult to discriminate and understand the specific biological effects. Focusing on breast cancer (BC), TG2 inhibition improves the activity of anticancer drugs in the control of cell proliferation and apoptosis [
31,
32], reverses drug resistance [
33] and limits cell motility during epithelial-to-mesenchymal transition (EMT) [
14]. We can summarize that these effects are mediated by two different structures of the enzyme, an open state, associated with transamidation reactions involved in extracellular matrix modifications and activated by Ca2+, and a closed state with intracellular functions, such as binding and hydrolyzing GTP, although even inside the cell, TG2 can catalyze transamidation in the presence of a high Ca2+ concentration [
34]. Both activities can be blocked by specific inhibitors, such as NC9, and the same can be done in BC with a triple-negative phenotype, showing elevated levels of TG2 [
31]. Some compounds, notably AA9, not only block the transamidation properties of TG2, but they also prevent the G-protein’s role carried out by the closed conformation [
35]. In BC, TG2 interferes with several pathways of cell signaling [
34], usually involving intracellular targets localized in lipid rafts zones of membrane in which the number of ion channels is high. For this reason, we studied the impacts of TG2 inhibitors on membrane currents. Recently, interference by TG2 contained in exosomes was reported in L-type calcium channels, localized on the pre- and postsynaptic nerve terminals in the central nervous system [
36], but in this study we focused on intracellular actions which are targetable to obtain antitumor effects [
34].In the specific context of BC, investigations of ionic fluxes have a long history. Membrane currents are frequently altered, and depolarization preferentially affects more aggressive cells [
37], as in the case of triple-negative phenotypes, which represent types tumors that are still difficult to cure. Alterations in ion homeostasis could be caused by changes in the extracellular matrix and tumor microenvironment that mediate processes of angiogenesis, vascularization, EMT and migration, as a prelude to metastatic dissemination [
38]. These events are strongly associated with calcium, copper, potassium, sodium and chloride homeostasis, so that the use of channel blockers, chelators and ion administration can oppose cancer progression. Their clinical relevance has stimulated the investigation of molecules to regulate ion channels, such as steroidal sex hormones and vitamin D [
39], and at present, a wide number of compounds of therapeutic interest can be employed to limit or control specific ion channels [
38]. Overall, K+ channels have a leading role and represent good candidates as markers. They are easily druggable, owing to their position on the cell membrane [
40]. The voltage-dependent Kv10.1 channel (also named ether à-go-go-1, Eag1) has been indicated as a good target for therapy of most human tumors [
41], despite its similar structure to the Kv11.1 channel (human ether-à-go-go-related gene, hERG), which is relevant for cardiac physiology. Indeed, they belong to the same family and display similar affinity for almost all blockers [
42]. A few lines of experimental evidence have been reported in support of the relationship between K+ ion flux and TG2, documenting its involvement in the activation of the Ca2+-dependent Maxi-K+ channel of vascular smooth muscle cells, determined by the ability of TG2 to function as a G-protein [
43]. We underline that cystamine inhibits TG2, affecting the phospholipase C pathway and leading to the opening of Kv channels, decreasing Ca2+ intracellular levels in rat mesenteric small arteries [
44]. This has been demonstrated by the use of LDN 27219, which selectively blocks the closed form of the enzyme but not the transamidase function [
25]. Other findings indicate a reverse relationship: blockers of K+ channels modify the Ca2+ concentration, interfering with the transamidating activity of TG2, as in keratinocyte differentiation [
45], and the use of depolarising agents, such as veratridine or high potassium concentration, increased influx and accumulation of Ca2+ into rat ganglia, causing activation of TG2 catalysis [
46]. In an attempt to unravel the intracellular functions of TG2, we have employed inhibitors that could affect not only its enzymatic transamidation, but also its G-protein activity [
47]. Other than the well-known inhibitor NC9 [
14,
48,
49], we used the novel compound AA9 [
35]. We introduced these drugs into the cell by the patch-clamp pipette method to record the whole-membrane current [
50]. The aim of this work is to answer the question: “Is there a connection between some kind of K+ channel and TG2 in aggressive BC?”. If so, the inhibitors of TG2 could help to control the K+ fluxes and tumor growth. 2. Materials and Methods 2.1. Cell Growth and TreatmentsFor our investigation we used three triple-negative BC cell lines with different characteristics, purchased from American Type Culture Collection (
https://www.atcc.org/, accessed on 30 March 2022) (Rockville, MD, USA). MDA-MB-468 are epithelial cells of metastatic adenocarcinoma isolated from pleural effusion carrying mutations of the PTEN, RB1, SMAD4 and TP53 genes, which we grew in Dulbecco’s modified eagle’s medium (DMEM)/F-12 DMEM, Gibco Laboratories, New York, NY, USA), 10% fetal bovine serum (FBS, Gibco Laboratories, New York, NY, USA), 50 U/mL penicillin and 50 μg/mL streptomycin (Gibco Laboratories). The other two cell lines, with similar pleural effusion, were MDA-MB-231 cells with mesenchymal-like morphology presenting mutations in the BRAF, CDKN2A, KRAS, NF2 and TP53 genes, and the pleomorphic MDA-MB-436 cells with multinucleation and altered BRCA, TP53 and RB1 genes. They were cultured in DMEM High Glucose with stable L-Glutamine (EuroClone, Milan, Italy), 10% FBS and antibiotics. All cultures were grown at 37 °C with 5% CO2 in a humidified atmosphere.Cell treatments were carried out with the addition of drugs to the culture medium, when the cells reached about 70% confluence. As TG2 inhibitors, we used the following compounds: N-α-carbobenzyloxy-N-ε-acryloyl-L-lysine(2-(2-dansylaminoethoxy)-ethoxy)ethanamide, also named NC9, and (S)-benzyl(1-(4-(1-naphthoyl)piperazin-1-yl)-6-acrylamido-1-oxohexan-2-yl)carbamate, called AA9, respectively, synthesized as described [
46] and also commercially available from Zedira (Darmstadt, Germany).
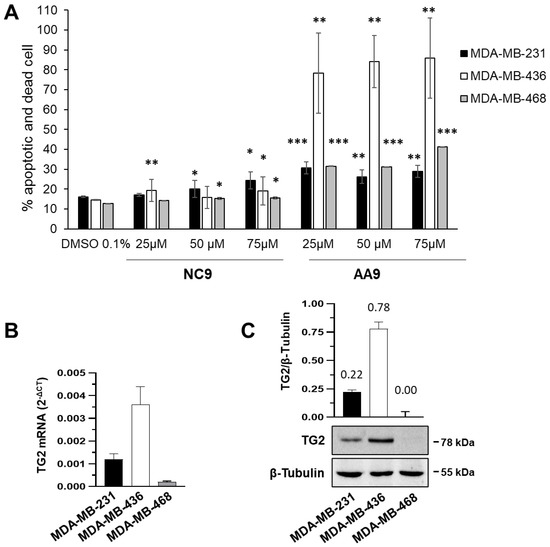
For the apoptosis assay the inhibitors were used at the final concentrations of 75, 50 and 25 μM; 0.1% DMSO was used as a negative control.
In patch-clamp experiments, TG2 inhibitors were injected into a single cell: NC9 at the concentration of 3, 10 or 15 μM (for preliminary setting of the method), and AA9 at 9 μM; again, 0.1% DMSO was the negative control. The 4-aminopyridine (4-AP) (Merck Life Science, Milan, Italy), dissolved in water to achieve a final concentration of 5 mM, represented the positive control as a specific inhibitor of the K+ voltage-dependent channels [
51,
52]. In addition, we employed 10 μM astemizole (Merck Life Science, Milan, Italy), specifically to inhibit the Kv10.1 channel [
53].For metabolomic analysis, cells were grown in triplicate in T75 flasks (EuroClone), replacing the medium at 70% confluence. After 8 h of adaptation, we added the compounds to the culture and collected the cells after 16 h of exposure to 9 μM AA9 and 30 μM NC9 (in agreement with their KI values), according to the procedure described in the literature [
14]. Control cell cultures were grown in medium supplemented only with the solvent (0.1% DMSO). Each condition was performed in triplicate. Upon treatment, the cell-free medium of each flask was recovered and stored at −80 °C until sample preparation. 2.2. Detection of ApoptosisApoptosis was detected after 48 h of treatment with TG2 inhibitors using the Muse® Annexin V & Dead Cell Kit (Luminex, Prodotti Gianni, Milan, Italy) [
31].
We performed an apoptotic assay on BC cells at 105/well for the final concentration. The adherent cells were exposed to the action of trypsin for 2 min at 37 °C that was inactivated by using 1 mL of culture medium containing 10% FBS. The cells were centrifuged at 1200 rpm for 5 min, washed with fresh complete culture medium and 100 μL of cells were diluted with an equal volume of kit solution. We analyzed the cells by Muse after an incubation of 20 min.
Statistical analysis of apoptosis data was obtained by calculating p value by Student’s t-test or one-tailed homovariance. Significance is expressed by (*) p value < 0.05, (**) p value < 0.01, or (***) p value < 0.001.
2.3. Quantification of Gene Expression by RT-qPCR Total RNA from 3 × 10⁶ cells was extracted by TRI Reagent®, as indicated in the manufacturer’s protocol (Merck Life Science). Reverse transcription (RT) was performed on 1 µg of total RNA using TaqMan® Reverse Transcription Reagents kit (ThermoFisher Scientific, Monza MB, Italy). To analyze TG2 gene expression, we carried out quantitative polymerase chain reactions (qPCRs) as described by Franzese et al. [
54], using β-actin (ACT) as a reference gene, forward primer 5′-CATTGCCGACAGGATGCA-3′ and reverse primer 5′-GCTGATCCACATCTGCTGGA-3′. Fold change was determined by comparing the relative threshold cycle value (CT) of the target gene with that of the reference to obtain the ΔCT value. To quantify the increase/decrease, we applied the formula 2−ΔCT expressing target modulation. 2.4. Patch-Clamp Technique
Patch pipettes were pulled from glass capillaries with a 1.0 mm outer diameter using a micropipette puller (NARISHIGE Instruments, Tokyo, Japan, mod PP-830), fire-polished (tip resistance between 2 and 5 MOhm) and filled with an intracellular solution.
In order to characterize the overall membrane current response, we used an intracellular solution containing 145 mM KCl, 1 mM MgCl2, 10 mM HEPES and 5 mM EGTA, whose pH was adjusted with KOH to the value of 7.3; and an extracellular solution containing 145 mM NaCl, 1.8 mM CaCl2, 1 mM MgCl2, 5.4 mM KCl, 10 mM glucose, and 10 mM HEPES, whose pH was adjusted with NaOH up to the value of 7.35. If required, osmolality was adjusted with sucrose to obtain values between 300 and 310 mOsm/kg.
The 4-AP and astemizole were diluted at the time of use and added to the perfusion solution. NC9 and AA9 were added to the intracellular solution. We underline that TG2 inhibitors affected the adhesion of the pipette if administrated outside the cell during the patch-clamp, hampering any record.
Cells were viewed through a TV monitor connected to a contrast-enhanced video camera (T.I.L.L. Photonics, Planegg, Germany), coupled to an inverted microscope (Olympus IMT-2, Tokyo, Japan) equipped with a 40x Hoffman-modulation contrast objective.
Whole cell currents were elicited by voltage-clamp pulses (1400 ms duration) between +70 and −90 mV in 20 mV steps beginning from a holding potential of −30 mV (considered close to the membrane potential of non-excitable cells) [
55,
56].
The voltage protocol and data acquisition were performed with Digidata card 1322A and pClamp package (version 9.2, Molecular Devices, LLC. 3860 N. First Street, San Jose, California, 95134, USA). The currents were recorded with a commercial patch-clamp amplifier (EPC-7; Consumer E-List, Darmstadt, Germany); the recordings were filtered at 5 kHz, acquired at 10 kHz and stored on a disk.
Data from patch-clamp experiments are reported in the text and figures as mean ± SEM. Comparisons control to treatment were made with GraphPad Prism v.5 by two-way ANOVA and were considered significant for p values less than 0.05.
2.5. Immunoprecipitation and Immunochemical Analysis
Lysates from all cell lines were analyzed by Western blot after the addition of Laemmli’s SDS sample buffer to cells washed with cold phosphate buffer saline containing 1 mmol/L Na3VO4.
For immunoprecipitation experiments, cells were lysed, treated with protease and phosphatase inhibitors and incubated with antibodies against TG2 (Ig036, Zedira, Darmstadt, Germany), Kv10.1 (sc-398585, Santa Cruz Biotechnology, Santa Cruz, CA, USA) and Kv11.1 (sc-377388, Santa Cruz Biotechnology) or with a non-specific IgG, which was used as the negative control (sc-53344, Santa Cruz Biotechnology). They were immunoprecipitated with protein A-sepharose (Pharmacia, Uppsala, Sweden), according to the previously reported experimental conditions [
14].Total cell lysates and immunoprecipitates were separated on 7.5% denaturing polyacrylamide gel and blotted on nitrocellulose membranes (GE Healthcare Life Science, Little Chalfont, UK) and finally hybridized with antibodies against TG2, Kv10.1 and Kv11.1 and β-tubulin (T4026, Merck Life Science), as previously described [
14,
42,
57].The chemiluminescence of the resolved bands was acquired with an ImageQuantTM LAS 4000 biomolecular imager (GE Healthcare Life Science), and densitometrical analysis was performed by Image Quant TL software (GE Healthcare Life Science), as previously reported [
58].
The results were expressed as means ± SDs of three independent experiments. Statistical analysis was performed by two-tailed Student’s t test for unpaired data using the GraphPad Prism 6.0 statistical package (GraphPad Software, San Diego, CA, USA). p values < 0.05 were considered statistically significant.
2.6. Samples’ Preparation for Metabolomic Analysis of Cell Supernatants
For each triplicate sample, 1 mL of culture supernatant and of fresh medium were ultra-filtered using Amicon Ultra-4 Centrifugal filters (10,000 MWCO, Merck Millipore) at 4000× g and 5 °C to deplete the metabolite solutions of proteins. Sodium phosphate buffer (pH 7.4) and 3-trimethylsilyl propionic acid, used as a chemical shift reference (0.00 ppm) and quantitative internal standard, were added to 575 μL of the ultra-filtered solutions, reaching the final concentrations of 50 mM and 1.45 mM, respectively. Final samples also contained 2.5% D2O for the signal lock.
One-dimensional 1H-NMR spectra were acquired at 25 °C with a JEOL 600 MHz ECZ600R spectrometer (JEOL USA Inc., Peabody, MA, USA) according to Gallo et al. 2022 [
59]. The spectra were processed and analyzed with the Chenomx NMR suite 9.0 software (Chenomx Inc., Edmonton, AB, Canada), zero-filling to 256 k points and processed using a line broadening of 0.5 Hz.Multivariate statistical analysis was conducted on target metabolites using MetaboAnalyst 5.0 (
https://www.metaboanalyst.ca, accessed on 25 May 2022) [
60]. Metabolite concentrations were normalized to the median and auto-scaled before analysis. The heatmap analysis of the nine samples was performed using the Pearson distance measure and Ward clustering method. A volcano plot was employed for two-group data analysis, considering 2 and p value thresholds, respectively. 4. DiscussionOur first goal was to verify the efficacy of the novel TG2 inhibitor AA9 by comparison with the well-known NC9, in three triple-negative BC cells. AA9 provided a general apoptosis/death effect on the selected cell lines, which, however, did not directly correlate with the level of TG2. Due to the multifunctionality of this enzyme, it should be emphasized that it is difficult to attribute apoptosis induction to a specific TG2 function, owing to the roles displayed inside and outside the cell. The situation is further complicated by the presence of altered variants [
31,
68,
69,
70], whose functions are still a matter of investigation. An extracellular role of TG2 contained in vesicles has been recently demonstrated on L-type calcium channels [
36], localized on nerve terminals in the pre- and postsynaptic parts of the central nervous system. The involved voltage-gated calcium channels associated with several functions in cancer are, however, downregulated in BC [
71].
To distinguish the relevance of TG2 inside the cell, excluding interference by extracellular functions of the enzyme, we employed the patch-clamp technique, which allowed us to scrutinize the changes induced by TG2 inhibitors, creating a continuous solution between cytosol and the contents of the internal space of the micropipette. In this manner we analyzed changes following intracellular effects and observed prompt current modifications.
We tested the TG2 inhibitors in three BC cell lines, and immediately their current profiles showed that not all the cell lines were suitable, owing to the lack of significant voltage-dependent currents. Therefore, we restricted the treatments only to the MDA-MB-436 and MDA-MB-231 cells, the latter being the most responsive. In fact, the measurements demonstrated that TG2 inhibition leads to a significant decrease in membrane current only in MDA-MB-231 cells, which was more pronounced with AA9 than with NC9. The similar trend of the current-voltage relationship after AA9 and 4-AP treatments of the cells suggested the involvement of voltage-dependent K+ channels.
A link of inter-functionality between the latter and TG2 has been described in the β cells of the Langerhans islets, where membrane depolarization drives the insulin secretion [
66,
72]. The variations in the intracellular Ca2+ concentration triggered by changes in K+ fluxes activate TG2 [
73], leading TG2 to interact with actin filaments and cytoskeleton structure, resulting in driving granules out of the cell [
74]. Instead, another type of relation, reported in vascular smooth muscle cells, found TG2 modulating conductance of the Maxi-K+ channels [
43]. In our BC cells 4-AP did not modify the current profiles associated with channels of this kind, as already reported [
51,
53].The influence of TG2 on K+ flux has already been studied through specific inhibitors promoting the closed conformation of the enzyme. This event seems to regulate the relaxed state of arteries lowering blood pressure [
25]. These effects take place following the interaction between TG2 and another voltage-dependent channel, Kv7, modulated by the G-protein function of TG2, as demonstrated using the specific inhibitor LDN 27129 [
44]. However, Kv7 channels do not seem to have any important role in eliciting the membrane current of BC cells [
40], whereas Kv10.1 is involved [
75]. The expression of the Kv10.1 channel, as well as that of Orai1, which sustains Ca2+ influx, depends on the activation of the discoidin domain receptor 1 pathway, which is mediated by collagen type I and activated via ERK1/2 [
76,
77]. Considering that Kv10.1 is one of the most relevant channels associated with cell division, EMT and metastasis and for this reason is a good candidate for therapy [
78], we tried to define its possible interplay with TG2. The use of the specific Kv10.1 channel inhibitor astemizole confirmed our hypothesis, since its effects on the membrane current overlap those of the TG2 inhibitor AA9. We excluded the possibility that it depends on Ca2+ current, because this was travelling inward for the entire voltage range we explored; indeed, the reversal potential of the Ca2+ current is much higher than the tested +70 mV, and furthermore, it inactivates before reaching it [
79]. By use of co-immunoprecipitation, we demonstrated in vitro the formation of complexes between Kv10.1 and TG2, validating the possibility that their physical interaction is at the basis of the role of TG2 in K+ fluxes. Despite the inhibitor AA9 blocking both transamidation and GTP-binding functions of TG2 [
35], we believe that the effects on Kv10.1 can be attributed to the latter, since TG2 regulates the Kv7 channel by G-protein activity [
44]. However, we cannot exclude further intracellular interferences of TG2, given its ability to modify the cytoskeleton, another process closely related to the migration and survival of BC cells [
14]. Regarding the metabolic analysis we carried out on supernatants, a significant increase in both dimethylamine and methylamine was detected 16 h after the addition of AA9, making them possible markers of drug sensitivity. Dimethylamine and methylamine could constitute further factors in implementing the crosstalk TG2/K+ channel. An effect of amines on TG2 has been described as associated with insulin secretion by pancreatic islets [
80], which showed different behavior for trimethyl-, dimethyl- and methylamine. While trimethylamine did not show any effects, dimethylamine and methylamine impaired the release of insulin in a way that is not necessarily directly associated with the transamidation activity of TG2. This effect was attributed to earlier changes impairing permeability to K+ ions, and decreased conductance and Ca2+ uptake are consequences of a higher K+ extracellular concentration [
81].The increases in secreted dimethylamine and methylamine could depend on the effects of TG2 inhibition on other targets. Notoriously, TG2 forms complexes with PLCδ1, thereby inhibiting it, whereas the GTP binding by TG2 allows PLCδ1 release and activation [
82,
83,
84]. In this manner, the G-protein function of TG2 modulates PLCδ1, which catalyzes the degradation of membrane phospholipids, interfering not only with the inositol pathway, but also with the metabolism of phosphatidylcholine, one of the possible substrates of phospholipase [
85]. PLCδ1 is one of the key enzymes in triple-negative BC cells [
86], where it catalyzes the degradation of phosphatidylcholine into 1,2-diacylglycerol and phosphocholine, which is then converted into choline. In humans, dietary choline is mainly degraded by intestinal microbacteria into trimethylamine [
87] and then into dimethylamine [
88], but these reactions have not been extensively investigated in mammals, so it remains unclear if there is evidence of the existence of an endogenous pathway [
89].It might be important to underline also that the binding of PLCδ1 by TG2 supports autophagosome degradation in MDA-MB-231 cells [
90]; therefore, blocking the formation of this complex could have therapeutic implications. Considering potential therapeutic strategies, it could be interesting to combine the use of AA9 with inhibitors of the Kv10.1 channel, known to regulate cell cycle [
61], drug resistance and tumor progression [
91], some of which have already been proposed for clinical applications [
78]. In particular, it will be interesting to analyze the effectiveness of the potential synergistic action of TG2 inhibitors and astemizole which are known to work in combination with other drugs [
92,
93] which in this case would also have the same target, the Kv10.1 channel [
94].A synergy of TG2 plus Kv10.1 inhibitors could be effective, especially in those BC types presenting mutations leading to overexpression of the K+ channel, such as TP53 in MDA-MB-231 [
95]. This would represent a potential treatment of more aggressive BCs, which often show upregulation of TG2 expression [
31,
96], and identify AA9 as a good adjuvant candidate. However, with the goal of clinical application, we must not forget that TG2, despite its dysregulation in cancer, has ubiquitous tissue distribution in normal cells, so it will be important to direct inhibition against specific targets exclusive to cancer cells, in order to develop delivery systems aimed at obtaining an effective selective treatment. Non-specific effects could be overcome using nanobodies, as in the administration of Kv10.1 blockers, improving the selectivity for specific tumor cells [
97].

留言 (0)