


記住我


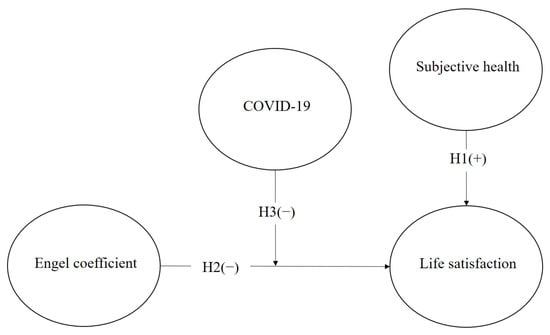
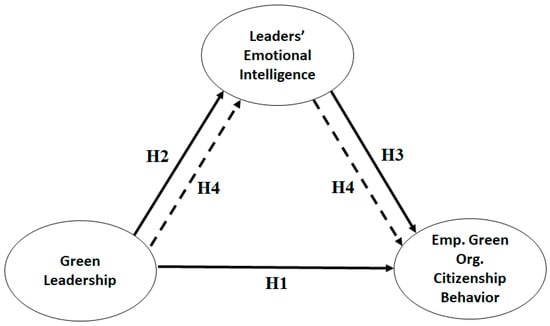

Figure 1. Research model.
Figure 2. Age-information histogram.
Figure 3. Moderating effect of COVID-19 between life satisfaction and Engel coefficient.
Table 1. Variable description.
Table 1. Variable description.
NameCodeDescriptionLife satisfactionLSA(0 = Very poor, 100 = Very good)Subjective healthSHE(1 = Very bad, 5 = Very good)Engel coefficientENG[(Food expenditure + Eating out expenditure)/Living expenditure] × 100COVID-19COV(0 = participants in 2018, 1 = participants in 2020) GenderGEN(0 = Male, 1 = Female)AgeAGEPhysical age of survey participants Personal assets ASTPersonal assets (10,000 KRW)Table 2. Descriptive statistics (n = 3879).
Table 2. Descriptive statistics (n = 3879).
VariableMeanSDMinimumMaximumLSA64.6412.684100SHE2.90.8515ENG34.9612.02083.33COV0.490.4901GEN0.350.4701AGE72.099.257102AST31,218.5142,186.180818,000Table 3. Correlation matrix (n = 3879).
Table 3. Correlation matrix (n = 3879).
Variable1234561. LSA1 2. SHE0.282 *1 3. ENG−0.116 *−0.0071 4. COV0.039 *−0.0120.085 *1 5. GEN0.042 *0.100 *0.0060.181 *1 6. AGE−0.184 *−0.395 *0.052 *0.105 *−0.029 *17. AST0.219 *0.102 *−0.078 *0.028 *0.048 *−0.080 *Table 4. Results of hypotheses testing (n = 3879).
Table 4. Results of hypotheses testing (n = 3879).
VariableModel1Table 5. Results of hypotheses testing: subsample analysis (N2018 = 2011; N2020 = 1868).
Table 5. Results of hypotheses testing: subsample analysis (N2018 = 2011; N2020 = 1868).
VariableModel 2Table 6. Mean values for moderating effect of COVID-19 (n = 3879).
Table 6. Mean values for moderating effect of COVID-19 (n = 3879).
LSALow ENGHi ENG202066.7263.40201865.7562.05Table 7. Results of independent t-test regarding COVID-19.
Table 7. Results of independent t-test regarding COVID-19.
VariablePre-COVID-19
留言 (0)