


記住我
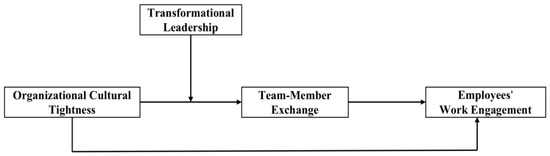


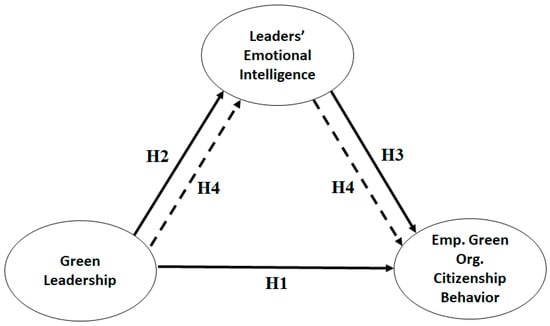

Figure 1. Theoretical Framework.
Figure 2. Results of PLS-SEM analysis.
Table 1. Demographic Characteristics of Respondents (n = 422).
Table 1. Demographic Characteristics of Respondents (n = 422).
ParticularsDescriptionValuesPercentageType of IndustryManufacturing17341%Services24959%GenderFemale21551%Male20749%Prefer not to say41%AgeLess than 2013532%20–3020348%31–405914%41–5082%50+133%Years of experienceLess than 513131%5–1020749%11–156816%16–2061.50%More than 20112.60%Position within the organizationOperational staff16539%Junior management15236%Middle management9723%Top management92.08%Organizational statusPublic19446%Private22854%Table 2. Factor Loading, Mean, SD, CA, CR, AVE.
Table 2. Factor Loading, Mean, SD, CA, CR, AVE.
VariablesItemsLoadingMeanSDCACRAVEGreen LeadershipGL 10.6560.3560.0480.8430.8810.555GL 20.724GL 30.760GL 40.830GL 50.752GL 60.732Emotional IntelligenceEI 10.6630.3750.0400.9240.9330.521EI 40.648EI 50.730EI 60.620EI 70.805EI 80.737EI 100.765EI 110.763EI 120.694EI 130.740EI 140.739EI 150.786EI 160.663Green Organization Citizenship BehaviorGOCB 10.6850.4690.0350.8430.8810.521GOCB 20.805GOCB 30.817GOCB 40.778GOCB 50.648GOCB 70.748GOCB 80.826Table 3. Fornell–Larcker Criterion (Discriminant validity).
Table 3. Fornell–Larcker Criterion (Discriminant validity).
VariablesEIOCBSLEI0.719 GOCB0.4520.732 GL0.4580.4990.751Table 4. Heteotriat–Monotrait (HTMT) Ratio of Correlation.
Table 4. Heteotriat–Monotrait (HTMT) Ratio of Correlation.
HTMTLD SEA0.524 OEA0.5980.551 UoA0.4990.4760.54 RoA0.4990.4880.4520.732 OCB0.610.5290.4580.4990.541 LDSEAOEAUoARoAOCB
留言 (0)