


記住我


Conceptualization, Á.A.-S. and D.V.; methodology, Á.A.-S. and D.V.; validation, Á.A.-S., D.V., E.M. and M.S.-C.; formal analysis, Á.A.-S.; investigation, Á.A.-S., D.V., E.M. and M.S.-C.; data curation, Á.A.-S., D.V., E.M. and M.S.-C.; writing—original draft preparation, Á.A.-S., D.V., E.M. and M.S.-C.; writing—review and editing, Á.A.-S., D.V., E.M. and M.S.-C. All authors have read and agreed to the published version of the manuscript.
Figure 1. Evolution of the GII of Venezuela and countries with a low level of digitization, Guatemala, Bolivia, and Honduras, in the period 2011–2022.
Figure 1. Evolution of the GII of Venezuela and countries with a low level of digitization, Guatemala, Bolivia, and Honduras, in the period 2011–2022.
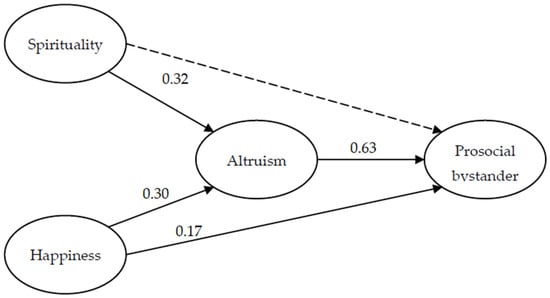
Figure 2. Research variables of the study.
Figure 2. Research variables of the study.
Figure 3. Distribution of Venezuelan participants by areas of knowledge.
Figure 3. Distribution of Venezuelan participants by areas of knowledge.
Figure 4. Distribution of Venezuelan participants by university tenure.
Figure 4. Distribution of Venezuelan participants by university tenure.
Figure 5. Distribution of participants from countries with low GIIs—Bolivia, Honduras, and Guatemala—by areas of knowledge.
Figure 5. Distribution of participants from countries with low GIIs—Bolivia, Honduras, and Guatemala—by areas of knowledge.
Figure 6. Distribution of participants from countries with low GIIs—Bolivia, Honduras, and Guatemala—by university tenure.
Figure 6. Distribution of participants from countries with low GIIs—Bolivia, Honduras, and Guatemala—by university tenure.
Figure 7. Research phases.
Figure 7. Research phases.
Table 1. Countries in Latin America and the Caribbean and their corresponding GIIs.
Table 1. Countries in Latin America and the Caribbean and their corresponding GIIs.
CountryGII (out of 100)Chile36.1Mexico34.5Costa Rica34.5Brazil34.2Uruguay32.2Colombia31.7Peru31.2Argentina29.8Panama28.0Paraguay26.4Ecuador25.4El Salvador25.0Guatemala24.1Bolivia23.4Honduras22.8Table 2. Questions of the research instrument.
Table 2. Questions of the research instrument.
VariableNumberQuestionsDigital competence1Rate your digital skills2Rate your ability to adapt to digital learning environments3Rate your capacity for continuous learning4Rate your digital communication skills5Rate your creativity when using digital teaching resources6Rate your knowledge of information management7Rate your network leadership8Rate your ability to orient your didactic actions towards the student in digital environments9Rate your resilience10Rate your ability to teamwork11Rate your strategic visionProfessional aspects12Value the support of the university in the process of digitization of teaching13Value the technical equipment of the university14Value the training received in digital matters to face the digitalization processDigital stress 15I feel insecure16I feel anxious17I feel that difficulties are piling up18I feel unable to face the new challenges of the digitalization of teaching19I feel irritable20I feel more nervous than usual21I feel anxious about the risk of contagion22I do not feel able to control the situationTable 3. Factors identified by the EFA and factorial weights.
Table 3. Factors identified by the EFA and factorial weights.
QuestionsFactor 1Table 4. Cumulative proportion of explained variance of the principal component analysis.
Table 4. Cumulative proportion of explained variance of the principal component analysis.
Digital CompetenceProfessional AspectsDigital StressProportion variance0.0950.3540.190Cumulative variance0.0950.4490.639Table 5. Cronbach’s alphas and CR parameters.
Table 5. Cronbach’s alphas and CR parameters.
VariableCronbach AlphaCRDigital competence0.95870.9419Professional aspects0.79950.7801Digital stress0.88800.8820Table 6. Descriptive statistics of the responses of the professors in Venezuela.
Table 6. Descriptive statistics of the responses of the professors in Venezuela.
VariableMean (Out of 5)Standard Deviation (Out of 5)Coefficient of VariationSkewnessDigital competence3.610.9726.96−0.39Professional aspects2.901.2543.180.07Digital stress2.481.2650.640.50Table 7. Lilliefors normality test statistics.
Table 7. Lilliefors normality test statistics.
VariableLilliefors DLilliefors p-valueDigital competence0.2215<0.0001Professional aspects0.1513<0.0001Digital stress0.2214<0.0001Table 8. Mixed linear regression model statistics of digital stress with respect to digital competence and the valuation of professional aspects in Venezuelan professors.
Table 8. Mixed linear regression model statistics of digital stress with respect to digital competence and the valuation of professional aspects in Venezuelan professors.
VariableEstimateStd. Errort-Valuep(>t)Digital competence−0.32770.0788−4.1570<0.0001Professional aspects0.27230.05634.8330<0.0001Independent term3.30870.282511.7130<0.0001Table 9. Mixed linear regression model statistics of digital stress with respect to digital competence and the valuation of professional aspects in professors from countries with low GIIs: Bolivia, Honduras, and Guatemala.
Table 9. Mixed linear regression model statistics of digital stress with respect to digital competence and the valuation of professional aspects in professors from countries with low GIIs: Bolivia, Honduras, and Guatemala.
VariableEstimateStd. Errort-Valuep(>t)Digital competence−0.04140.0659−0.62800.5304Professional aspects−0.11290.0553−2.04300.0515Independent term3.62310.293012.3650<0.0001Table 10. Mean values (out of 5) and statistics of the bilateral Wilcoxon test for the comparison of means between professors from Venezuela and professors from Latin American countries with low GIIs: Bolivia, Honduras, and Guatemala.
Table 10. Mean values (out of 5) and statistics of the bilateral Wilcoxon test for the comparison of means between professors from Venezuela and professors from Latin American countries with low GIIs: Bolivia, Honduras, and Guatemala.
VariableVenezuelaLow GII CountriesWilcoxon WWilcoxon p-ValueDigital competence3.613.941,247,934<0.0001Professional aspects2.903.4395,100<0.0001Digital stress2.482.75620,340<0.0001Table 11. Linear regression model to explain the responses of Venezuelan professors based on those of professors in countries with low GIIs (Bolivia, Honduras, and Guatemala) for each of the variables analyzed.
Table 11. Linear regression model to explain the responses of Venezuelan professors based on those of professors in countries with low GIIs (Bolivia, Honduras, and Guatemala) for each of the variables analyzed.
Variable EstimateStd. Errort-Valuep(>t)Digital competenceSlope0.030.031.060.2880Independent term3.850.1035.52<0.0001Professional aspectsSlope0.070.041.630.1040Independent term3.260.1423.65<0.0001Digital stressSlope0.050.031.880.0604Independent term2.630.0832.64<0.0001Table 12. Mean values (out of 5) and statistics of the bilateral Wilcoxon test for comparison of means between female and male professors from Venezuela.
Table 12. Mean values (out of 5) and statistics of the bilateral Wilcoxon test for comparison of means between female and male professors from Venezuela.
VariableMean (Females)Mean (Males)Wilcoxon WWilcoxon p-ValueDigital competence3.583.64254,0210.4327Professional aspects2.922.8818,1620.7743Digital stress2.652.27108,311<0.0001Table 13. Mean responses (out of 5) of Venezuelan professors differentiated by areas of knowledge and gender.
Table 13. Mean responses (out of 5) of Venezuelan professors differentiated by areas of knowledge and gender.
VariableHumanitiesSciencesHealthSocial SciencesEngineeringFMFMFMFMFMDigital competence3.563.652.453.363.643.093.843.053.974.43Professional aspects3.083.002.002.672.673.003.202.172.443.33Digital stress2.332.002.502.131.884.133.352.883.211.84Table 14. Mean responses (out of 5) of Venezuelan professors differentiated by university tenure and gender.
Table 14. Mean responses (out of 5) of Venezuelan professors differentiated by university tenure and gender.
VariablePrivatePublicFemalesMalesFemalesMalesDigital competence4.023.843.493.57Professional aspects3.673.132.772.79Digital stress2.812.182.612.30Table 15. Mean values (out of 5) and statistics of the bilateral Wilcoxon test for comparison of means between female and male professors from countries with low GIIs: Bolivia, Honduras, and Guatemala.
Table 15. Mean values (out of 5) and statistics of the bilateral Wilcoxon test for comparison of means between female and male professors from countries with low GIIs: Bolivia, Honduras, and Guatemala.
VariableMean (Females)Mean (Males)Wilcoxon WWilcoxon p-ValueDigital competence4.083.76216,568<0.0001Professional aspects3.613.1915,9040.0027Digital stress2.632.92156,448<0.0001Table 16. Mean responses (out of 5) of professors from countries with low GIIs (Bolivia, Honduras, and Guatemala), differentiated by areas of knowledge and gender.
Table 16. Mean responses (out of 5) of professors from countries with low GIIs (Bolivia, Honduras, and Guatemala), differentiated by areas of knowledge and gender.
VariableHumanitiesSciencesHealthSocial SciencesEngineeringFMFMFMFMFMDigital competence4.184.683.913.473.363.504.803.953.553.67Professional aspects3.893.673.443.273.672.334.003.673.173.00Digital stress2.503.562.692.652.133.882.602.252.782.75Table 17. Mean responses (out of 5) of professors from countries with low GIIs (Bolivia, Honduras, and Guatemala), differentiated by university tenure and gender.
Table 17. Mean responses (out of 5) of professors from countries with low GIIs (Bolivia, Honduras, and Guatemala), differentiated by university tenure and gender.
VariablePrivatePublicFemalesMalesFemalesMalesDigital competence4.274.243.543.40Professional aspects3.693.283.403.13Digital stress2.653.082.552.80
留言 (0)