Study design and data sources
We conducted a retrospective, cross-sectional study using data from the Behavioral Risk Factor Surveillance System (BRFSS). The BRFSS is a telephone survey administered by the Population Health Surveillance Branch of the Centers for Disease Control and Prevention (CDC) [17]. The survey annually assesses health-related risk behaviors, chronic conditions, and preventive care usage from U.S. adults. The median response rate of the BRFSS survey was between 43 and 49% [18]. In this study, we only included data from states adopting the diabetes module continuously in 2013, 2015, 2017, and 2019. We chose odd years based on the higher adoption of the diabetes module across various states. We followed the Strengthening the Reporting of Observational Studies in Epidemiology (STROBE) guidelines for the reports of this study [19].
Study population
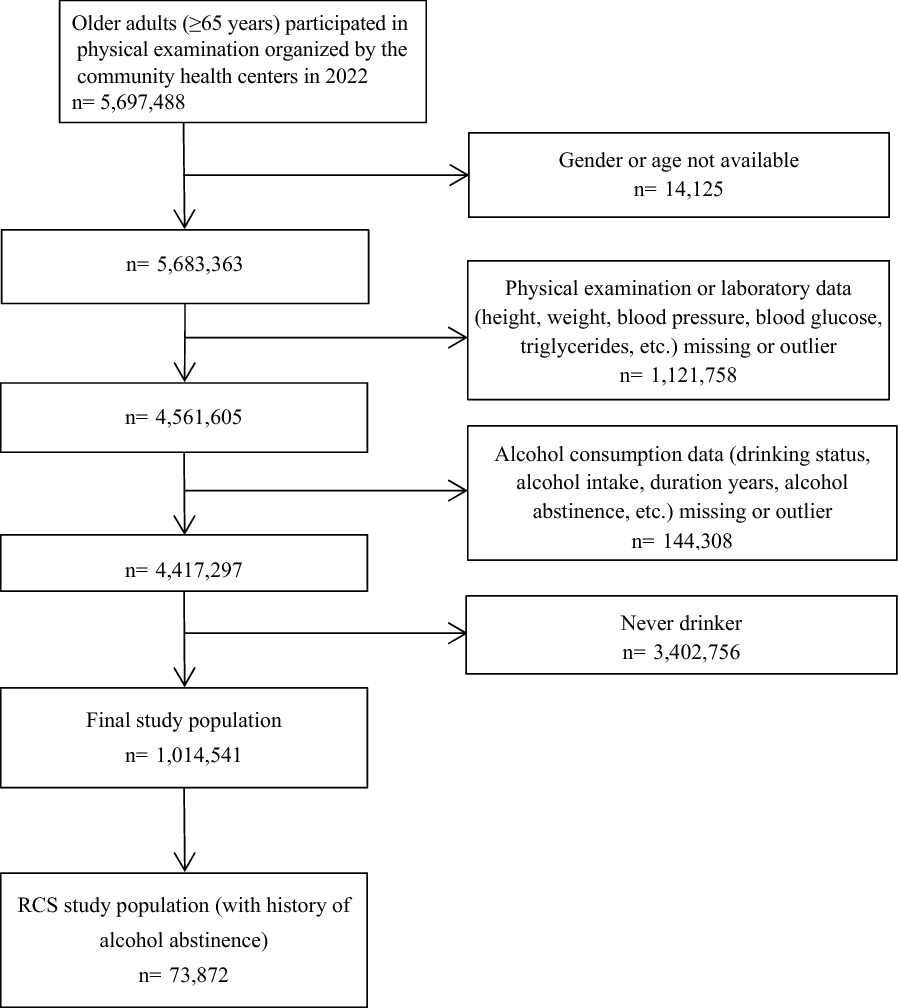
Adult (≥ 18 years old) respondents with self-reported diabetes were included in this study based on the following survey question: “(Ever told) you had diabetes?” Respondents who answered “yes” were included, while respondents who answered any of the following were excluded: “yes, but only during pregnancy,” “don’t know,” “refused,” or missing.
Outcome measures
The outcomes assessed included diabetes management behaviors (i.e., self-check for blood glucose and feet sores/irritation, regular diabetes clinical visit, HbA1c check, professional feet check, and dilated eye examination) and lifestyle behaviors (i.e., exercise, smoking, and alcohol consumption). The selection of these nine behaviors was based on questions from the BRFSS core and diabetes modules [20]. For the remainder of this report, we refer to these nine behaviors simply as diabetes management behaviors. Each outcome variable was recoded as a binary variable. The recommended frequencies for behaviors were as follows: self-check feet sores or irritation (≥ once per day vs. < once per day), self-glucose check (≥ once per day vs. < once per day), biannual diabetes clinical visit (≥ 2 times per year vs. < 2 times per year), biannual HbA1c check (≥ 2 times per year vs. < 2 times per year), annual feet check by a professional (≥ 1 time per year vs. < 1 time per year), annual dilated eye examination (≥ 1 time per year vs. < 1 time per year), alcohol consumption (no/moderate use vs. use), smoking (no use vs. use), and proper exercise (≥ 150 min per week vs. < 150 min per week) [13]. Please see Additional file 1: Table S1 for detailed survey questions for each outcome variable.
Independent variables/covariates
Each outcome was assessed according to depression status (with depression vs. without depression). The depression status was based on the following question: “(Ever told) you had a depressive disorder (including depression, major depression, dysthymia, or minor depression)?” Hereinafter, our mentions of depression refer to a history of depression. Respondents who answered “don’t know” or “refused” or missing responses were taken as missing data and excluded from the study (0.5% missing; 394 out of 74,011 study population).
We assessed mental distress level using the following question: “For how many days during the past 30 days was your mental health not good?” Respondents may answer a number of poor mental health days between 0 and 30, “refuse,” “unknown,” or missing. We categorized respondents’ poor mental health days into different mental distress levels using the following criteria: no distress (0 days of poor mental health), low distress (1–13 days of poor mental health), and high distress (\(\ge\)14 days of poor mental health) [21]. Mental distress level was assessed because it was previously shown to be associated with depression [21, 22], and mental distress could also be a potential hinderance to perform diabetes management behaviors [23]. For mental distress, we also excluded the “refused,” “unknown,” or missing data as we did for the depression variable (2.3% missing; 1707 out of 74,011 study population).
For covariates, we included the following social-demographic characteristics: age, sex, race/ethnicity, marital status, education, geographical region of residency, employment status, and income. We also considered “received diabetes education” and “had access to care” as covariates since both variables could influence diabetes management outcomes [24, 25]. Please see Additional file 1: Table S2 for detailed survey questions for covariates.
Missing dataDependent/outcome variables
A previous study evaluated the outcome variables used by our research and found a consistent pattern for missing data, pointing out the data may be missing due to interviewers skipping the questions [26]. Hence, we excluded missing data during analyses but reported the proportion of missingness for each behavior outcome in Additional file 1: Table S1.
Covariates
We applied the Hot-deck imputation methods to replace missing social-demographic variables, such as age, sex, race/ethnicity, marital status, income, etc., assuming data were missing at random (MAR). Hot-deck imputation is a method replacing missing data with responses from respondents with similar characteristics [27]. The imputation was performed before selecting the study population. We also reported the proportion of missing values for each covariate in the Additional file 1: Table S2. For the “healthcare access” and “diabetes education” variables, responses of “refused,” “unknown,” or missing data were all categorized as “unknown” and remained in data analyses.
Statistical analysis
Descriptive analyses were applied to compare demographic characteristics of those with and without depression. We evaluated the percentages of diabetes management behaviors based on respondents’ depression status and mental distress levels. We used the unadjusted and adjusted logistic regression to assess the associations between diabetes management behaviors and depression. The complex sampling design of BRFSS was incorporated during analyses, and samples were weighted to represent the state population. An a priori level of significance was set at 0.05, and hypothesis tests were 2-sided. Analyses were completed using SAS, version 9.4 (SAS Institute, Cary, NC, USA).
Sensitivity analysis
The missing values of covariates in the adjusted logistic regression were imputed based on the assumption that the data was MAR. However, studies showed that the assumption of MAR for income data may not hold [28, 29]. For example, the population with missing income data may be more likely to be younger, less educated, unmarried, or to have received delayed care [29]. We conducted sensitivity analyses incorporating worst-case and best-case scenarios (i.e., imputing missingness to the lowest and the highest income category), and evaluated the estimates of depression under different income assumptions [30, 31].

留言 (0)