
記住我
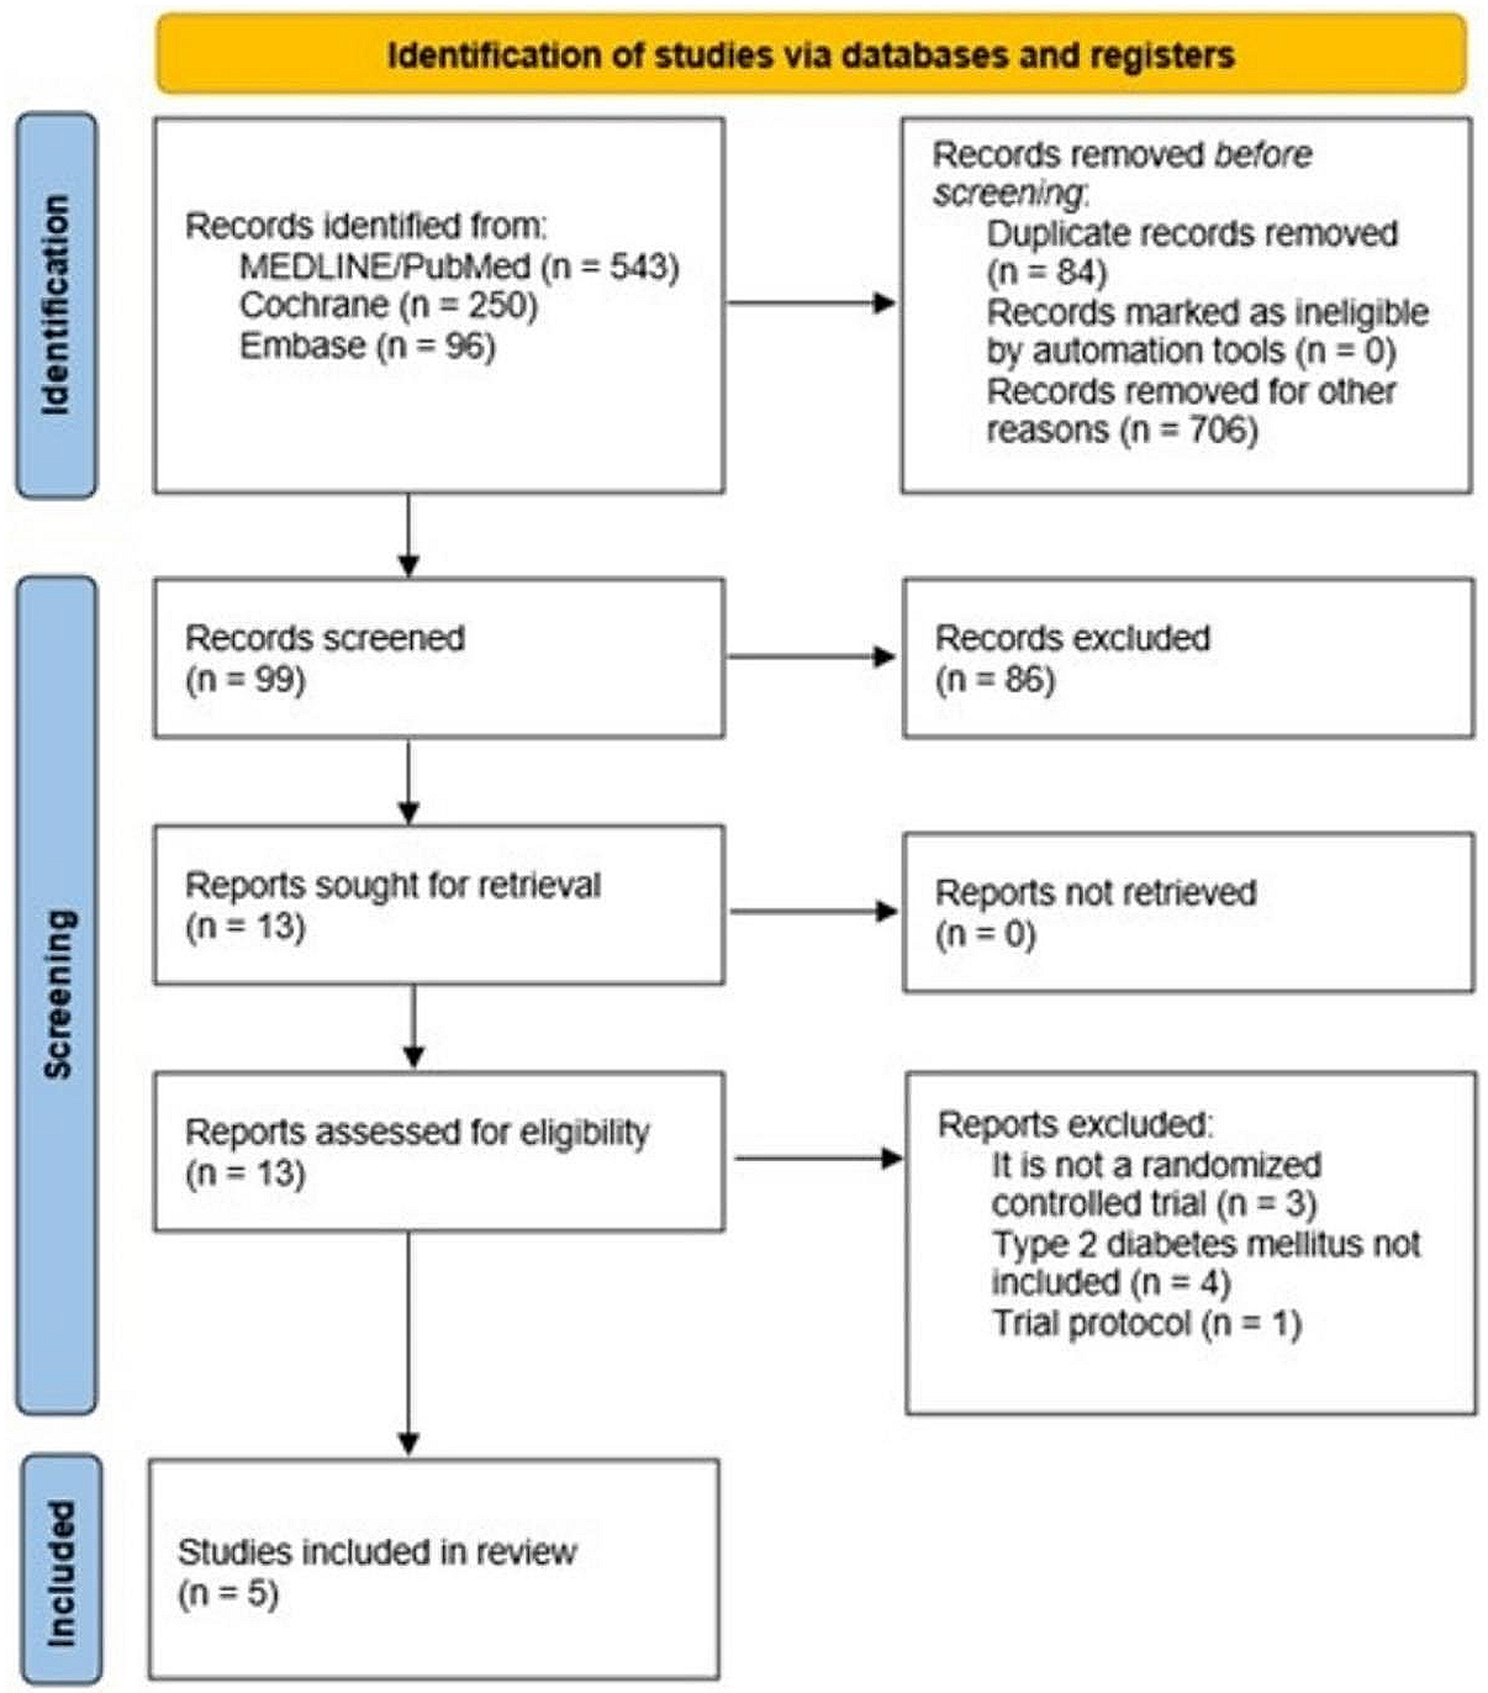


As shown in Fig. 1, a total of 13,315 people met the criteria. The maximum follow-up period was 132 months. Figure S1 shows the missing proportion of each variable, and Table S1 shows the variance inflation factor of each variable, indicating that there is no multicollinearity among the variables. Of the total population, 6,433 (48%) were male, with the largest proportion of non-Hispanic whites (5,251 (39%)), 438 (3%) had congestive heart failure, and 533 (4%) had coronary heart disease, 497 (4%) had stroke, 254 (2%) had Emphysema, and 1195 (9%) had Cancer or malignancy. According to the SHR quartiles, the number of patients was divided into four equal parts, namely Quartile 1 (0.109 ≤ SHR < 0.839), Quartile 2 (0.839 ≤ SHR < 0.906), Quartile 3 (0.906 ≤ SHR < 0.986), and Quartile 4 (0.986). ≤ SHR ≤ 2.79). Table 1 shows the baseline characteristics of the study subjects. Patients in Quartile 4 had higher BMI, NEU, Hemoglobin, RBC, WBC, BUN, Creatinine, Albumin, AST, and ALT, and had lower PLT.
Fig. 1
Selection of study population from NHANES (2009–2018)
Table 1 Patient demographics and baseline characteristicsRestricted cubic splinesIn the analyses of all-cause mortality (Fig. 2) and diabetes mellitus mortality (Fig. 3) events, RCS analysis adjusted for the effects of gender, age, ethnicity, and BMI revealed a “U-shaped” association between SHR and the risk of outcome events. The inflection points of the RCS curves were at SHR = 0.87 and SHR = 0.83, both in Quartile 2, representing the turning points in the relationship between SHR and the occurrence of outcome events. Therefore, Quartile 2 was defined as the reference category.
Fig. 2
RCS results for all-cause mortality
Fig. 3
RCS results for diabetes mellitus mortality
Clinical outcomesThe number of all-cause mortality for Quartiles 1–4 were 293, 208, 198, and 288 respectively, while the number of diabetes mellitus mortality were 8, 2, 7, and 18 (Table 2). For all-cause mortality (Table 3), with Quartile 2 as the reference, in Model I, the HR (95% CI) for Quartiles 1, 3, and 4 were 1.36 (1.14–1.63), 0.99 (0.82–1.20), and 1.54 (1.29–1.84) respectively. In Model II, the corresponding values were 0.98 (0.82–1.17), 0.95 (0.78–1.15), and 1.24 (1.03–1.49), with Quartile 4 showing significant differences. For diabetes mellitus mortality (Table 4), with Quartile 2 as the reference, in Model I, the HR (95% CI) for Quartiles 1, 3, and 4 were 3.84 (0.82–18.1), 3.65 (0.76–17.6), and 10.1 (2.34–43.6) respectively. In Model II, the corresponding values were 2.42 (0.50–11.7), 3.10 (0.64–15.1), and 5.66 (1.28–25.0), with Quartile 4 showing significant differences. K-M curves show that in all-cause mortality (Fig. 4) and diabetes mellitus mortality (Fig. 5), patients in Quartile 4 had the lowest survival probabilities, and the differences were significant.
Table 2 All-cause mortality and diabetes mellitus mortalityTable 3 COX regression model (All-cause mortality)Table 4 COX regression model (Diabetes mellitus mortality)Fig. 4
K-M survival curve (All-cause mortality)
Fig. 5
K-M survival curve (Diabetes mellitus mortality)
Subgroup AnalysisTable 5 presents the results of subgroup analysis for all-cause mortality. In the Age < 65 and female group, Quartile 4 showed a higher risk of death regardless of covariate adjustment, while no differences were observed in the Age ≥ 65 and male groups. Table 6 presents the results of subgroup analysis for diabetes mellitus mortality. In the Age < 65, male, and female groups, Quartile 4 exhibited a higher risk of death regardless of covariate adjustment. Table S2 shows the incidence rates of comorbidities in the population grouped by age. Individuals aged ≥ 65 years had higher rates of congestive heart failure, coronary heart disease, stroke, emphysema, and cancer or malignancy.
Table 5 Subgroup analysis for all-cause mortalityTable 6 Subgroup analysis for diabetes mellitus mortalityEstablishment and validation of the Prediction ModeVariables with a P-value < 0.05 in the univariate analysis were included in the multivariable analysis. The results of the multivariable analysis can be found in Table S3. Based on the principle of simplicity in inquiry, the variables SHR, Age, Smoking status, Gender, Race, Congestive heart failure, Coronary heart disease, Stroke, and Cancer or malignancy were included in the eight machine learning algorithms models. Figure 6 shows the ROC curves of each model. XGBoost has the largest AUC value (0.8688). The AUC values of other models are DT (0.8512), KNN (0.7966), RF (0.8417), Logistic regression (0.8633), and ENET (0.8626). ), SVM (0.8327), MLP (0.8662). Figure S2 shows the calibration curve of each model, and the calibration curve of the XGBoost model does not deviate significantly from the reference line, indicating that it has good predictive performance. According to the DCA curve (Figure S3), the XGBoost model showed greater net benefit, indicating that XGBoost has good clinical effectiveness.
Fig. 6
ROC curves of eight machine learning algorithm models
In order to facilitate the use of clinicians and researchers, we used the Shiny platform to develop a web application based on the XGBoost model (https://shrpmci.shinyapps.io/xgboost/). The clinical characteristics of the new sample can be entered in the corresponding location of the web interface. The web application can then help predict the 132-month risk of all-cause mortality based on the individual’s information.
Mediation analysisThe mediation analysis results show that SHR has a significant overall effect on survival, with coefficients and p-values as shown in Table S4. The range of mediation proportions for each covariate ranges from negative values to 23.1%. Covariates exhibiting positive indirect mediation include segmented neutrophils and AST, with mediation effects of 6.3 (3.0, 46.7) and 1.5 (0.1, 7.9) respectively. Covariates exhibiting negative mediation include hemoglobin, RBC, albumin, and ALT, with mediation effects of -69.3 (-248.7, -34.1), -36.1 (-171.6, -15.3), -44.4 (-181.8, -20.4), and − 19.4 (-74.9, -6.9) respectively.
留言 (0)