
記住我
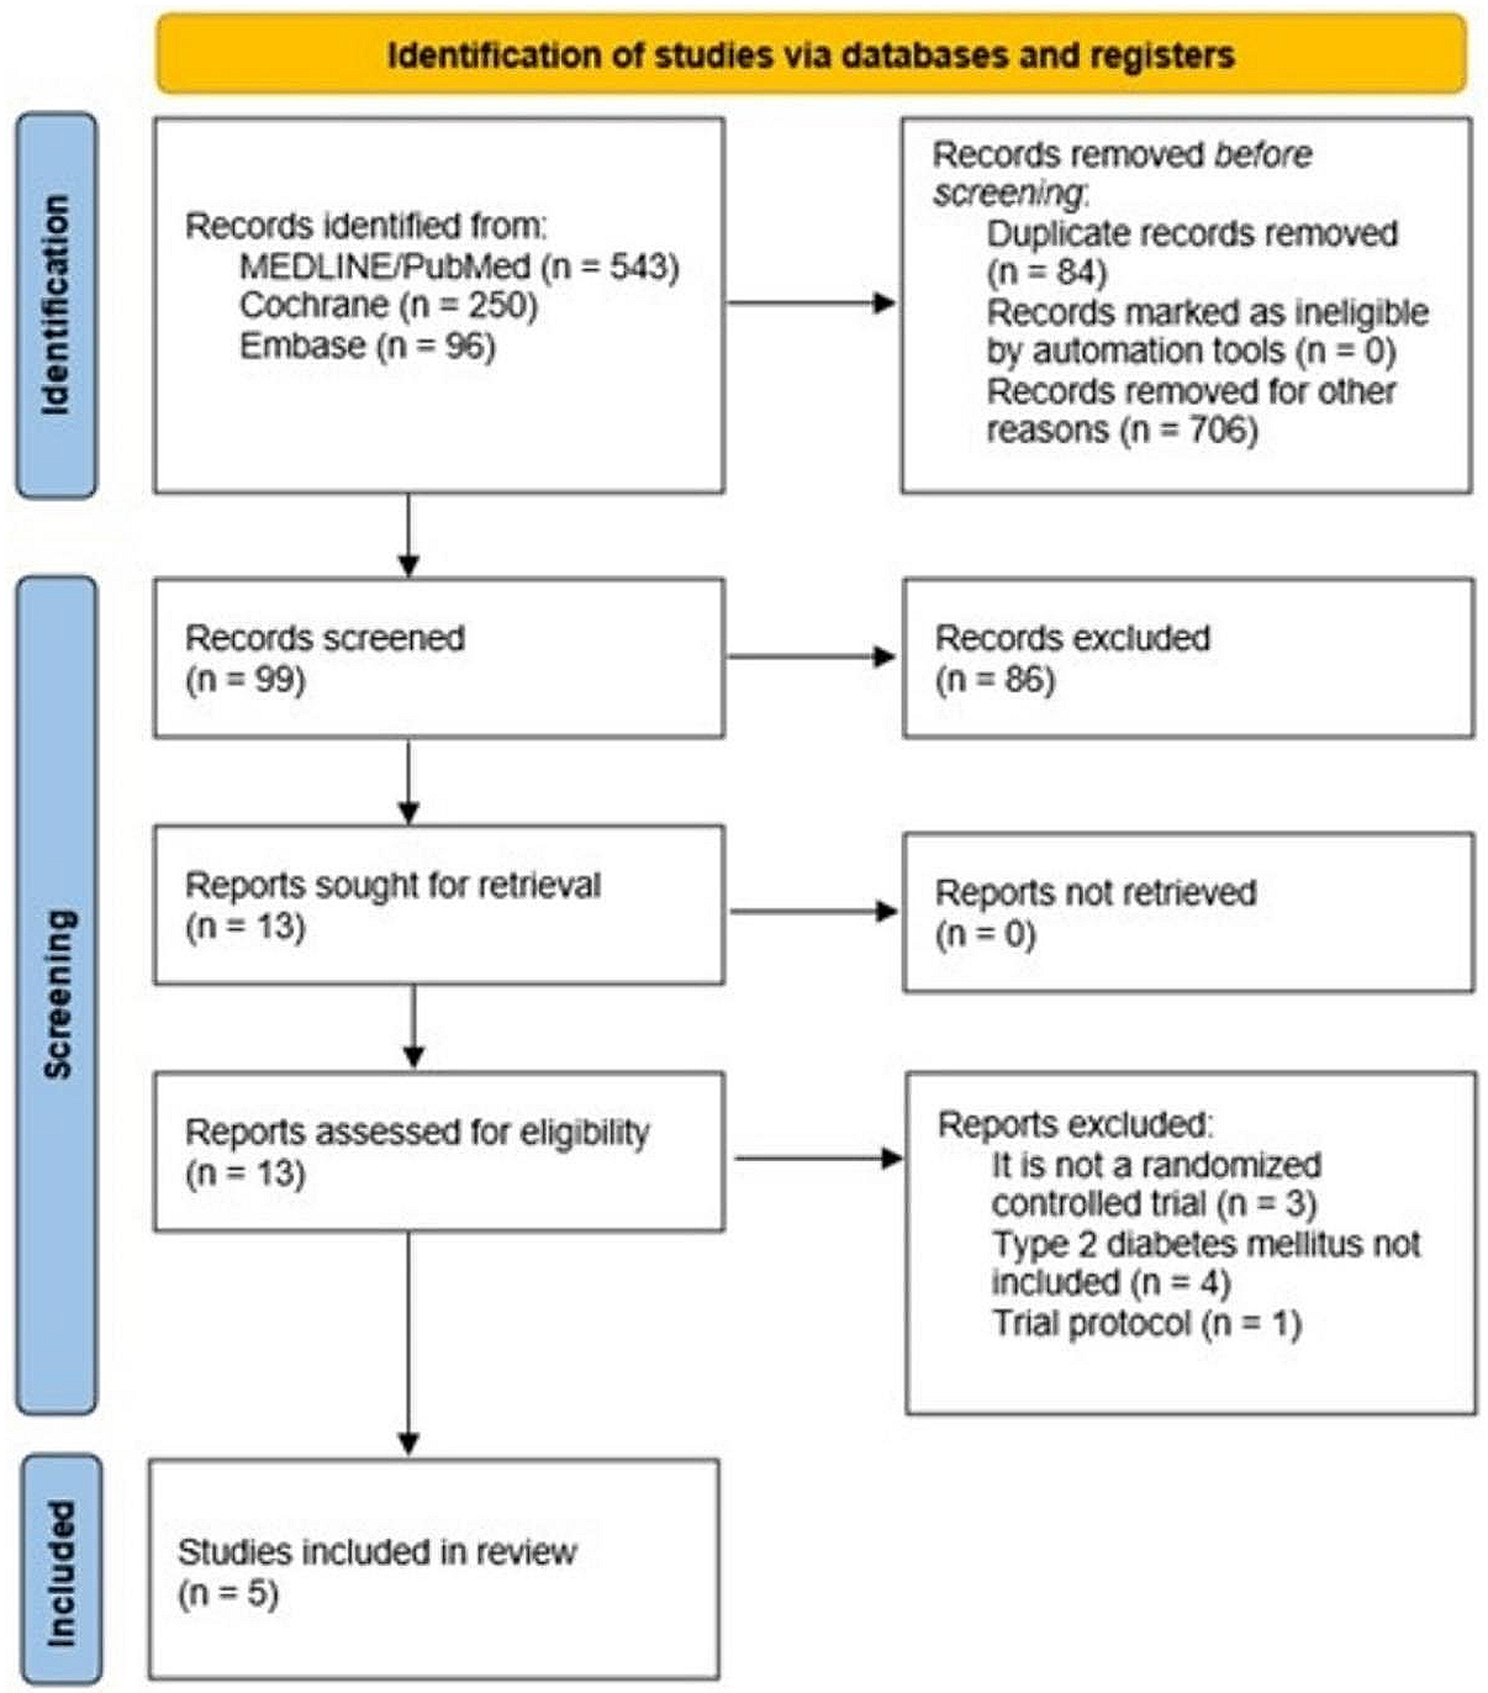


As shown in Fig. 1, the early search resulted in 7769 studies after duplicate removal. After the first screening and reading the article’s title and abstract, 6480 papers were excluded due to the unrelated titles. In the second phase of screening, 1216 articles were again excluded due to the unrelated data, animal subjects, being review articles, etc. In total, 73 papers were evaluated for eligibility, and 43 articles were excluded for the following reasons: maternal exposure was not assessed, the concentration of chemicals was not reported, risk estimate was not reported, and two studies were based on the same data. Finally, 30 studies were included for the final analysis [16,17,18,19,20,21,22,23,24,25,26,27,28,29,30,31,32,33,34,35,36,37,38,39,40,41,42,43,44,45].
Fig. 1
PRISMA flow diagram of study selection
The characteristics of the included studies in this systematic review and meta-analysis have been presented in Table 1. These studies were published among 2008 to 2022, and all included studies had a cohort design. Among the included studies, ten studies were reported from the USA and twenty from other countries. Studies included in the final analysis were conducted in several countries, including: Spain [18, 20, 24, 29, 33, 35], China [22, 44], USA [17, 19, 26, 27, 31, 36, 40, 42], Italy [45], Netherland [21], Denmark [23, 39], Korea [25, 30, 43], Belgium [41], Canada [32, 34], and Greece [28, 29]. Except of one cohort study that evaluated prenatal exposure to the EDCs in newborns, other studies assessed this association in the age of 2 to 8 years. The number of cases varied from 105 to 4065. The type of evaluated EDCs was different in most studies. As mentioned, we categorized and evaluated EDCs into four main groups, including BPA, phthalates, pesticides, and other EDCs. Based on this category, eleven studies evaluated BPA, twelve studies assessed phthalates, ten evaluated pesticides, and finally, eleven cohorts examined other EDCs. It should be noted that some studies have examined more than one EDC. In terms of the study quality, the total score quality was shown in Table 1, and the detailed score for each study was reported in Additional file 1: Table S2. According to the total score, nine studies had moderate-quality, and others had good quality.
Table 1 Characteristics of the included studiesAssociation between maternal exposures to the EDCs with the glycemic profileOnly two studies evaluated the effects of maternal EDC exposure with child’s FBS [22, 45]. Warner et al. included 426 children in their study and evaluated the association between maternal 2,3,7,8-tetrachlorodibenzo-p-dioxin (TCDD) and glycemic profile in children. Maternal exposure to the TCDD showed an inverse association with serum insulin (adj-β = -1.24 μIU/mL, 95% confidence interval (CI): -2.38, -0.09) and HOMA2-B (adj-β = − 10.2% decrease, 95% CI: − 17.8, − 1.9) in girls, but these associations were not statistically significant among boys (insulin: adj-β = 0.57 μIU/mL, 95% CI: − 0.84, 1.98, P for interaction = 0.04; and HOMA2-B: adj-β = 0.8% increase, 95% CI -10.7, 13.9, P for interaction = 0.11) [45]. In addition, medium maternal prenatal BPA level showed a moderately significant association with serum plasma glucose in boys 0.36 (95% CI: 0.04 to 0.68) in another study. However, no associations were found between prenatal exposure to BPA and serum insulin level in girls and boys [22].
Association between maternal exposures to EDCs with lipid profileOverall, six studies considered the association between the maternal exposure to the EDCs and serum TG level [19, 23, 24, 29, 30, 37]. These studies included 3334 participants. No significant association was seen between the maternal exposure to the EDCs and serum TG level (Fisher_Z: -0.02, CI: -0.05, 0.02) per doubling EDCs levels (Fig. 2).
Fig. 2
Overall effect of maternal exposure to the EDCs on serum triglyceride level in children
There was a high heterogeneity between studies (I2 = 97.8%, P < 0.001). The results of the subgroup analysis have been reported in Additional file 1: Table S3.
In a subgroup analysis, a significant association was found between maternal exposure to the EDCs and serum TG level in children, in studies performed at the second and third trimester of pregnancy. The visual inspection of the funnel plot has been presented in Additional file 1: Fig S1. The sensitivity analysis did not show any change in the results.
There was not a significant association between maternal exposure to the EDCs with serum TC (Fisher_Z: -0.02, CI: -0.05, 0.01). A significant heterogeneity was observed among studies (I2 = 86.4%, P < 0·001) (Fig. 3).
Fig. 3
Overall effect of maternal exposure to the EDCs on serum total cholesterol level in children
Subgroup analysis did not find any source of heterogeneity regarding serum TC. Also, there was not any evidence of publication bias in the Begg (P = 0.707), Egger's regression tests (P = 0.436) and the funnel plot (Additional file 1: Fig S2). Sensitivity analysis did not show any change in the results.
Five studies evaluated the associations between maternal exposure to the EDCs and serum HDL.C levels in children[19, 23, 24, 28, 37]. As shown in Fig. 4, there was not any significant association between EDCs and serum HDL.C (Fisher_Z: -0.02, CI: -0.06, 0.01). Studies showed a significant heterogeneity (I2 = 98.7%, P < 0·001). However, in the subgroup analysis, we found a significant association in each subgroup (Additional file 1: Table S4).
Fig. 4
Overall effect of maternal exposure to the EDCs on serum HDL-C in children
We did not find any evidence of publication bias according to the Begg (P = 0.462), and Egger's regression tests (P = 0.990) and funnel plot (Additional file 1: Fig S3). Sensitivity analysis did not show any change in the results.
Association between maternal exposures to the EDCs with blood pressureEight studies with 14 effect sizes reported the association between EDCs exposure with DBP [16, 18, 21, 22, 25, 28, 29, 33]. We found that EDCs exposure during pregnancy had a weakly significant correlation with lower DBP in children (Fisher_Z: -0.16, CI: -0.19, -0.13), with a significant heterogeneity between studies (I2 = 98.6%, P < 0·001) (Fig. 5). Subgroup analysis did not report any new findings (Additional file 1:Table 5). We did not find the source of heterogeneity in the subgroup analysis. We did not find any evidence of publication bias according to the Begg (P = 0.869), Egger's regression tests (P = 0.3), and funnel plot in term of DBP (Additional file 1: Fig S4).
Fig. 5
Overall effect of maternal exposures to the EDCs on DBP in children
Also, in eight studies with 15 effect sizes, the association between maternal exposure to the EDCs and SBP was reported. We found that maternal exposures to the EDCs had a weakly significant correlation with higher child’s SBP (Fisher_Z: 0.06, CI: 0.04, 0.08) (Fig. 6). The studies showed a significant heterogeneity (I2 = 94.2%, P < 0·001) (Fig. 5). Subgroup analysis did not find the source of the heterogeneity. We did not find any evidence of publication bias according to the Begg (P = 0.456), Egger's regression tests (P = 0.385) and the funnel plot (Additional file 1: Fig S4). Sensitivity analysis did not show any change in the results.
Fig. 6
Overall effect of maternal exposures to the EDCs on SBP in children
Association between maternal exposures to the EDCs with child’s BMI and WC z-scoreTwenty-one studies with 29 effect sizes reported the association between maternal exposures to the EDCs and child’s BMI z-score. As shown in Fig. 7, maternal exposure to the EDCs had a weakly significant correlation with higher BMI z-score in children (Fisher_Z: 0.04, CI: 0.03, 0.06). The included studies showed a significant heterogeneity (I2 = 91.3%, P < 0·001). Maternal exposures to the EDCs showed a significant effect on BMI z-score in the non-US countries, sampling the urine at the first trimester of pregnancy throughout all ages (P < 0.05) ( Additional file 1:Table 6). Moreover, maternal exposures to the BPA and pesticides showed a weakly significant correlation with BMI z-score in children (Fisher_Z: 0.14, CI: 0.08, 0.19, P < 0.001 for BPA and Fisher_Z: 0.1, CI: 0.08, 0.12, P < 0.001 for pesticides). Other EDCs showed a weak reverse association with BMI z-score in children (Fisher_Z: -0.09, CI: -0.13, -0.06, P < 0.001). The visual inspection of the funnel plot has been presented in Fig. 5S. Sensitivity analysis did not show any change in the results.
Fig. 7
Overall effect of maternal exposures to the EDCs on BMI z-score in children
Fourteen studies with nineteen effect sizes reported the association of maternal exposures to the EDCs with a child’s WC [18, 23, 24, 26,27,28, 32,33,34, 36,37,38,39, 41]. As shown in Fig. 8, there was a weakly significant association between maternal exposures to the EDCs and WC z-score in children (Fisher_Z: 0.06, CI: 0.03, 0.08). The included studies showed a significant heterogeneity (I2 = 99%, P < 0·001). The subgroup analysis showed a significant association between the maternal exposures to the EDC with WC z-score in the studies conducted in the USA, using urine samples in the first trimester of pregnancy and children ≤ 4. Moreover, a significant association was observed between maternal exposures to the BPA and pesticide with WC z-score. However, this association was reverse in the other EDCs (Additional file 1:Table 6). We did not find any evidence of publication bias according to the Begg (P = 0.063), Egger's regression tests (P = 0.556), and the funnel plot (Additional file 1: Fig S5). Sensitivity analysis did not show any change in the results.
Fig. 8
Overall effect of maternal exposures to the EDCs on WC z-score in children
留言 (0)