
記住我


From the initial search, 420 studies were collected in the period 2000–2020. In addition, five manuscripts were added from January to May 2021. After excluding non-English language written papers, screening, and eligibility, 38 articles were included (Fig. 1): 4 cross-sectional studies reporting prevalence data and 34 case reports, for a total of 114 patients [1, 2, 7,8,9,10,11,12,13,14,15,16, 20,21,22,23,24,25,26,27,28,29,30,31,32,33,34,35,36,37,38,39,40,41,42,43,44,45]. The number of patients in the 4 cross-sectional studies was 13, 19, 23, and 25 [7, 8, 31, 45]. The study by Park [31] reported 45 IPTL patients; however, only 23 of them had been studied with MRI and therefore, only these were considered in our paper. According to the evaluation scale by Moola [18], of the 34 case reports, 10 met all the criteria, considering that the parameter on adverse events/unanticipated events was not deemed applicable for any article (no adverse event or unanticipated event occurred). Almost all the case reports presented a good description of the current clinical condition, diagnostic tests, and treatments performed but did not report the complete characteristics of the lesions: some studies reported only the features of the unenhanced examination or only those of the CE sequences, with or without HBP and DWI. The most missing data are concentrated on demographic characteristics and patient history. The insufficient data mainly concern race, medical history, previous treatment, medications routinely used by the patient, and family history. According to the evaluation scale by Munn [19], of the 4 manuscripts that fall into the cross-sectional study category, one fully meets all the criteria. The other 3 partially lack some data, such as morbidities, medications, and other potentially influential factors. Quality assessment tables are available in Supplemental 1.
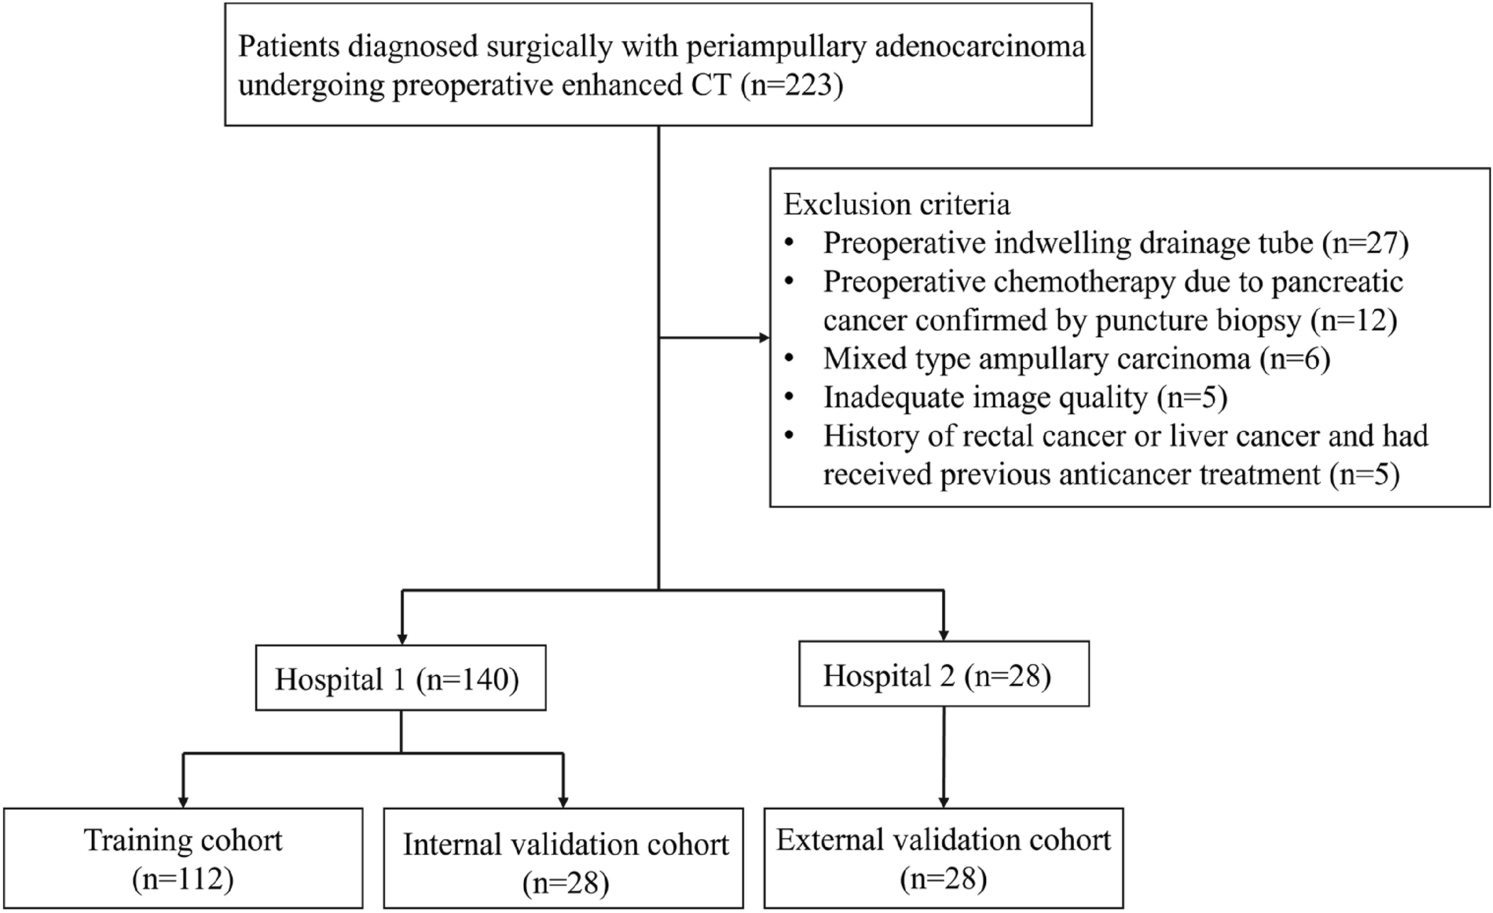
Patients’ selection in our experienceInitially, 33 cases of IPTL were retrospectively collected from the three aforementioned centers. Of these, 8 were excluded because a histopathological diagnosis was not available, 9 were further ruled out as not even an MR examination had been performed, but only US/CT evaluations, and 6 were excluded because the MR assessment was incomplete (lack of DWI and/or HBP), so 10 patients met the inclusion criteria (Fig. 2).
Epidemiological and clinical featuresIn the literature, epidemiological and clinical data were not always available (Table 2). Regarding mean age and sex, out of 91 patients with available data, 62 were male (68%) and 29 females (32%) with a mean age of 54 years (age range 2–82 years), prevalently Asians (91%). A total of 140 pathologically proven IPTLs were detected: single in 97 cases and multiple in 17 cases. The mean maximum diameter of the IPTLs was 33.8 mm (size range 8–200 mm). Symptoms were present in 54% of cases; 46% of the patients were completely asymptomatic with accidental detection. The most frequent symptom was upper abdominal quadrant pain (64%), followed by fever (51%), and the most frequent associated condition was chronic liver disease of various origins, found in 11 patients. IgG4-positive plasma cell infiltrate was present in 46% of patients in whom this evaluation was performed (41 patients, predominantly males with a solitary nodule; IgG4 serum levels not available).
Table 2 Epidemiological and clinical features of both literature and our casesIn our experience, we collected records from 10 patients with IPTL (4 males, 6 females; mean age 56 years, age range 38–77 years), all Caucasians. The diagnosis was based on histopathological findings (8 core biopsies, 2 liver resections). The detection of one or more IPTLs on imaging was accidental in 8 cases; in two cases, imaging was performed for patient symptoms (1 palpable abdominal mass, 1 fever and upper abdominal pain): 5 patients had associated conditions and the other 5 (50%) were free of any disease at the time of IPTL detection. In 3 patients (30%), hepatic steatosis was detected. Two out of 10 patients had IGg4-positive plasma cell infiltrate at pathology (males, with a solitary nodule); in these, also IgG4 serum levels were increased (> 135 mg/dL). A total of 16 IPTLs were detected: single in 8 cases and multiple in 2 cases (2 and 6 nodules). The mean maximum diameter of the IPTLs was 40 mm (size range 15–200 mm). Epidemiological and clinical features and literature comparisons are summarized in Table 2.
Lesions’ location and their relationship with bile and blood vesselsIn literature the segment site is known for 34 IPTLs for a total of 42 occupied segments, as reported (Table 3). The lobe site is known for 113 IPTLs, comprehensive of the latter 34 IPTLs with known segment site. Then, 46 (40.7%) and 67 (59.3%) IPTLs were found in the left and right lobe, respectively. Regarding possible relation with the bile ducts, we have found some information in 9 out of the selected 38 papers [7, 8, 10, 16, 21, 27, 32, 36, 41]. The IPTL determines prevalently biliary ectasia, but in two papers, a small ducts disruption adjacent to the mass [27] or lithiasis with signs of cholangitis is documented [36]. About potential damage of blood vessels determined by IPTL, data are really few, only 4 papers out of 38. The most relevant series is regarding “blood vessel penetration” of 14 out of 31 (45.2%) IPTLs [7]. Moreover, a displacement of inferior vena cava without invasion [24], a thrombosis of the right hepatic vein [29], and an occlusion of afferent portal branch [44] are reported. In our series, 16 IPTLs were detected, with a total of 22 occupied segments; 8 (38.1%) in the left and 14 (61.9%) in the right lobe (Table 3). Regarding the relationship with bile ducts and blood vessels, most of the IPTLs of our series do not cause alterations. A “blood vessel and biliary duct penetration”- a behavior we can better define as “insinuative” (both biliary and blood vessels) was detected in 2 of our cases.
Table 3 Localization of IPTLs in literature and our experiencePatterns of lesions SIAll possible imaging patterns found in the literature regarding T1/T2W images, CE-T1W images, HBP, and DWI (data available for 68, 113, 27 and 40 IPTLs, respectively), with the relative percentages of presentation, are summarized in Table 4 (bolded fonts). Great variability in T1/T2 SI on a per-lesion basis was observed, although multiple IPTLs in the same liver showed similar imaging features. Most of the lesions presented homogeneous T1 hypointensity (88%, 60/68 of IPTLs); homogeneous/inhomogeneous T2 hyperintensity (60%, 40/68) or T2 two-layered concentric “targetoid” appearance with hyperintense central core (31%, 21/68); a two- or three-layered concentric targetoid enhancement pattern visible at least in one phase of the dynamic study (51%, 57/113), mainly with a hypointense central core (42%, 47/113); and a two-layered targetoid pattern with a hyperintense peripheral rim on HBP (63%, 17/27) and homogeneous hyperintensity on high b-values (> 750 mm2/s) on DWI (82%, 33/40). A more detailed description is reported in Supplemental 2.
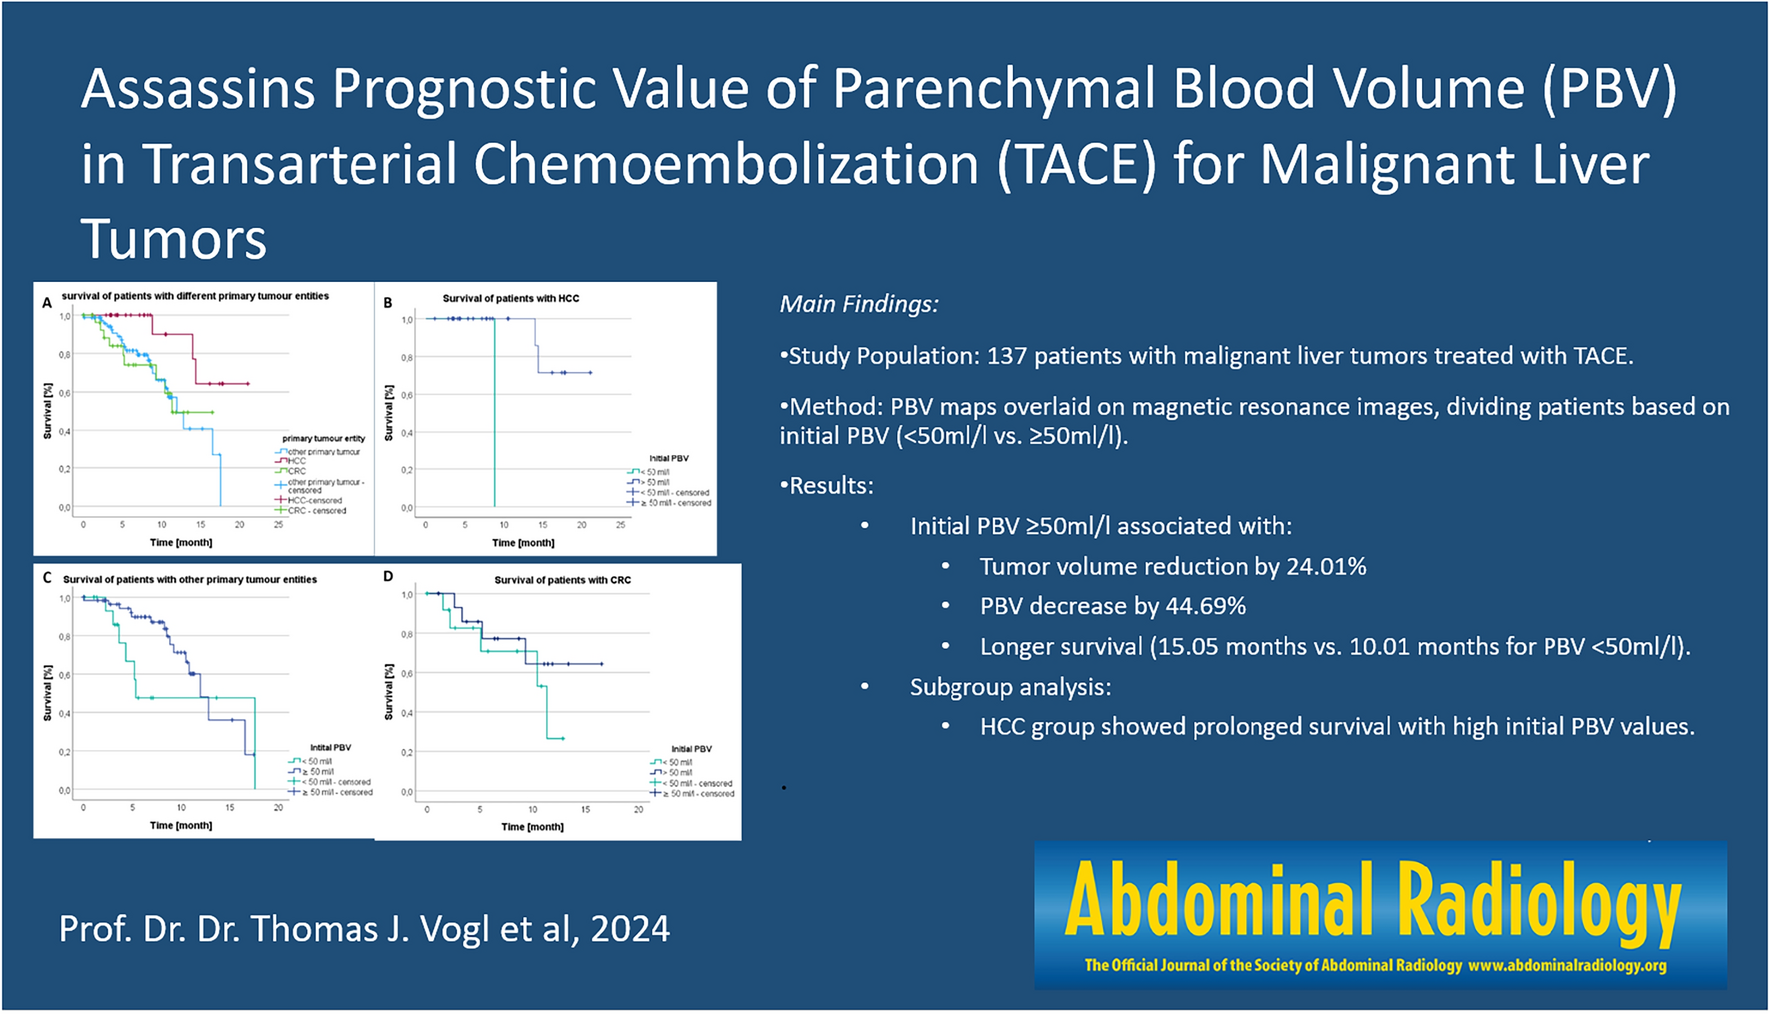
Table 4 Pattern of Magnetic Resonance featuresAll imaging patterns found in our experience and relative percentages of presentation are shown (Table 4—italics fonts). Even in our experience, great variability in T1/T2 SI on a per-lesion basis was observed, although multiple IPTLs in the same liver showed similar imaging features. Most of the lesions presented a two- or three-layered concentric “targetoid” appearance on T1W images (63%, 10/16 of IPTLs, with the hypointense central core); homogeneous/inhomogeneous T2 signal hyperintensity (56%, 9/16) or targetoid T2 appearance with a hyperintense central core (44%, 7/16); a two- or three-layered concentric target enhancement pattern at least in one phase of the dynamic study (81%, 13/16; this latter pattern associated in half of the cases with a T2 targetoid appearance); homogeneous signal hypointensity on HBP, and a two-layered targetoid appearance on DWI high b-values (> 750 mm2/s) with a core of low SI and a peripheral hyperintense halo in all cases (100%, 16/16) (Fig. 3). Targetoid appearance with peripheral hypointense halos and hyperintense cores was observed in 5 IPTLs on ADC maps; the other 11 IPTLs had ADC values always equivalent to or higher than those of the surrounding parenchyma. A more detailed description is reported in Supplemental 3.
Fig. 3
Inflammatory pseudotumor of the liver of the hepatic segment 7 in patient with history of breast cancer, 9 years ago. On MR, two-layered concentric “targetoid” appearance with the hypointense central core is seen on arterial phase (a) and gradient echo T1W out of phase (d). Target appearance is maintained on T2W images (e), with hyperintense central core, high b-value (750 mm2/s) DWI (g), and ADC map (h) with low and high central core signal intensity, respectively. On portal (b), equilibrium (c), and hepatobiliary phase (f), the lesion shows signal hypointensity. A transcutaneous biopsy was performed. Histological examination (i, hematoxylin–eosin, original magnification × 100) shows a mixture of spindle-shaped cells (myofibroblasts and fibroblasts) and inflammatory cells (predominantly plasma cells and lymphocytes with scattered neutrophils and eosinophils). The findings are indicative of inflammatory pseudotumor
Lesion SI follow-upIn the literature, we found documentation of at least one follow-up (maximum of 12 months) with MRI in 24 IPTLs, disappearing in 7 cases (29%, after steroid therapy, with ursodeoxycholic acid or unspecified) and persistent in the remaining 17 (71%). Persistent IPTLs tend to maintain the T1 SI of the first MR examination. Only three T1W homogenous hypointense IPTLs evolved in a T1W two-layered concentric targetoid appearance with a hypointense central core. On T2W images, there is a clear tendency to evolve in the homogeneous hypointense pattern, regardless of the starting hypo or hyper SI. On CE images, a double tendency is observed: either an evolution toward a hypovascular (homogenous hypointense) pattern or maintenance of the starting pattern. At the DWI follow-up (very few cases and always without ADC data), there was a tendency toward the loss of cellular crowding over time: two IPTLs evolved into homogeneous hypointense lesions and one evolved into a two-layered targetoid pattern with a hyperintense rim and hypointense core.
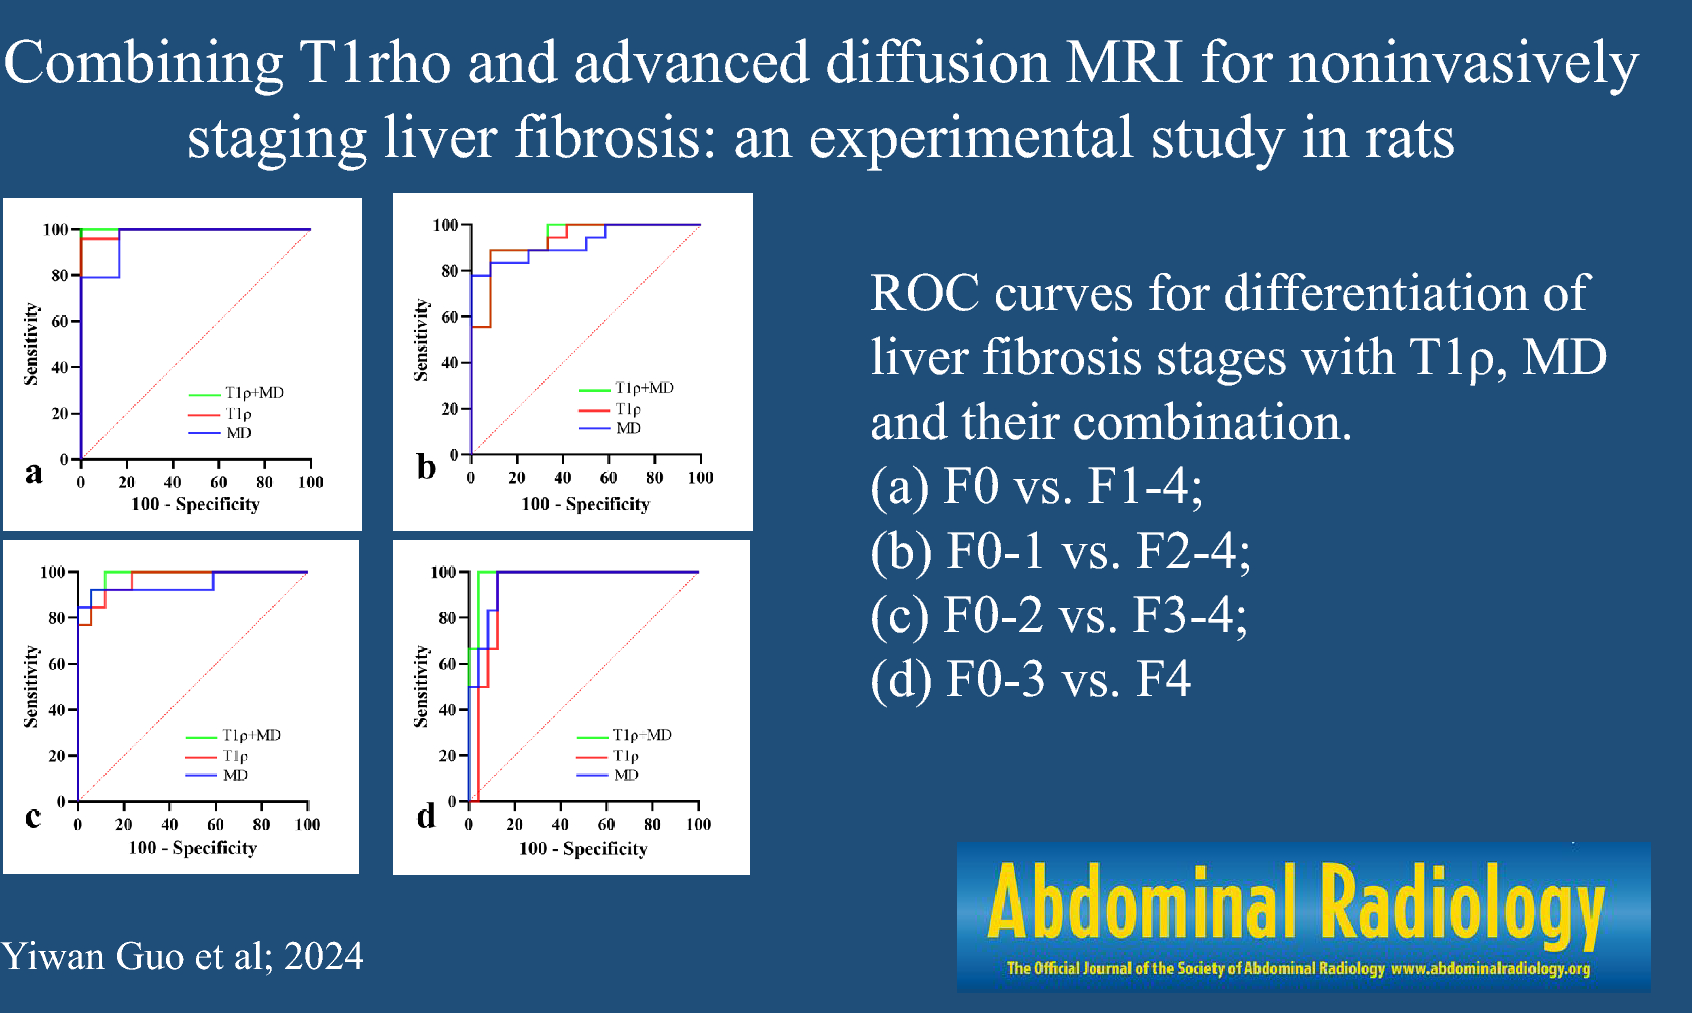
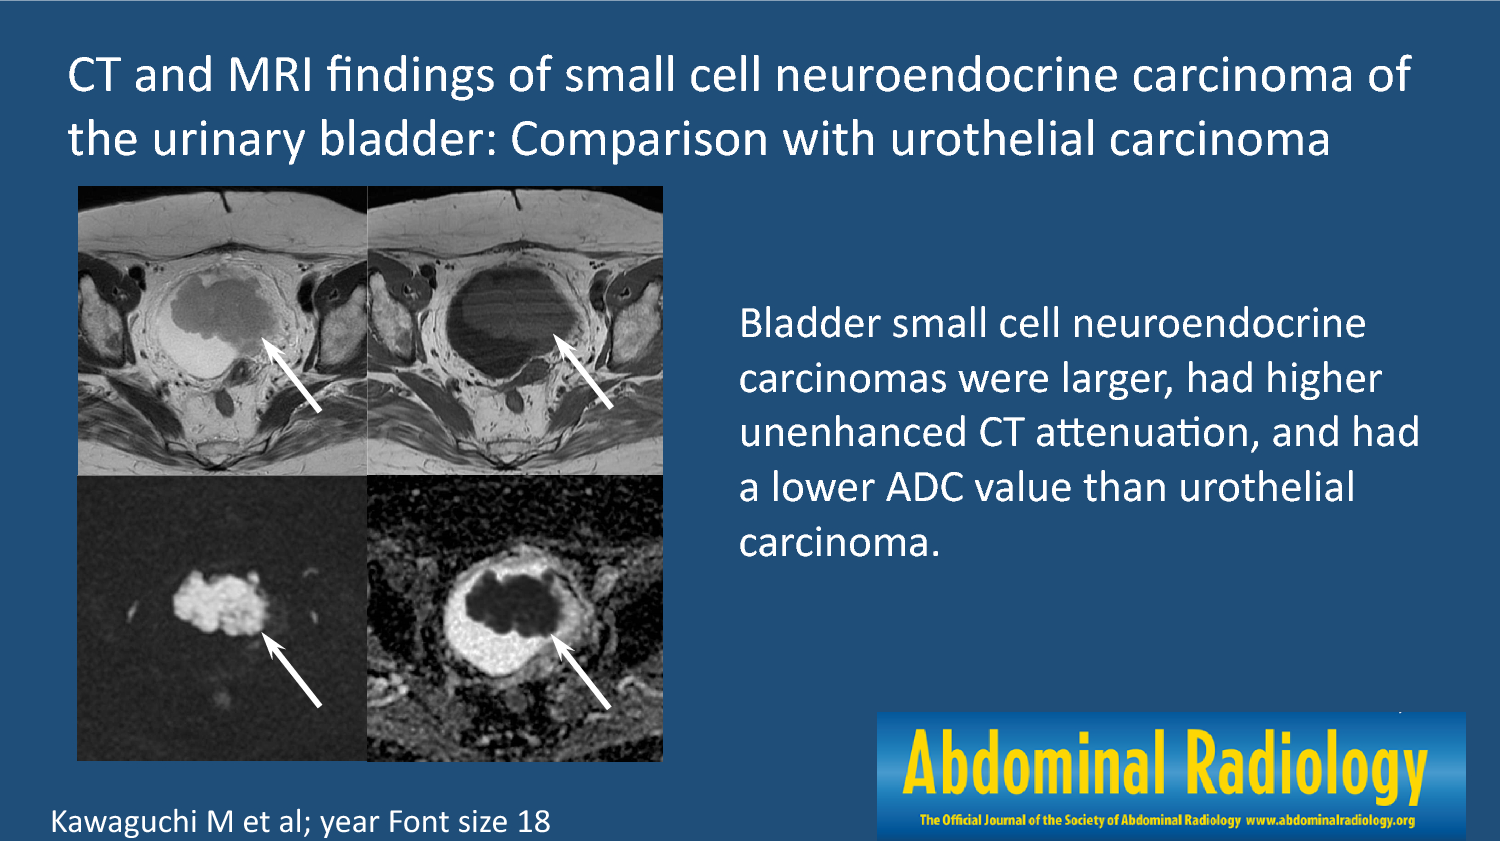
In our experience, 8 patients out of 10 with 8 IPTLs underwent at least 1 follow-up with MRI (between 3 and 12 months after baseline). Lesions were no longer detectable at the first follow-up MRI in 4 cases (each with a single nodule) or at the second follow-up MRI in 2 cases (each with a single nodule; between 6 and 36 months from the previous control), always after steroid therapy (Fig. 4). In the remaining 2 patients (8 lesions total; 6 lesions in one patient, two in the other), the persistence of lesions was documented in the two subsequent MRI follow-ups. On T1W images, persistent IPTLs maintained a “targetoid appearance” with a central hypointense core; only 1 lesion progressed from a “targetoid” with a hyper to hypointense core. On T2W images, persistent IPTLs always evolved into homogeneously hypointense lesions. In CE dynamic phases, persistent IPTLs evolved from “targetoid” enhancement into homogeneously hypointense and hypovascular lesions. On DWI, persistent IPTLs evolved into homogeneously hypointense lesions in all our cases, with a homogeneous low SI on the ADC map (Fig. 5).
Fig. 4
Rapid regression of incidental inflammatory pseudotumor of the liver (IPTL) in a 67-year-old Caucasian woman. MR was performed after US examination for fever and abdominal pain in March 2012, detecting a large hypoechoic lesion of the liver (not shown). MR confirmed the lesion with inhomogeneous signal hyperintensity on fat sat T2W (a) and high b-value DW (b) images, hypointensity on hepatobiliary phase (c). With the histological diagnosis of IPTL (mixed inflammatory infiltrate and spindle cells on needle biopsy whip), corticosteroid therapy was undertaken at the beginning of April 2012. This allowed a subtotal regression of the lesion as early as May 2012, as shown on T2W (d), DW (e), and hepatobiliary phase (f). On the same sequences (g–i), a complete regression is seen on MR follow-up in September 2013
Fig. 5
Histologically proven inflammatory pseudotumor of the liver (IPTL) in the left hepatic lobe during MR follow-up in patient with focal nodular hyperplasia (partially visible in front of IPTL). In 2017, at the onset, IPTL shows high hydration in T2W (a), high b-value DW (b) images, and in the ADC map (c). Progressive inhomogeneous enhancement at peripheral starting is shown in the portal (d) and equilibrium (e) phases. After 24 months, size reduction of the lesion, T2 (f) signal hypointensity, spin mobile lessening on DW images (g) and ADC map (h), and hypovascularization in the portal (i) and equilibrium (j) phases are observed. On histological examination the main cell population is macrophages, intermixed with other chronic inflammatory cells, like plasma cells and lymphocytes. Some scattered hepatocytes are sequestered in the inflammatory infiltrate. S100 and CD1a stains: negative. Endothelial markers: negative. The findings indicate as the more likely the diagnosis of inflammatory pseudotumor
留言 (0)