
記住我


Diabetes has become a big epidemic with 463 million adults affected globally in 2019 and the figure is projected to reach 700 million by 2045.1 Of note, China now is facing the world’s largest diabetes epidemic in that more than 12.8% of adults are estimated to have diabetes and more than 35.2% to have prediabetes in 2018.2 Diabetes, together with its related cardiometabolic risk profiles, imposed a huge burden on cardiovascular diseases, mortality, and health care expenditure.3, 4 Early identification and stratification for risk of developing diabetes was crucial for better management and prevention of diabetes and its related cardiometabolic disorders.
Diabetes is a disease with high heterogeneity in clinical presentation, disease progression, and etiopathogenesis, which makes it difficult to implement individualized treatment, achieve adequate glucose control, and predict prognosis in affected individuals. These issues might be attributed to the fact that diabetes diagnosis is oversimplified via the evaluation of plasma glucose solely.5 Adopting cluster analyses to refine the classification of diabetes beyond the simple use of plasma glucose is a powerful tool to detect diabetes subphenotypes with specific patterns of complications.5 Using demographic and clinical variables, several recent studies successfully provided a refined classification of diabetes, which aids in characterizing and exploiting diabetes heterogeneity, identifying risk of complications at diagnosis, and optimizing precision medicine according to subphenotypes of diabetes.6-11 Indeed, metabolic abnormalities characterizing prediabetes already exist 6 years before diabetes onset.12 The macrovascular and microvascular complications of diabetes also need preventive care before diabetes onset. However, studies on risk evaluation and stratification of developing diabetes in the nondiabetes East Asian population are sparse.13
A very recent study adopted fat composition, insulin secretion, insulin sensitivity, and genetic risk to classify individuals at elevated risk for diabetes. They identified six distinctive subphenotypes with different metabolic risk. The study indicated adopting multivariables to recapitulate subphenotypes for individuals at elevated risk for diabetes would aid in disentangling metabolic heterogeneity, assessing diabetes and complication risks, and benefiting precision medicine.13
Serum electrolytes, including iron, chlorine, magnesium, sodium, potassium, calcium, and phosphorus, are important cofactors for multiple enzymes and play a pivotal role in many key biological and physiological processes, including glucose metabolism.14-16 The excess or deficiency of these electrolytes was found to be linked to deleterious metabolism status.14 Many studies have reported single serum electrolyte level, such as magnesium, calcium, and ferritin, was associated with risk of type 2 diabetes and related metabolic abnormalities.17-20 The Rotterdam study with a median follow-up of 6.7 years17 reported that each 0.1 mmol/L decrease in serum magnesium was associated with 1.12-fold greater prediabetes risk and 1.18-fold greater diabetes risk. In another two prospective cohorts,18, 20 researchers reported that a high level of baseline serum calcium was associated with an increased risk of developing type 2 diabetes. It indicated that serum electrolytes were a feasible clinical index used for predicting diabetes and prediabetes. However, few studies have systematically and comprehensively assessed the effects of serum electrolytes distribution pattern rather than specific concentration of serum electrolytes on the risk of incident diabetes.
Our study aimed to, first, create clusters in individuals who were nondiabetic at baseline based on seven systematically measured and clinical-conveniently available serum electrolytes by using cluster analysis; and second, evaluate the associations of these clusters with risk of developing diabetes and longitudinal change patterns of metabolic traits in an average 4.4 years follow-up Chinese adults. The current study will provide a refined classification of nondiabetes into different stratifications of developing type 2 diabetes and progression of metabolic traits.
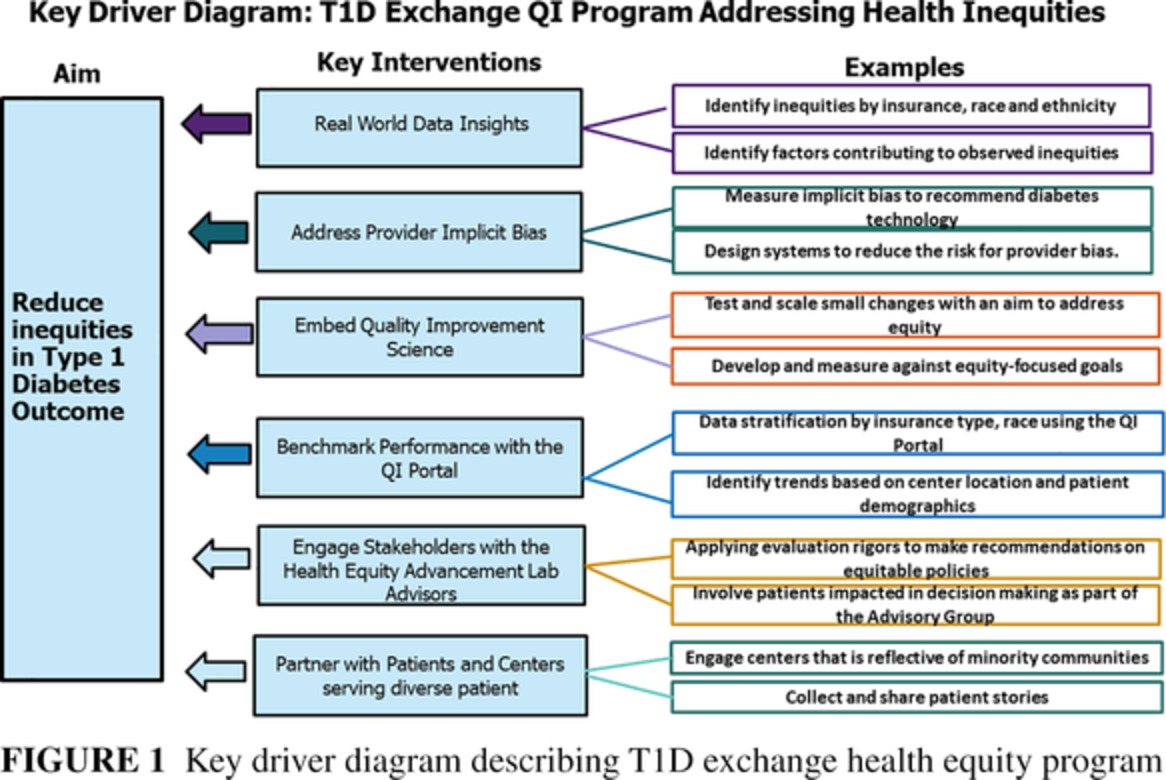
2 METHODS 2.1 Study populationThe prospective study is a community-based survey on type 2 diabetes and related cardiometabolic diseases conducted in Jiading district, Shanghai, China.21, 22 In phase I (March–August 2010), 10 375 of 10 569 registered permanent residents aged 40 years or older underwent the baseline examination. Individuals with cardiovascular diseases (n = 306) or type 2 diabetes (n = 1755) or missing data on serum electrolytes, type 2 diabetes, or cardiovascular diseases (n = 329) at baseline were excluded. In phase II (August 2014-May 2015), 7965 nondiabetes individuals were enrolled to complete a follow-up survey. Of these, 153 individuals died during follow-up period, and 2788 individuals failed to attend the onsite follow-up visit. Seventy eight individuals were missing data on diabetes status at follow-up visit, and four individuals with extreme outliers (>2 SD from the mean of serum phosphorus level) were excluded. Finally, 4937 nondiabetes individuals were included in the current analysis. The detailed selection process of study participants is shown in Figure 1.

Flow chart of the present study
The study protocol was approved by the Committee on Human Research at Ruijin Hospital affiliated with Shanghai Jiao Tong University School of Medicine. All participants provided written informed consent.
2.2 Biochemical measurementsBlood samples were collected at phase I and II after ≥10 h overnight fasting. Each individual underwent a simplified 75 g oral glucose tolerance test (OGTT). Plasma glucose (0 and 2 h) and serum insulin (0 and 2 h) was determined using glucose oxidize method (Modular P800; Roche, Basel, Switzerland) and chemiluminescence method (Modular E170; Roche, Basel, Switzerland), respectively. Serum electrolytes (iron, chlorine, magnesium, sodium, potassium, calcium, and phosphorus) were determined using chemiluminescence method (Modular E170; Roche, Basel, Switzerland). Glycated hemoglobin A1c (HbA1c) and serum creatinine were determined using high-performance liquid chromatography (VARIANT II Hemoglobin Testing System, Bio-Rad Laboratories) and picric acid method (clinical chemistry diagnostic system C16 000, Abbott Laboratories, Otawara-shi, Japan), respectively. Serum apolipoprotein A (APOA), apolipoprotein B (APOB), low-density lipoprotein cholesterol (LDL-C), high-density lipoprotein cholesterol (HDL-C), triglycerides (TG), total cholesterol (TC), aspartate aminotransferase (AST), γ- glutamyl transpeptidase (GGT), and alanine aminotransferase (ALT) were determined using chemiluminescence method (Modular E170; Roche, Basel, Switzerland).
2.3 Ascertainment of incident diabetesIncident diabetes cases were defined as (a) fasting plasma glucose ≥7.0 mmol/L; (b) 2 h-OGTT plasma glucose ≥11.1 mmol/L; (c) individuals were receiving antidiabetic medications; and (d) self-reported diagnosed diabetes. The homeostasis model assessment of insulin resistance (HOMA-IR) was calculated using the formula fasting plasma glucose (mmol/L) × serum fasting insulin (mIU/L) /22.5. The homeostasis model assessment of function of β cells (HOMA-β) was calculated using the formula: 20 × fasting serum insulin (mIU/L)/[fasting plasma glucose (mmol/L)-3.5].
2.4 CovariatesInformation about demographics, lifestyles, diseases history, and medication use were collected through a standard questionnaire. Individuals who consumed alcohol or smoked cigarettes regularly in the past 6 months were regarded as current drinking or smoking. Physical activity was evaluated using International Physical Activity Questionnaire23 and divided into three levels on the basis of metabolic equivalent (MET): vigorous (≥3000 MET-min/week), moderate (600–2999 MET-min/week), and mild (≤599 MET-min/week).24, 25
Body weight, height, diastolic blood pressure (DBP), systolic blood pressure (SBP), fat-free mass, and fat mass were measured using a standard protocol. Three seated SBP and DBP at nondominant arm were measured consecutively with 1 min intervals after 10 min of rest (OMRON Model HEM-752 FUZZY, Omron Company, Dalian, China). These three measurements were averaged for analysis. Fat-free mass and fat mass were evaluated on a body composition analyzer (Tanita TBF-300, Japan) by bioelectrical impedance analysis.
2.5 Cluster analysisBaseline fasting serum iron, chlorine, magnesium, sodium, potassium, calcium, and phosphorus were selected as model variables for cluster analysis. Cluster analysis was done on values centered to an SD of 1 and a mean value of 0. In the TwoStep clustering, we first calculated the optimal clustering value using the elbow method (R version 4.0.3) and then dose K-means clustering (k = 3) using the k-means runs function (runs = 100).
2.6 Statistical analysisBaseline characteristics were described according to the three clusters. Continuous variables were presented as mean ± SD or medians (interquartile range), whereas categorical variables were presented as numbers (percentage). The multiple comparisons of baseline characteristics among clusters were conducted by Student-Newman-Keuls (SNK) test.
Logistic regression analysis was performed to determine the risk of developing diabetes in relation to clusters. Risk estimates were described as odds ratios (OR) and 95% confidence intervals (CIs). Model 1, adjusted for sex, age (years), body mass index (BMI) (kg/m2), family history of diabetes (yes or no); Model 2, further adjusted for current smoking (yes or no), current drinking (yes or no), physical activity (mild, moderate, or vigorous), education level (≥9 years of education or not); Model 3, further adjusted for systolic blood pressure (mmHg), diastolic blood pressure (mmHg), fasting plasma glucose (mmol/L), 2 h-OGTT plasma glucose (mmol/L), serum creatinine (umol/L), TC (mmol/L), TG (mmol/L), HDL-C (mmol/L), LCL-C (mmol/L), and use of diuresis (yes or no) based on model 2. To assess the added value of serum electrolytes clusters, we included these clusters in the models of predicting diabetes. We calculated the difference (C statistic) without or with clusters, integrated discrimination improvement (IDI), and net reclassification improvement (NRI).
All statistical analyses were conducted using SAS (version 9.4, SAS Institute, Cary, NC). A two-tailed p value < 0.05 was considered as statistical significance.
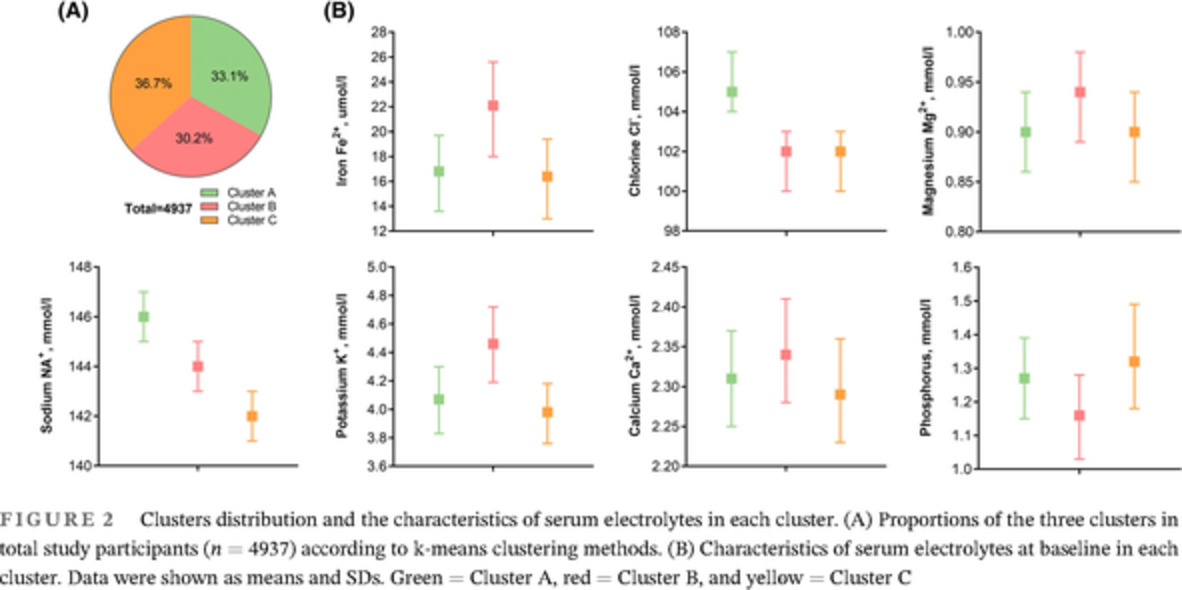
3 RESULTS 3.1 Baseline characteristicsA total of 4937 nondiabetes individuals were included in the current analysis, with an average age of 57.3 ± 8.6 years, 1721 (35%) men, and 3216 (65%) women. We used the k-means clustering method to classify individuals into three different clusters based on the seven serum electrolytes, with the minimum sum of the squared errors. The baseline characteristics according to the three clusters were shown in Figures 2, 3 and Table 1. Cluster A, including 1635 (33.1%) individuals, was characterized as elder age, more women, with higher level of serum chloride, fasting and 2 h-OGTT serum insulin and HOMA-β, and lower level of TG, Cluster B, including 1490 (30.2%) individuals, had higher level of serum iron, magnesium, potassium, and calcium, BMI, DBP, fasting plasma glucose, TC, HDL-C, LDL-C, and liver enzymes (ALT, AST, and GGT), fat mass, and fat-free mass, but lower level of fasting and 2 h-OGTT serum insulin, HOMA-IR, and HOMA-β. Cluster C, including 1812 (36.7%) individuals, had higher level of serum phosphorus and HbA1c, younger age, lower level of BMI, SBP, serum creatinine and AST, and moderate level of fasting and OGTT-2 h serum insulin, HOMA-β, fat-free mass, and fat mass.

Clusters distribution and the characteristics of serum electrolytes in each cluster. (A) Proportions of the three clusters in total study participants (n = 4937) according to k-means clustering methods. (B) Characteristics of serum electrolytes at baseline in each cluster. Data were shown as means and SDs. Green = Cluster A, red = Cluster B, and yellow = Cluster C

The patterns of a wide range of baseline metabolic characteristics of the participants according to the three clusters. The right bar with color gradient was presented the range of mean values of each metabolic trait. Abbreviations: APOA, apolipoprotein A; APOB, apolipoprotein B; ALT, alanine aminotransferase; AST, aspartate aminotransferase; BMI, body mass index; GGT, γ- glutamyl transpeptidase; HbA1c, glycated hemoglobin A1c; HDL-C, high density lipoprotein cholesterol; HOMA-IR, homeostasis model assessment of insulin resistance; HOMA-β, homeostasis model assessment of β cells; LDL-C, low density lipoprotein cholesterol; OGTT, oral glucose tolerance test; TC, total cholesterol
TABLE 1. Baseline characteristics of study participants according to the three clusters Cluster A Cluster B Cluster C p value SNK test n 1635 1490 1812 Age, years 58.5 ± 8.83 57.1 ± 8.35 56.3 ± 8.57 <0.0001 A, B, C Women, n (%) 1222 (74.7) 697 (46.8) 1297 (71.6) <0.0001 A, C, B Body mass index, kg/m2 24.9 ± 3.23 25.3 ± 3.00 24.6 ± 3.15 <0.0001 B, A, C Systolic blood pressure, mmHg 140 ± 20.2 141 ± 18.6 138 ± 19.4 <0.0001 (B, A), C Diastolic blood pressure, mmHg 82.3 ± 10.4 84.6 ± 10.0 82.0 ± 10.2 <0.0001 B, (A, C) Current smoking, n (%) 220 (14.0) 454 (31.0) 266 (15.4) <0.0001 B, (C, A) Current drinking, n (%) 108 (22.8) 226 (15.4) 140 (8.05) <0.0001 A, B, C Physical activity, MET-h/wk 21.0 (0–38.5) 15.0 (0–35.0) 15.0 (0–33.6) 0.20 / ≥9 years of education, n (%) 309 (18.9) 284 (19.1) 410 (22.6) 0.009 C, (A, B) Family history of diabetes, n (%) 126 (7.72) 122 (8.20) 204 (11.3) 0.0004 C, (A, B) Use of diuresis, n (%) 20 (1.22) 24 (1.61) 43 (2.37) 0.03 C, (A, B) Biochemical measurements Fasting plasma glucose, mmol/L 5.06 ± 0.54 5.17 ± 0.59 5.08 ± 0.56 <0.0001 B, (C, A) 2 h-OGTT plasma glucose, mmol/L 6.66 ± 1.70 6.58 ± 1.81 6.66 ± 1.69 0.32 / Fasting serum insulin, mIU/L 6.80 (5.00–9.40) 6.28 (4.10–9.00) 6.70 (4.65–9.35) <0.0001 A, C, B 2 h-OGTT serum insulin, mIU/L 46.2 (26.8–66.5) 39.6 (22.9–63.1) 42.5 (25.6–67.4) <0.0001 A, C, B HOMA-IR 1.53 (1.09–2.14) 1.43 (0.92–2.13) 1.49 (1.02–2.17) 0.02 (A, C), B HOMA-β 91.1 (65.7–132) 77.9 (50.0–116) 88.9 (61.3–131) <0.0001 A, C, B Serum creatinine, umol/L 60.5 ± 13.2 64.6 ± 13.2 58.9 ± 11.9 <0.0001 B, A, C Total cholesterol, mmol/L 5.26 ± 0.96 5.46 ± 0.95 5.30 ± 1.05 <0.0001 B, (C, A) Triglycerides, mmol/L 1.28 (0.92–1.78) 1.35 (0.99–1.90) 1.35 (0.95–1.91) 0.0001 (C, B), A High-density lipoprotein cholesterol, mmol/L 1.34 ± 0.31 1.37 ± 0.32 1.32 ± 0.32 <0.0001 B, (A, C) Low-density lipoprotein cholesterol, mmol/L 3.17 ± 0.85 3.26 ± 0.81 3.15 ± 0.86 0.0005 B, (A, C) Serum electrolytes Iron, umol/L 16.8 ± 4.85 22.1 ± 5.62 16.4 ± 4.99 <0.0001 B, A, C Chlorine, mmol/L 105 ± 2.07 102 ± 2.13 102 ± 2.14 <0.0001 A, (B, C) Magnesium, mmol/L 0.90 ± 0.07 0.94 ± 0.07 0.90 ± 0.07 <0.0001 B, (A, C) Sodium, mmol/L 146 ± 1.41 144 ± 1.64 142 ± 1.46 <0.0001 A, B, C Potassium, mmol/L 4.07 ± 0.35 4.46 ± 0.39 3.98 ± 0.32 <0.0001 B, A, C Calcium, mmol/L 2.31 ± 0.10 2.34 ± 0.10 2.29 ± 0.10 <0.0001 B, A, C Phosphorus, mmol/L 1.27 ± 0.18 1.16 ± 0.18 1.32 ± 0.19 <0.0001 C, A, B Data are presented as means ± SD (SD), or medians (interquartile ranges) for skewed variables, or number (percentage) for categorical variables. Multiple comparisons were performed by Student-Newman-Keuls (SNK) test. Abbreviations: HOMA-IR, homeostasis model assessment of insulin resistance; HOMA-β, homeostasis model assessment of β cells; OGTT, oral glucose tolerance test; SNK test, Student-Newman-Keuls test. A, B, and C represent cluster A, cluster B, and cluster C, respectively. Letters within brackets indicate means in different clusters are not significantly different. 3.2 Associations of clusters by serum electrolytes with risk of incident diabetesA total of 601 incident diabetes cases were identified over an average of follow-up of 4.4 years, including 163 (10.0%) in Cluster A, 217 (14.6%) in Cluster B, and 221 (12.2%) in Cluster C.
Compared with Cluster A, Clusters B and C were associated with a higher risk of incident diabetes (Table 2). Cluster B was associated with 1.56-fold (95% CI 1.25-1.96, p = 0.0001) and Cluster C 1.37-fold (95% CI 1.10-1.70, p = 0.005) higher risk of incident diabetes, respectively, after adjustments for age, sex, BMI, and family history of diabetes (model 1). Further adjustments for the demographic and lifestyle factors, SBP, DBP, fasting, and 2 h-OGTT plasm glucose, serum creatinine, HDL-C, TG, TC, and LDL-C, and use of diuresis (model 3), the results did not appreciably change, the ORs for Cluster B and C were 1.41 (95% CI 1.09-1.82, p = 0.01) and 1.33 (95% CI 1.03-1.71, p = 0.03), respectively. However, there was no significant difference between the association of the risk of incident diabetes with Cluster B and C (p > 0.05).
TABLE 2. Risk of incident diabetes in relation to Cluster B and C, as compared with Cluster A Cluster A Cluster B Cluster C OR (95% CI) p value OR (95% CI) p value n, cases/participants 163/1635 217/1490 221/1812 Model 1 Ref. 1.56 (1.25–1.96) 0.0001 1.37 (1.10–1.70) 0.005 Model 2 Ref. 1.57 (1.25–1.98) 0.0001 1.36 (1.09–1.70) 0.007 Model 3 Ref. 1.41 (1.09–1.82) 0.01 1.33 (1.03–1.71) 0.03 Data are presented as odds ratio (ORs) and 95% confidence interval (CI). Model 1, adjusted for sex, age (years), body mass index (kg/m2), family history of diabetes (yes or no); Model 2, further adjusted for current smoking (yes or no), current drinking (yes or no), physical activity (mild, moderate or vigorous), education level (≥9 years of education or not); Model 3, further adjusted for systolic blood pressure (mmHg), diastolic blood pressure (mmHg), fasting plasma glucose (mmol/L), 2 h-OGTT plasma glucose (mmol/L), serum creatinine (mmol/L), total cholesterol (mmol/L), triglycerides (mmol/L), high-density lipoprotein cholesterol (mmol/L), low-density lipoprotein cholesterol (mmol/L), and use of diuresis (yes or no) based on model 2. 3.3 Progression of glucose and lipid metabolic traits over 4.4 yearsThe changes in major glucose and lipid metabolic traits over 4.4 years by clusters were shown in Figure 4. All the three clusters showed an obvious decreased level of SBP, DBP, and HOMA_β, the increased level of fasting and 2 h-OGTT plasma glucose, fasting, and 2 h-OGTT serum insulin, and HOMA_IR. In Cluster A, the glucose and lipid metabolic traits were characterized by a moderate and stable BMI and increased level of serum HDL-C. Cluster B showed a sharply increased level of 2 h-OGTT plasma glucose, a slightly decreased level of serum HDL-C. Cluster C was shown as in between Cluster B and A, except the most sharply increased level of serum LDL-C.

Progression of glucose and lipid metabolic traits over 4.4 years according to the three clusters. The lines show the change trends of the glucose and lipid metabolic traits from baseline to the 4.4 years of follow-up. Green = Cluster A, red = Cluster B, and yellow = Cluster C. The glucose and lipid metabolic traits included BMI (A), systolic blood pressure (B), diastolic blood pressure (C), fasting plasma glucose (D), 2 h-OGTT plasma glucose (E), fasting serum insulin (F), 2 h-OGTT serum insulin (G), HOMA-IR (H), HOMA-β (I), triglycerides (J), high-density lipoprotein cholesterol (K), and low-density lipoprotein cholesterol (L). Abbreviations: BMI, body mass index; HDL cholesterol, high density lipoprotein cholesterol; HOMA-IR, homeostasis model assessment of insulin resistance; HOMA-β, homeostasis model assessment of β cells; LDL cholesterol, low density lipoprotein cholesterol; OGTT, oral glucose tolerance test
3.4 Association of selected serum electrolyte with risk of incident diabetesWe evaluated the associations of each of the seven serum electrolytes with risk of incident diabetes (Table 3). Each 1-SD increase in serum chlorine (2.8 mmol/L) was associated with 12% lower risk of incident diabetes (OR = 0.88, 95% CI 0.80-0.97, p = 0.01) risk of incident diabetes. The corresponding results for serum magnesium (0.07 mmol/L) was 13% (OR = 0.87, 95% CI 0.80-0.96, p = 0.005), serum potassium (0.4 mmol/L) was 12% (OR = 0.88, 95% CI 0.81-0.97, p = 0.009), and serum solidum (2.0 mmol/L) was 11% (OR = 0.89, 95% CI 0.81-0.98, p = 0.01). Each 1-SD increase in serum iron (5.7 umol/L) was associated with 1.26-fold (95% CI 1.14-1.39, p < 0.0001) increased risk of incident diabetes. No significant association were found for calcium (0.1 mmol/L) and serum phosphorus (0.2 mmol/L) (both p ≥ 0.35). The categorical analysis showed similar results (all p for trend ≤ 0.04, except for potassium, calcium, and phosphorus).
TABLE 3. Risk of incident diabetes in relation to selected dominant serum electrolytes in each cluster Each 1-SD increase Tertile 1 Tertile 2 Tertile 3 1-SD OR (95% CI) p value OR (95% CI) OR (95% CI) p for trend Serum chlorine Unit, mmol/L 2.8 94–101 102–104 105–113 n, cases/participants 603/4941 246/1507 236/2040 121/1304 Model 1 0.75 (0.69–0.82) <0.0001 Ref 0.69 (0.57–0.84) 0.47 (0.37–0.60) <0.0001 Model 2 0.88 (0.80–0.97) 0.01 Ref 0.81 (0.65–1.00) 0.64 (0.50–0.83) 0.0007 Serum iron Unit, umol/L 5.7 3.6–15.5 15.6–20.1 32.7–54.5 n, cases/participants 603/4941 173/1653 186/1631 244/1657 Model 1 1.18 (1.07–1.29) 0.0006 Ref 0.99 (0.79–1.23) 1.38 (1.11–1.73) 0.003 Model 2 1.26 (1.14–1.39) <0.0001 Ref 1.05 (0.82–1.34) 1.60 (1.25–2.05) 0.0001 Serum magnesium Unit, mmol/L 0.07 0.63–0.87 0.88–0.93 0.94–1.56 n, cases/participants 603/4941 196/1523 195/1730 212/1688 Model 1 0.96 (0.88–1.04) 0.29 Ref 0.84 (0.68–1.05) 0.93 (0.75–1.15) 0.50 Model 2 0.87 (0.80–0.96) 0.005 Ref 0.83 (0.65-1.05) 0.78 (0.62-0.99) 0.04 Serum potassium Unit, mmol/L 0.4 2.85–3.96 3.97–4.30 4.31–6.03 n, cases/participants
留言 (0)