
記住我


The COVID-19 pandemic is an ongoing public health crisis, with over 245 373 039 confirmed cases globally, including 4 979 421 deaths as of 29 October 2021 (according to the World Health Organization [WHO]).1 Factors associated with poor outcomes, including in-hospital morbidity and mortality, in COVID-19 hospitalized patients are of considerable interest.2 More specifically, health comorbidities may predispose patients to an increased risk of poor outcomes following COVID-19 infection.2-4 Previous studies have indicated a relatively higher prevalence of diabetes in COVID-19 patients compared to those without diabetes.5 Moreover, previous meta-analyses have indicated that diabetes is associated with increased risk of severe COVID-19, acute respiratory distress syndrome (ARDS), and in-hospital mortality.6-11 However, several of these studies included patients under 18 years of age or from the community setting.
It is of clinical and public health interest to understand how diabetes mediates outcomes in COVID-19 hospitalized patients. The current study sought to determine in-hospital prevalence of diabetes in COVID-19 patients and investigate the association of diabetes with COVID-19 severity, ARDS rate, mortality, and the need for mechanical ventilation in hospitalized COVID-19 adult patients by performing a systematic review and meta-analysis.
With this study, we wanted to investigate the following questions: What is the pooled prevalence of diabetes in hospitalized COVID-19 patients drawn from the meta-analysis? Is diabetes associated with COVID-19 severity, increased rate of ARDS, need for mechanical ventilation, and in-hospital mortality? 2 METHODS 2.1 Literature search: Identification and selection of studiesRelevant articles were retrieved from the following databases until July 2021: PubMed, Embase, and Cochrane Central Register of Controlled Trials. The search terms used included diabetes or diabetic or t1dm or t2dm or diabetes mellitus and covid-19 or covid or coronavirus or severe acute respiratory syndrome coronavirus 2 or SARS-CoV-2. Nonhuman studies and articles not written in English were excluded by applying filters. The detailed search strategy is provided in the Supplementary Information. The Preferred Reporting Items for Systematic Reviews and Meta-analysis (PRISMA) flowchart was used to present the search strategy and studies included in the meta-analysis (Figure 1). The PRISMA 2020 (Supplemental Table S6), Meta-analysis of Observational Studies in Epidemiology (MOOSE) (Supplemental Table S5), and Standards for Reporting of Diagnostic Accuracy Studies (STARD 2015) checklists (Supplemental Table S7) were also adhered to for reporting.

The PRISMA flowchart showing the studies included in the meta-analysis. ARDS, acute respiratory distress syndrome; n, cohort size; N, number of studies
2.2 Inclusion and exclusion criteriaFor studies to be included, the following inclusion criteria were applied: (a) age ≥ 18 years, (b) availability of comparative data between diabetes and non-diabetes groups, (c) patients with a confirmed diagnosis of COVID-19 in a hospital setting, and (d) studies with good methodological design (with appropriate sample size deemed to be >20 patients in each group). Besides, the following criteria were applied to exclude studies: (a) nonhuman/animal studies; (b) duplicated publications; (c) nonavailability of full-text articles; (d) case reports, case series, letters, systematic reviews, and meta-analyses; and (e) studies provided in abstract form that did not have relevant data on diabetes or relevant clinical outcomes were not reported.
2.3 Data extractionThe title and abstracts were reviewed on Endnote (X9.3.3; Clarivate) first to rule out that the articles did not meet the eligibility criteria. The remaining articles were examined thoroughly to determine whether they should be included in the systematic review or meta-analysis according to the eligibility criteria. Reference lists of articles included were also reviewed for possible inclusion. The screening was conducted independently by two authors experienced in meta-analysis. Any disagreements were discussed, and final decisions were reached by consensus. The data from each study/trial were extracted independently using a data extraction sheet to obtain the following information: (a) baseline demographics (author, country, and year of publication), (b) study population (age of patients, sample size, characteristics of COVID-19 patients, and presence or absence of diabetes), and (c) outcome measures (severity of COVID-19, in-hospital ARDS, mortality, and need for mechanical ventilation). The outcome measures were tabulated for the diabetes and non-diabetes groups. The definition of severe disease differed between studies, with the presence of respiratory distress or admission to the intensive care unit as common criteria. We dichotomized severity groups into severe and non-severe. Where studies had separate groups for severe and critical cases, these two groups were combined for the purpose of this meta-analysis. ARDS was defined according to the Berlin definition in two studies and undefined in two other studies.12 Mortality was defined as in-hospital death within the study period for all studies. Mechanical ventilation was defined as invasive mechanical ventilation in five studies, intubation in two studies, and ventilation in one study.
2.4 Quality assessment of included studiesThe modified Jadad analysis scale was independently used by two researchers to assess the methodological quality of each study.13 The bias due to funding was also evaluated, independent of the quality assessment, based on the declaration of funding sources and conflicts of interest.14
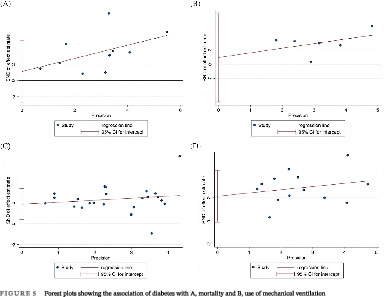
2.5 Statistical analysisAll statistical analyses were performed using STATA (Version 13.0, StataCorp LLC, College Station, Texas). The baseline characteristics of patient populations were synthesized from all included studies. The crude prevalence of diabetes within the overall cohort was determined. Where applicable, median, and interquartile ranges were converted to mean and SD using the method described by Wan et al15 In this study, the association of diabetes with severity of COVID-19, odds of ARDS, mortality, and need for mechanical ventilation was investigated by performing the DerSimonian-Laird random-effects meta-analysis. Summary effects and heterogeneity obtained from the meta-analysis were tabulated. Forest plots were generated to present the odds ratios (OR) (effects measure), 95% CI, percentage weight, and the heterogeneity between studies included in the meta-analysis. When applicable, tests of overall effect, vis a vis P value, and Z-test were also reported. Egger's tests of effect sizes corresponding to each clinical outcome were performed (Figure 2 and Supplemental Table S3). To assess the heterogeneity between the studies, I2 statistics and P values were used (<40% = low, 30%-60% = moderate, 50%-90% = substantial, and 75%-100% = considerable).16 Other heterogeneity parameters including Cochran's Q, H-Test (relative excess in Cochran's Q over its degrees of freedom), and tau (for heterogeneity variance estimates) were also analyzed. The regression-based Egger's test for small-study effects was also used to evaluate funnel plot asymmetry quantitatively (Figure 5). The effects of an individual study on the overall meta-analysis were also evaluated, for stability and sensitivity, using STATA's “metaninf” package (Supplemental Figure S1). Effect size analyses for the association of diabetes with severity, ARDS, mortality and mechanical ventilation are shown in Supplemental Figure S2. A Begg's funnel plot was used to visually detect the presence of publication bias, identified by the presence of asymmetry on the funnel plot (Supplemental Figure S3). P values <.05 indicated statistically significant association.

Forest plot showing the association of diabetes with A, severe COVID-19 and B, acute respiratory distress syndrome
For estimating prevalence, the “metaprop” STATA command was used to pool proportions by performing a DerSimonian-Laird random-effects meta-analysis of proportions obtained from the individual studies.17 To stabilize the variances, Freeman-Tukey double arcsine transformation was also applied to stabilize the variances in order to calculate the pooled estimates. For prevalence meta-analysis, the heterogeneity was estimated from the inverse-variance fixed-effect model as well as by using the I2 measure. Forest plots were created to report the overall estimates of the meta-analysis.
3 RESULTS 3.1 Description of included studiesThere were 24 included studies, with a total cohort of 10 648 patients, of whom 3112 had diabetes (29.23%). The mean age ± SD of all included studies was 49.87 ± 32.32 years, and there were 5953 males overall (55.91%). COVID-19 diagnosis was defined as a positive reverse transcription polymerase chain reaction (RT-PCR) test in 21 studies; as history, fever or respiratory symptoms, CT imaging abnormalities, and a positive RT-PCR in 1 study; and was not defined in 2 studies. Three studies specifically investigated type 2 diabetes only, with the remainder not distinguishing between type 1 and 2. Data on diabetes severity or duration were not provided in any studies. Although the overall crude prevalence rate of diabetes was 29.23%, our meta-analysis demonstrated that the overall pooled estimated prevalence rate was 31% (95% CI, 0.25-0.38; z = 16.09, P < .0001). A forest plot showing the prevalence of diabetes in COVID-19 hospitalized patients is included in Figure 3. Supplemental Table S4 shows the full results of the random-effects meta-analysis of proportions obtained from individual studies. Considerable heterogeneity was found between the studies (I2 = 98.04%, P < .0001). A description of the clinical characteristics of the included studies can be found in Table 1. Summary effects and heterogeneity from the meta-analysis on the association of diabetes are provided in Table 2. Supplemental Table S1 provides a summary of significant meta-analysis outcomes. Summary data and performance estimates for sensitivity and specificity analysis are also provided in Supplemental Table S2. The results of methodological quality, risk of bias, and funding bias assessment of included studies are provided in Supplemental Table S3. One study demonstrated a moderate potential for funding bias. Effect size analyses for severe COVID-19, ARDS, mortality, and mechanical ventilation are also presented in Supplemental Figure S2.

Forest plots showing the association of diabetes with (A) mortality and (B) use of mechanical ventilation
TABLE 1. Clinical characteristics and clinical outcomes of studies included in the meta-analysis Study ID Author Year Country Study type Cohort Age (mean ± SD) Male (%) Severity definition ARDS definition Mechanical ventilation definition Overall DM nDM Overall DM nDM 1Akbariqomi28
2020 Iran Retrospective 595 54.33 ± 13.38 53.33 ± 14.97 57.3 ± 16.36 67.39 66.89 67.56 National Health Committee of China criteria NR Invasive mechanical ventilation 2 Al-Salameh2 2021 France Retrospective 432 72.61 ± 15.78 72 ± 18.62 72.83 ± 14.64 55.09 52.05 63.48 Berlin definition 3 Alguwaihes32 2020 Saudi Arabia Retrospective 439 55.2 ± 13.74 NR NR 68.34 66.67 71.94 Required intubation 4Cai33
2020 China Retrospective 941 57.02 ± 12.46 68.41 ± 14 56 ± 12.15 48.25 49.59 48.04 NR Invasive mechanical ventilation 5Chung36
2020 South Korea Retrospective 110 56.9 ± 17 66.3 ± 8.9 53.5 ± 17.9 43.64 48.28 41.98 Chinese Center for Disease Control and Prevention criteria Berlin definition Invasive mechanical ventilation 6 Fox34 2021 USA Retrospective 355 66.21 ± 14.21 66.42 ± 12.67 66.03 ± 15.46 49.01 51.81 46.56 Need for intubation 7 Kim39 2020 South Korea Retrospective 1082 56.06 ± 17.55 68.3 ± 11.9 56.5 ± 18 35.49 45.11 32.82 Severe disease defined as at least one of: ICU care, high-flow O2 nasal cannulae, mechanical ventilation, CRRT, or ECMO Mechanical ventilation 8 Liu31 2021 China Retrospective 233 62.33 ± 14.17 65.33 ± 10.7 63.5 ± 19.09 49.36 51.25 48.37 National Health Committee of China criteria 9 Mithal35 2021 India Prospective 401 54.06 ± 12.35 59.8 ± 12.1 47.7 ± 16.5 68.83 74.6 63.68 WHO Ordinal Scale 5 and above 10 Zhang40 2020 China Retrospective 258 63.33 ± 10.44 64.33 ± 10.62 63 ± 11.2 53.49 60.32 51.28 National Health Committee of China criteria Berlin definition Invasive mechanical ventilation 11 Zhang38 2020 China Retrospective 166 62.7 ± 14.2 65.6 ± 11.4 61.04 ± 15.34 51.2 54.1 49.52 National Health Committee of China Criteria Invasive mechanical ventilation 12 Tabrizi41 2021 Iran Retrospective 268 57.33 ± 17.14 63.67 ± 12.75 50 ± 17.23 53.36 53.54 53.19 Invasive mechanical ventilation 13 Khalili42 2020 Iran Retrospective 254 65.7 ± 12.51 66.28 ± 12.51 65.03 ± 12.53 55.91 55.91 55.91 Berlin definition Invasive mechanical ventilation 14 Raghavan43 2021 India Retrospective 845 55.51 ± 15.78 51 ± 17 60 ± 13 65.44 67.54 63.36 Need for intubation 15 Acharya37 2020 South Korea Retrospective 324 55 ± 21.4 69.8 ± 13.5 51.9 ± 21.4 41.67 36.36 42.75 16 Liu44 2020 China Retrospective 934 13.96 ± 62.03 64.5 ± 10 61.6 ± 14.5 48.61 47.48 48.81 NR 17 Soliman45 2020 Qatar Retrospective 303 13.25 ± 39.31 52.1 ± 12.67 36.22 ± 11.43 NR NR Mechanical ventilation 18 Wu46 2020 China Retrospective 66 14.71 ± 49.5 52.55 ± 13.7 47.98 ± 15.11 66.67 72.73 63.64 National Health Committee of China Criteria 19 Xu47 2020 China Retrospective 364 64.33 ± 13.4 65.33 ± 12.01 63 ± 15.66 56.59 54.39 57.6 20 Fadini48 2020 Italy Retrospective 413 64.9 ± 15.4 69.7 ± 13.8 63.3 ± 15.5 59.32 65.42 57.19 Composite of admission to the ICU (including all subjects needing mechanical ventilation) or death 21 Guo49 2020 China Retrospective 174 58.33 ± 13.46 61.67 ± 10.8 57 ± 14.24 43.68 54.05 40.88 22 Koh50 2021 Singapore Retrospective 1042 39 ± 11 48 ± 13 36.82 ± 10.19 95.39 92.14 95.9 WHO criteria 23 Li51 2020 China Retrospective 199 62.67 ± 18.67 68.67 ± 10.8 57 ± 14.24 44.72 65.79 31.71 24 Seiglie52 2020 USA Retrospective 450 17.29 ± 63.62 66.7 ± 14.2 61.6 ± 18.8 57.56 61.8 54.78 Study ID Smoking (current or past), n (%) Obesity, n (%) Hypertension, n (%) CVD, n (%) Pulmonary disease, n (%) Overall DM nDM Overall DM nDM Overall DM nDM Overall DM nDM Overall DM nDM 1 40 (6.7) 9 (6) 31 (6.9) 176 (29.6) 48 (32.4) 128 (28.6) 172 (28.9) 72 (48.6) 100 (22.3) 112 (18.8) 40 (27) 72 (16.1) 87 (14.6) 24 (16.2) 63 (14.09) 2 105 (35.84)
留言 (0)