
記住我

Several risk-adjustment models have been developed for patients in the intensive care unit (ICU), including the Sequential Organ Failure Assessment (SOFA) score,1 the Acute Physiology and Chronic Health Evaluation (APACHE) system,2, 3 the Simplified Acute Physiology Score (SAPS),4 and the Mortality Prediction Model (MPM).5
Administrative databases are widely used in clinical studies because they are routinely collected, represent accurate records of care unaffected by recall bias, and contain data on general population samples with large numbers of patients. However, the information necessary for risk-adjustment models is not available in administrative databases because of the lack of clinical vital signs and laboratory data. Thus, studies on ICU mortality using administrative data may have several limitations, including inadequate risk adjustment and confounding by indication.6, 7 Since April 1, 2018, the data of the SOFA score have been available in the Japanese Diagnosis Procedure Combination database, a national administrative inpatient database in Japan. However, these data are only available for patients who were admitted to specific ICUs or patients admitted for sepsis from April 2018.8 This limits the number of patients available for severity score adjustment and undermines the strength of generalizability for a real-world administrative database.
To address these issues, several administrative database studies have attempted to develop risk-adjustment models for ICU patients using data on patients' characteristics, comorbidities, and primary diagnoses; these models have shown good performance for predicting mortality.9-11 In addition to data on patients' characteristics, comorbidities, and primary diagnoses, including information on therapeutic procedures for organ failure may improve risk adjustment and prediction of mortality in studies on ICU patients. Previous studies on surgical patients and noncritically ill patients have shown good performance of procedure-based risk adjustment models using administrative databases.12, 13 However, to the best of our knowledge, no published work has evaluated procedure-based risk adjustment models using time-series information on procedures for ICU patients.
Therefore, using a nationwide inpatient administrative database in Japan, the present study aimed to develop a procedure-based organ failure assessment model for ICU patients and to examine the ability of this model to predict in-hospital mortality, with reference to SOFA score. We also aimed to develop further adjustment models including physiological severity and baseline characteristics to improve the model's performance. We hypothesized that the discriminatory abilities of models using therapeutic procedures for organ failure would be superior to those using the SOFA score because previous studies of procedure-based risk adjustment models using administrative databases have shown high prediction performance.12, 13 A newly developed procedure-based organ failure assessment model would then be used for administrative and research purposes rather than for clinical use.
METHODS Source of dataWe used the Japanese Diagnosis Procedure Combination inpatient database, which contains discharge abstracts and administrative claims data from hospitals in Japan that voluntarily contribute to the database.14 Japan established a universal health insurance system in 1961, and this government-run public insurance system currently covers almost 120 million people of all ages in Japan. Reimbursement of costs at the hospitals participating in the Diagnosis Procedure Combination database is performed by a lump-sum payment under this universal health insurance system.14 All academic hospitals are obliged to participate in the Diagnosis Procedure Combination database, but participation by community hospitals is voluntary. For 2017, this database included data from about 500 ICU-equipped hospitals with about 5,500 ICU beds, accounting for 70% of all ICU beds in Japan.8 The database includes the following patient-level data for all hospitalizations: age, sex, diagnoses recoded with International Classification of Diseases, 10th Revision codes, daily procedures recorded using Japanese medical procedure codes, daily drug administrations, and admission and discharge status. A previous validation study of this database showed high specificity and moderate sensitivity of recorded diagnoses, as well as high specificity and high sensitivity of recorded procedures.15
Since April 1, 2018, health care providers in Japan have been required to input SOFA scores for patients admitted to the ICUs defined by Japanese procedure codes A3011 and A3012; these ICUs account for approximately 30% of all ICU beds in Japan.8 SOFA score, which ranges from 0 (best) to 24 (worst) points,1 is recorded on the day of ICU admission.
ParticipantsWe included all patients aged ≥15 years who were admitted to an ICU in the Japanese Diagnosis Procedure Combination inpatient database from April 1, 2018, to March 31, 2019. We excluded patients with missing data on SOFA score on the day of ICU admission and those with missing data on body weight or body height at admission.
We assigned the eligible patients admitted from April 1, 2018, to September 30, 2018, to the derivation cohort used for developing the model, and we assigned eligible patients admitted from October 1, 2018, to March 31, 2019, to the validation cohort used for evaluating the model’s performance.
OutcomeThe primary outcome was in-hospital mortality.
PredictorsFor the development of a procedure-based organ failure assessment model, we extracted the following data on therapeutic procedures for organ failure performed on the day of ICU admission: oxygen supplementation, invasive mechanical ventilation, blood transfusions (red blood cell, fresh frozen plasma, and platelet), catecholamines (dopamine, dobutamine, norepinephrine, epinephrine, and vasopressin), chest compression, extracorporeal membrane oxygenation, and renal replacement therapy. We chose these procedures because they are common treatments for six types of organ failure that comprise the SOFA score: respiratory (oxygen supplementation and invasive mechanical ventilation), coagulatory (platelet transfusion), liver (fresh frozen plasma transfusion), cardiovascular (catecholamines, chest compression, extracorporeal membrane oxygenation, and red blood cell transfusion), central nervous system (invasive mechanical ventilation), and renal (renal replacement therapy).1 We did not include the disease-specific procedures into a procedure-based organ failure assessment model. Doses of dopamine, norepinephrine, and epinephrine were calculated using the total daily amount of each drug and body weight at admission and were categorized according to the SOFA score.1 We used the data on the day of ICU admission to construct the models because risk adjustment for patient severity is usually conducted on the day of ICU admission in cohort studies of ICU patients.
For further adjustment of baseline characteristics, we also extracted data on age, sex, body mass index at admission,16 Charlson comorbidity index score,17 Japan Coma Scale at admission,18 ICU admission classification (elective surgery, emergency surgery, or non-operative), and primary diagnosis. The Japan Coma Scale score at admission is required to be input into the database for all patients as part of the admission status. This score was categorized as alert, dizzy, somnolent, or coma.18
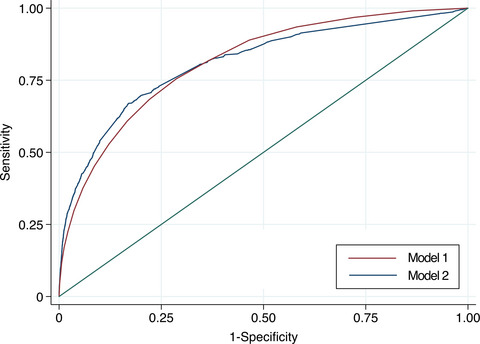
Statistical analysisA procedure-based organ failure assessment model for in-hospital mortality (Model 1) was developed using multivariable logistic regression analysis with therapeutic procedures for organ failure on the day of ICU admission in the derivation cohort. We also constructed multivariable logistic regression models with the following independent variables in the derivation cohort: SOFA score on the day of ICU admission (Model 2), procedures for organ failure and baseline characteristics (Model 3), and SOFA score and baseline characteristics (Model 4). The predictors used in each model are presented in Table 1.
Table 1. List of predictors used in the models Model Predictors 1 Oxygen supplementation, invasive mechanical ventilation, blood transfusions (red blood cell, fresh frozen plasma, and platelet), catecholamines (dopamine, dobutamine, norepinephrine, epinephrine, and vasopressin), chest compression, extracorporeal membrane oxygenation, and renal replacement therapy 2 SOFA score on the day of ICU admission 3 Age, sex, body mass index at admission, Charlson comorbidity index score, Japan Coma Scale at admission, ICU admission classification, primary diagnosis, oxygen supplementation, invasive mechanical ventilation, blood transfusions (red blood cell, fresh frozen plasma, and platelet), catecholamines (dopamine, dobutamine, norepinephrine, epinephrine, and vasopressin), chest compression, extracorporeal membrane oxygenation, renal replacement therapy 4 Age, sex, body mass index at admission, Charlson comorbidity index score, Japan Coma Scale at admission, ICU admission classification, primary diagnosis, and SOFA score on the day of ICU admission Model 1: procedure-based organ failure; Model 2: SOFA score on the day of ICU admission; Model 3: procedure-based organ failure and baseline characteristics; Model 4: SOFA score and baseline characteristics. ICU, intensive care unit; SOFA, Sequential Organ Failure Assessment.The discriminatory ability of the models was assessed using areas under the receiver operating characteristic curve (AUROC) and their 95% confidence intervals in the derivation and validation cohorts.19 We also compared the discriminatory ability of the models in the derivation and validation cohorts, using an algorithm for the test of equality of AUROC suggested by DeLong et al.20 Briefly, this test is a nonparametric approach to the analysis of receiver operating characteristic curves in which the theory on generalized U-statistics is used to generate an estimated covariance matrix. The calibration ability of the models was assessed by creating calibration plots for the validation cohort. In the calibration plot, observed mortality was plotted against each decile of predicted mortality.21 Ideally, the slope and intercept would be 1 and 0, respectively, and the plot would correspond to the diagonal line.
Continuous variables are presented as means and standard deviations or as medians and interquartile ranges, as appropriate. Categorical variables are described with numbers and percentages. Sample size calculation for comparison of the two hypothesized AUROCs of 0.80 and 0.81 showed that the required total sample sizes were 19,822 for type I error of <0.05 and 29,528 for type I error of <0.01.22 Because of the large sample size in this study, a P value of <0.01 was considered statistically significant. All reported P values were two-sided. There were missing data for the SOFA score on the day of ICU admission and body weight or body height at admission, but no other data were missing. All analyses were performed using Stata/MP 16.0 software (StataCorp, College Station, TX, USA).
Sensitivity analysesPatients receiving end-of-life or palliative care, particularly older patients aged ≥75 years, may be unlikely to accept life-supportive interventions. Therefore, we performed sensitivity analyses excluding patients aged ≥75 years. We calculated the AUROCs and compared these among the models as in the main analyses.
RESULTSWe identified 69,019 eligible patients aged ≥15 years who were admitted to ICUs during the study period (Fig. 1). Of these patients, 36,949 were assigned to the derivation cohort and 32,070 were assigned to the validation cohort.

Patient flowchart. ICU, intensive care unit; SOFA, Sequential Organ Failure Assessment.
There were 21,643 patients with missing data for the SOFA score on the day of ICU admission and 3,211 patients with missing data for body weight or body height at admission. The characteristics of patients with and without missing data are compared in Table S1.
The median age was 70 years, and 61.3% of the patients were male (Table 2). More than half of the admissions were for elective surgery, and cancer was the primary diagnosis for one-third of the admissions. The percentages of patients with mechanical ventilation and noradrenaline were 14.6% and 32.5%, respectively. The median SOFA score on the day of ICU admission was 3 (interquartile range, 1–7). Overall in-hospital mortality was 7.2%. The examined characteristics were similar in the derivation and validation cohorts.
Table 2. Characteristics of patients included in the study CharacteristicOverall
cohort
(n = 69,019)
Derivation
cohort
(n = 36,949)
Validation
cohort
(n = 32,070)
Age, years, median (IQR) 70 (60–78) 70 (60–78) 70 (60–78) Male, n (%) 42,333 (61.3) 22,464 (60.8) 19,869 (62.0) Body mass index at admission, kg/m2, n (%) <18.5 8,716 (12.6) 4,908 (13.3) 3,808 (11.9) 18.5–24.9 42,266 (61.2) 22,627 (61.2) 19,639 (61.2) 25.0–29.9 14,517 (21.0) 7,545 (20.4) 6,972 (21.7) ≥30.0 3,520 (5.1) 1,869 (5.1) 1,651 (5.1) Charlson comorbidity index, mean (SD) 1.3 (1.6) 1.3 (1.6) 1.3 (1.5) Japan Coma Scale at admission, n (%) Alert 58,787 (85.2) 31,590 (85.5) 27,197 (84.8) Dizzy 5,296 (7.7) 2,817 (7.6) 2,479 (7.7) Somnolent 1,798 (2.6) 923 (2.5) 875 (2.7) Coma 3,138 (4.5) 1,619 (4.4) 1,519 (4.7) Admission classification, n (%) Elective surgery 38,922 (56.4) 20,918 (56.6) 18,004 (56.1) Emergency surgery 9,130 (13.2) 4,980 (13.5) 4,150 (12.9) Non-operative 20,967 (30.4) 11,051 (29.9) 9,916 (30.9) Primary diagnosis, n (%) Cancer 22,684 (32.9) 12,369 (33.5) 10,315 (32.2) Cardiac disease 16,851 (24.4) 8,770 (23.7) 8,081 (25.2) Circulatory disease other than cardiac 11,956 (17.3) 6,185 (16.7) 5,771 (18.0) Abdominal disease 3,734 (5.4) 2,147 (5.8) 1,587 (4.9) Trauma 2,612 (3.8) 1,393 (3.8) 1,219 (3.8) Other 11,182 (16.2) 6,085 (16.5) 5,097 (15.9) SOFA score at ICU admission, median (IQR) 3.0 (1.0–7.0) 3.0 (1.0–7.0) 3.0 (1.0–6.0) Procedures at ICU admission, n (%) Oxygen supplementation 13,922 (20.2) 7,371 (19.9) 6,551 (20.4) Mechanical ventilation 10,067 (14.6) 5,327 (14.4) 4,740 (14.8) Platelet transfusion 6,979 (10.1) 3,908 (10.6) 3,071 (9.6) Fresh frozen plasma transfusion 12,475 (18.1) 6,862 (18.6) 5,613 (17.5) Red blood cell transfusion 17,410 (25.2) 9,592 (26.0) 7,818 (24.4) Dopamine, n (%) <5 μg/kg/min 8,648 (12.5) 4,675 (12.7) 3,973 (12.4) <15 μg/kg/min 2,490 (3.6) 1,333 (3.6) 1,157 (3.6) ≥15 μg/kg/min 179 (0.3) 106 (0.3) 73 (0.2) Dobutamine 10,223 (14.8) 5,542 (15.0) 4,681 (14.6) Noradrenaline, n (%) <0.1 μg/kg/min 18,755 (27.2) 9,903 (26.8) 8,852 (27.6) ≥0.1 μg/kg/min 3,669 (5.3) 1,983 (5.4) 1,686 (5.3) Adrenaline, n (%) <0.1 μg/kg/min 6,089 (8.8) 3,214 (8.7) 2,875 (9.0) ≥0.1 μg/kg/min 330 (0.5) 178 (0.5) 152 (0.5) Vasopressin 1,447 (2.1) 772 (2.1) 675 (2.1) Chest compression 1,104 (1.6) 549 (1.5) 555 (1.7) Extracorporeal membrane oxygenation 635 (0.9) 332 (0.9) 303 (0.9) Renal replacement therapy 2,726 (3.9) 1,511 (4.1) 1,215 (3.8) In-hospital mortality 4,943 (7.2) 2,655 (7.2) 2,288 (7.1) ICU, intensive care unit; IQR, interquartile range; SD, standard deviation; SOFA, Sequential 3 Organ Failure Assessment.The results of the multivariable logistic regression analysis for Models 1–4 in the derivation cohort are shown in Table 3. All the examined therapeutic procedures for organ failure performed on the day of ICU admission were significantly associated with increased risk of death in Model 3.
Table 3. Results of the multivariable logistic regression analysis for Models 1–4 in the derivation cohort CharacteristicsModel 1
Odds ratio
(95% CI)
Model 2
Odds ratio
(95% CI)
Model 3
Odds ratio
(95% CI)
Model 4
Odds ratio
(95% CI)
Age, years — — 1.02 (1.02–1.02) 1.02 (1.01–1.02) Male — — 1.22 (1.10–1.34) 1.08 (0.98–1.18) Body mass index at admission, kg/m2 <18.5 — — Reference Reference 18.5–24.9 — — 0.66 (0.59–0.75) 0.62 (0.55–0.70) 25.0–29.9 — — 0.61 (0.53–0.71) 0.53 (0.45–0.61) ≥30.0 — — 0.65 (0.51–0.83) 0.51 (0.40–0.65) Charlson comorbidity index — — 1.13 (1.10–1.16) 1.10 (1.07–1.13) Japan Coma Scale at admission Alert — — Ref Ref Dizziness — — 1.15 (1.00–1.32) 1.03 (0.90–1.18) Somnolence — — 1.31 (1.07–1.62) 1.09 (0.89–1.34) Coma — — 2.66 (2.29–3.09) 2.29 (1.99–2.63) Admission classification Elective surgery — — Ref Ref Emergency surgery — — 4.91 (4.12–5.85) 5.07 (4.26–6.04) Non-operative — — 13.1 (11.1–15.4) 11.4 (9.84–13.21) Primary diagnosis Cancer — — Ref Ref Cardiac diseases — — 0.36 (0.30–0.42) 0.42 (0.37–0.49) Circulatory diseases other than cardiac — — 0.53 (0.45–0.63) 0.56 (0.48–0.67) Abdominal disease — — 0.81 (0.67–0.98) 0.63 (0.52–0.76) Trauma — — 0.47 (0.37–0.60) 0.47 (0.37–0.59) Others — — 0.65 (0.56–0.76) 0.57 (0.49–0.66) SOFA score at ICU admission — 1.33 (1.32–1.35) — 1.28 (1.27–1.30) Procedures at ICU admission Oxygen supplementation 2.07 (1.86–2.30) — 1.35 (1.20–1.52) — Mechanical ventilation 4.36 (3.95–4.81) — 1.80 (1.60–2.02) — Platelet transfusion 1.68 (1.43–1.98) — 2.03 (1.72–2.40) — Fresh frozen plasma transfusion 0.85 (0.73–1.00) — 1.24 (1.06–1.46) — Red blood cell transfusion 1.3 (1.14–1.48) — 1.35 (1.18–1.54) — Dopamine <5 μg/kg/min 0.91 (0.79–1.05) — 1.33 (1.14–1.55) — <15 μg/kg/min 1.44 (1.19–1.75) — 1.66 (1.35–2.03) — ≥15 μg/kg/min 2.53 (1.48–4.32) — 2.99 (1.67–5.35) — Dobutamine 0.76 (0.67–0.87) — 1.23 (1.07–1.43) — Noradrenaline <0.1 μg/kg/min 1.14 (1.02–1.28) — 1.31 (1.17–1.47)
留言 (0)