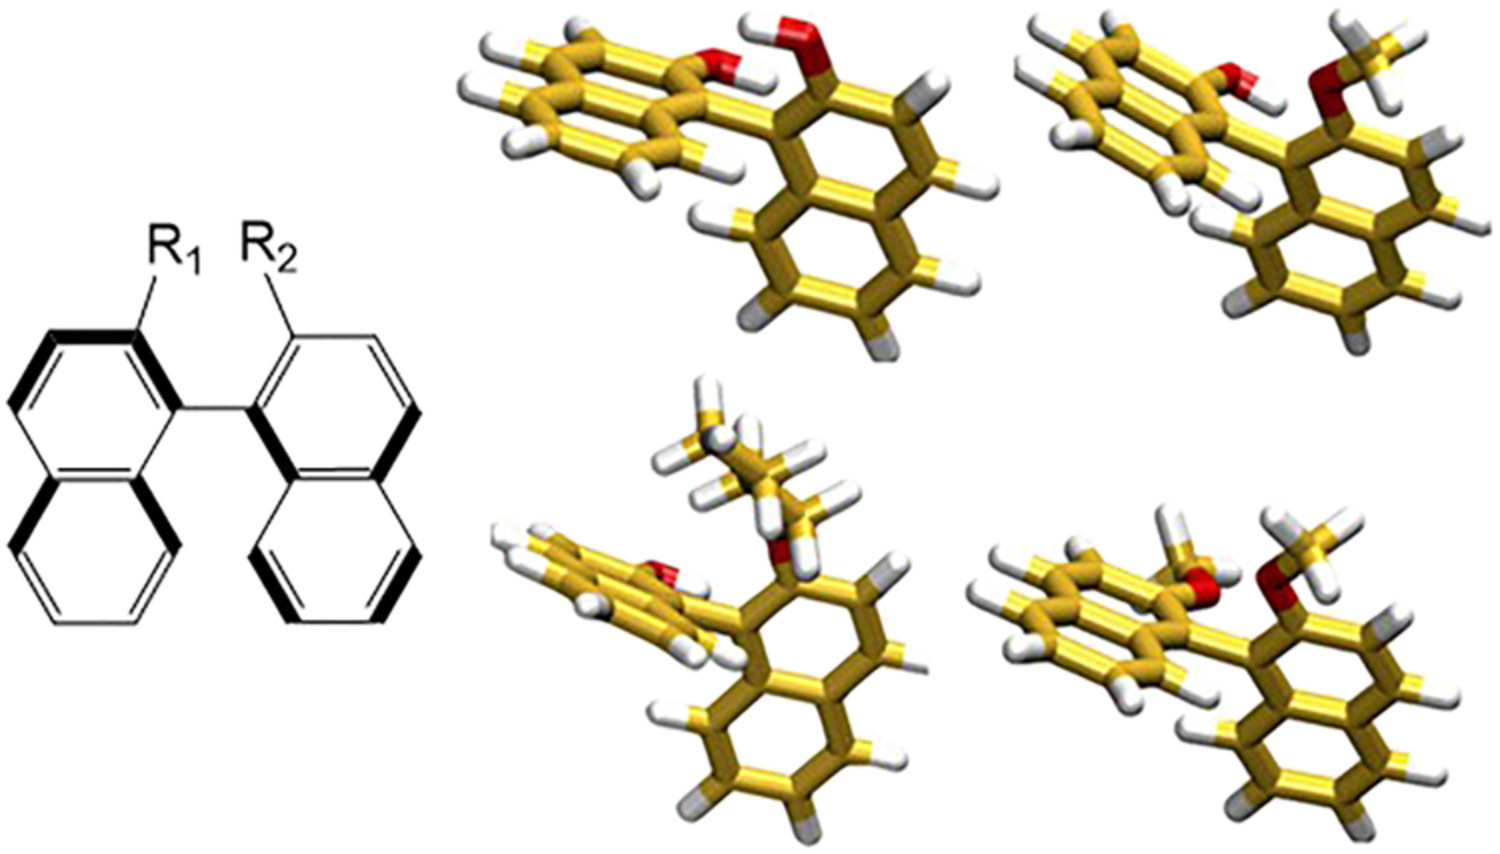
Photo racemization of 2,2′‐dihydroxy‐1,1′‐binaphthyl derivatives
Figure S1. Determination of k1’s by the least-squares method (R2 = constant of determination).
Figure S2. 1H NMR spectra of (R)-BINOL (a), (R)–BN–OMe/–OH (b) and (R)–BN–OBu/–OH (c) before (top) and after (bottom) the loss of CD intensity by 15% upon irradiation. [400 MHz, CDCl3, 23oC]
x denotes impurities which were present before irradiation, and red arrows those emerged after irradiation. The contents of the emerged compounds were estimated to be ca. 2% in a, 3% in b, 1% in c and 0% in d from the intensity ratios between aromatic signals and the signals marked by red arrows.
Figure S3. CD-UV spectral changes of (R)–BN–OMe/–OH in methanol on irradiation at 365 nm. [conc. 1.20 x 10⁻⁴ M, cell path 1-mm].
Figure S4. First-order plots of normalized gCD (239 nm) in early stages of photo racemization of BN–OMe/–OH in methanol.
Figure S5. Determination of k1 of the data shown in Figure S4 by the least-squares method (R2 = constant of determination)
Figure S6. 1H NMR spectra of (R)–BN–OMe/–OH before (top) and after (bottom) irradiation in methanol. [400 MHz, CDCl3, 23oC].
The contents of the emerged compounds were estimated to be ca. 12% from the intensity ratios between aromatic signals and the signals marked by red arrows.
Table S1. Computed ωB97xD/6-31G* energy values for the investigated BINOL derivatives for the ground state (S0), first excited state (S1) and Franck-Condon transition (FC).


留言 (0)