Table S1. Energetics. Absolute E, Correction to obtain G as calculated at the def2SVP basis set, in au, and relative ΔE and ΔG in kJ/mol. SVP means def2-SVP and TZVP means def2-TZVP basis sets.
Table S2. Optical rotations of 4a
Table S3. Kinetic of enantiomerization of 4a in ethanol
Table S4. Optical rotations of 4c
Table S5. Kinetic of enantiomerization of 4c in ethanol
Table S6. Kinetic of enantiomerization of 5a in heptane/ethanol/dichloromethane
Table S7. Kinetic of enantiomerization of 5c in heptane / isopropanol / dichloromethane (90/5/5) at 30 °C
Table S8. Kinetic of enantiomerization of 6a in heptane/ethanol/dichloromethane (80/10/10) at 25 °C
Table S9. Optical rotations of 7a
Table S10. Optical rotations of 7a
Table S11. Kinetic of enantiomerization of 7a in ethanol
Table S12. Optical rotations of palladacycle 15c
Table S13. Kinetic of enantiomerization of 15c in heptane / dichloromethane (1/1)
Table S14. Optical rotations of 16c
Table S15. Kinetic of enantiomerization of 16c in ethanol
Table S16. Kinetic of enantiomerization of 16c in dichloromethane
Figure S1. cHPLC analysis of palladium complex (rac)-4a
Figure S2. cHPLC analysis of the first eluted palladium complex 4a
Figure S3. cHPLC analysis of the second eluted palladium complex 4a
Figure S4. Electronic Circular Dichroism of complex 4a
Figure S5. Kinetic of enantiomerization of 4a in ethanol
Figure S6. cHPLC analysis of palladium complex (rac)-4c
Figure S7. cHPLC analysis of the first eluted palladium complex 4c
Figure S8. cHPLC analysis of the second eluted palladium complex 4c
Figure S9. Electronic Circular Dichroism of complex 4c
Figure S10. Kinetic of enantiomerization of 4c in ethanol
Figure S11. cHPLC analysis of copper complex (rac)-5a
Figure S12. Kinetic of enantiomerization of copper complex 5a in heptane/ethanol/dichloromethane
Figure S13. Ball-and-stick representation of racemic copper complex 5a (most of hydrogen atoms have been omitted for clarity)
Figure S14. cHPLC analysis of copper complex (rac)-5c
Figure S15. Kinetic of enantiomerization of copper complex 5c in heptane /isopropanol/ dichloromethane (90/5/5) at 30 °C
Figure S16. cHPLC analysis of silver complex (rac)-6a
Figure S17. Kinetic of enantiomerization of silver complex 6a in heptane/ethanol/dichloromethane (80/10/10) at 25 °C
Figure S18. Ball-and-stick representation of racemic silver complex 6a (most of hydrogen atoms have been omitted for clarity)
Figure S19. cHPLC analysis of gold complex (rac)-7a
Figure S20. cHPLC analysis of the first eluted gold complex 7a
Figure S21. cHPLC analysis of the second eluted gold complex 7a
Figure S22. Electronic Circular Dichroism of complex 7a
Figure S23. Kinetic of enantiomerization of 7a in ethanol
Figure S24. Ball-and-stick representation of the first eluted enantiomer of 7a (most of hydrogen atoms have been omitted for clarity)
Figure S25. cHPLC analysis of palladacycle (rac)-15c
Figure S26. cHPLC analysis of the first eluted palladacycle 15c
Figure S27. cHPLC analysis of the second eluted palladacycle 15c
Figure S28. Electronic Circular Dichroism of complex 19c
Figure S29. Kinetic of enantiomerization of 15c in heptane/dichloromethane (1/1)
Figure S30. cHPLC analysis of rhodium complex (rac)-16c
Figure S31. cHPLC analysis of the first eluted rhodium complex 16c
Figure S32. cHPLC analysis of the second eluted rhodium complex 16c
Figure S33. Electronic Circular Dichroism of complex 16c
Figure S34. Kinetic of enantiomerization of 16c in ethanol
Figure S35. Kinetic of enantiomerization of 16c in dichloromethane
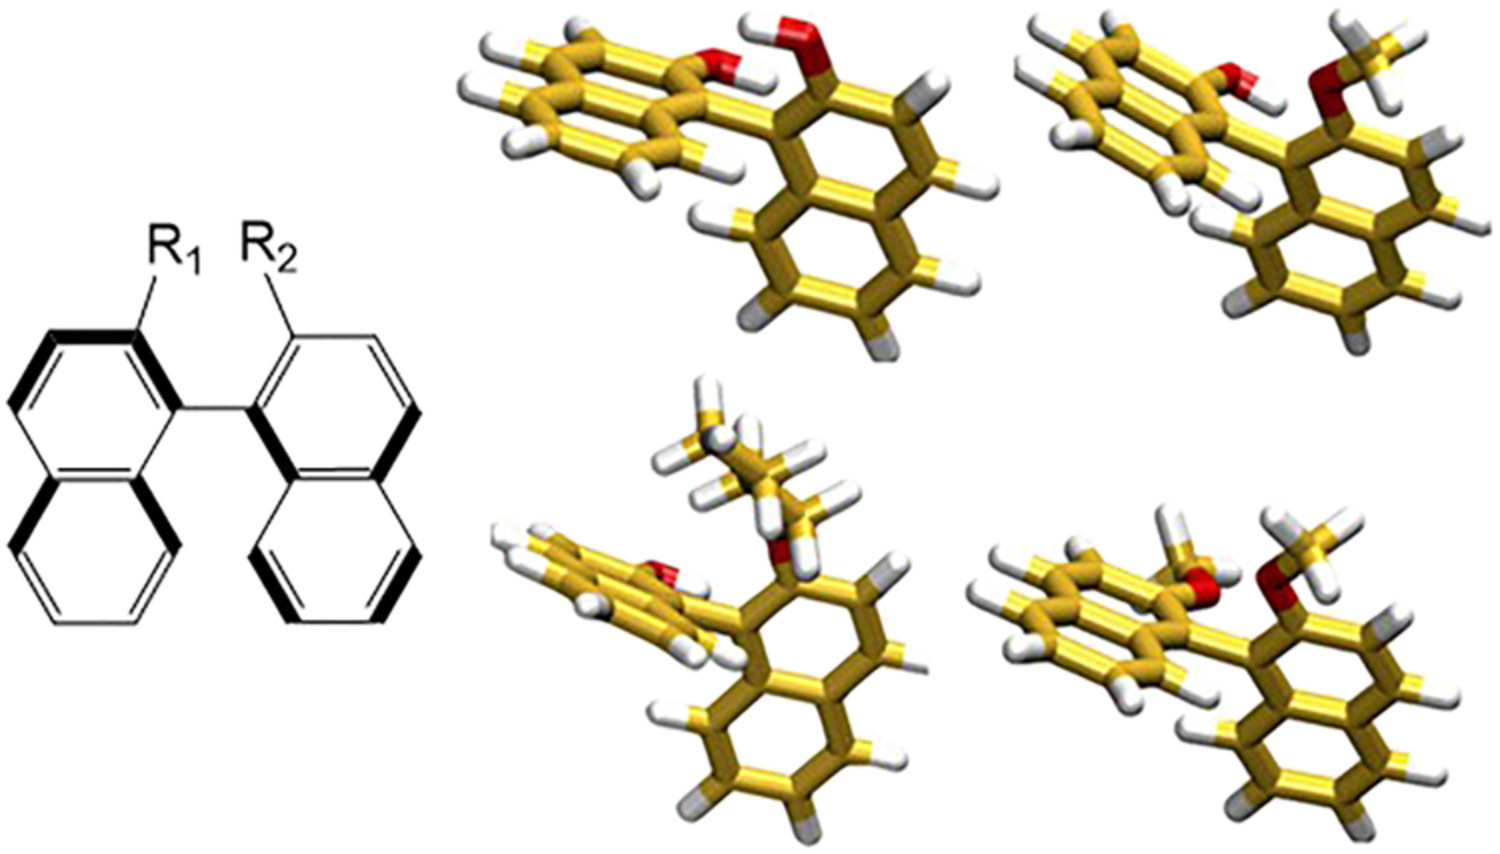
Figure S36. Optimized conformers of (Ra)-3a
Figure S37. Comparison of UV (top) and ECD (bottom) experimental spectra in acetonitrile for the second eluted enantiomer on Chiralpak IG and TD-DFT calculated spectra (σ = 0.39 eV, shifted by 4 nm).Vertical bars are oscillator and rotational strengths calculated for the two conformers with arbitrary unit.
Figure S38. Optimized conformers of (Ra)-4a
Figure S39. Comparison of UV (top) and ECD (bottom) experimental spectra in acetonitrile for the second eluted enantiomer on Lux-i-Amylose-3 and TD-DFT calculated spectra (σ = 0.35 eV, shifted by 6 nm). Vertical bars are oscillator and rotational strengths calculated for the two conformers with arbitrary unit.
Figure S40. Optimized conformers of (Ra)-4c
Figure S41. Comparison of UV (top) and ECD (bottom) experimental spectra in acetonitrile for the second eluted enantiomer on Chiralpak IG and TD-DFT calculated spectra (σ = 0.39 eV, shifted by 4 nm). Vertical bars are oscillator and rotational strengths calculated for the two conformers with arbitrary unit.


留言 (0)