
記住我


This analysis was based on data from a cluster randomized controlled trial called the Healthy Neighborhoods Project (HNP), implemented in 23 of the 73 neighborhoods in New Orleans, to examine the impact of vacant land and building property remediation on violence, health, and mindsets around health. Neighborhoods were selected based on rates of violent crime, which were higher than the city’s mean, and these neighborhoods also had higher rates of poverty than the rest of the city. A list of vacant properties with civil court judgements of code violation under a citywide ordinance was entered into a cluster analysis using STATA to form geographic clusters for randomization, with a roughly 1/8 mile radius, separated enough to prevent contamination. The analysis excluded lots with land area greater than 20,000 square feet and the maximum distance between lots within a cluster was set at 330 feet. It also excluded ineligible clusters with a total land area of ≤ 10,000 square feet and < two lots. From a randomly selected starting point, the program selected eligible clusters whose centroid was within 1320 feet of an included cluster. A total of 400 clusters were formed and those (N = 194) in the study neighborhoods were selected for inclusion. As described in Fig. 1, a total of 567 parcels within study clusters were sent to the City for treatment approval, with a total of 296 properties initially treated (53 structures and 243 lots) and 135 maintained over the full study duration (2020 to 2022). Parcels in control clusters (N = 129) were also treated beginning in summer 2023.
Fig. 1
Cluster randomization of the 194 clusters occurred in two segments as detailed in Fig. 2: clusters with both vacant lots and structures (N = 35) and clusters with just vacant lots (N = 159). Block random assignment within these groups was performed, with blocks defined as three larger communities based on their separation by main waterways and land use differences. A map of the geographic clusters is shown in Fig. 3.
Fig. 2 Fig. 3
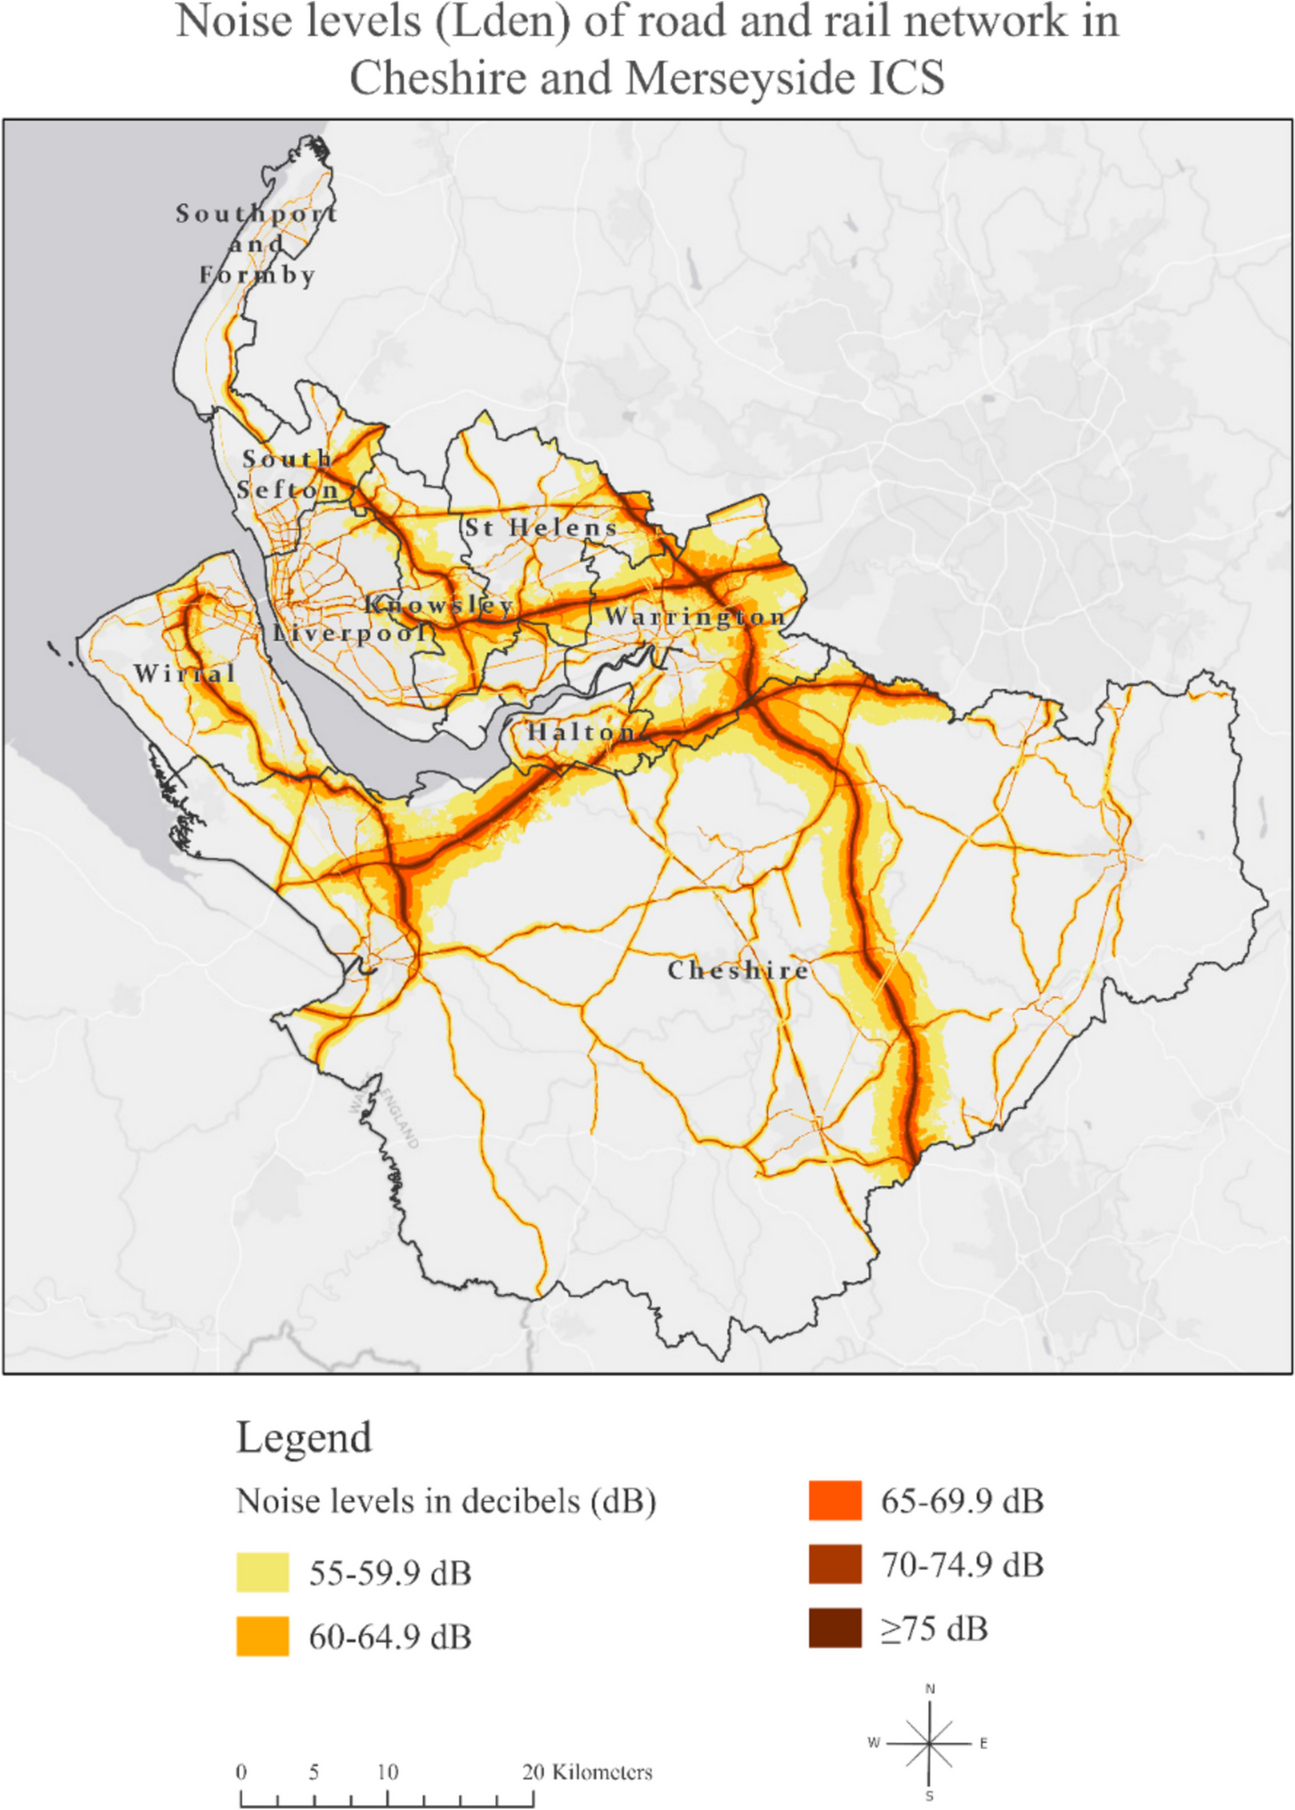
Geographic clusters randomized to treatment or control arms
Participants and Data CollectionA cohort of 405 participants was surveyed over five waves, beginning in January 2019 and completed in February 2023. Participants were recruited from the 101 intervention and 93 control clusters, and all residents from each cluster were invited to participate. Mailers were sent to valid addresses within each cluster, with approximately 1000 invitations sent out with the study and a Google Voice number for interested residents. There is a 40% response rate and an average of 4 residents per cluster (range, 1 to 5), with 201 residing in treatment and 204 in control clusters—83 in clusters with vacant homes or buildings and 322 in clusters with vacant lots only.
Two surveys were conducted pre-treatment of vacant lots and homes, and three surveys were conducted post-treatment and during the maintenance phase. Surveys were interviewer administered through REDCap™ by trained interviewers. Pre-pandemic, 5% of interviews were conducted in person, and 95% were conducted over the phone. During the pandemic, 100% of interviews were conducted via phone. Wave 2 data collection occurred 4 to 6 months after each participant’s baseline (n = 356); Wave 3, or the first post-treatment surveys, approximately 1 to 2 months post-treatment (n = 286); Wave 4 surveys 4 to 6 months after Wave 3 (n = 263); and Wave 5 conducted 4 to 6 months after Wave 4 (n = 223). Post-treatment surveys were staggered by treatment timeline so that respondents in treatment clusters and in control clusters in the same neighborhood received their Wave 3, or first post-treatment survey at a similar time during the calendar year. Approximately 40% of the cohort was lost-to-follow up over the study, which is not surprising given the timing—with COVID-19 starting in March 2020, and Hurricane Ida occurring in August 2021 and leaving much of the city with significant damage and a lack of power for weeks. However, participants were able to complete any of the concurrent waves of survey data collection even if they missed one. Forty-five percent of the baseline sample completed all five surveys. Of the final lost to follow-up, there were 9 deceased, 65 who opted out of continuing (many of whom relocated), and 117 who we were unable to schedule or reach. Given that Wave 2 began shortly after the pandemic and during Hurricane Ida, we suspect that many who we were unable to contact may have moved, and that the number of deceased may be greater. Nonetheless, we observed no differences in those lost to follow-up from those who remained in any of the sociodemographic factors or outcomes of interest, and no differences between treatment and control cluster arms.
TreatmentImplementation began in January 2020 and continued through December 2022. Treatment consisted of both vacant land greening for lots without buildings or homes and abandoned building remediation for lots with buildings or homes. Lot greening consisted of the removal of all refuse, debris, and any overgrowth and the placement of a modest, low post-and-rail wooden fence or bollards around the lot. Building remediation included the removal of any trash or items on or around the structure, removal of broken or boarded windows, and preparation for painting; this was followed by installing new windows and painting where needed. For both lots with and without buildings, a maintenance phase followed treatment and consisted of bi-weekly litter removal, mowing and cleaning during the growing season, and monthly checks and mowing on the off-season for all grass. For buildings, this also included checks and replacement of any windows or paint touch-ups. Examples are shown in Fig. 4.
Fig. 4
Example of before and after treatment of vacant lots and homes
The Tulane University Institutional Review Board (IRB) approved the study, and the trial is registered with the ISRCTN Registry (#17,742,911).
MeasuresSurveys collected participant demographic information including age, sex at birth, race, marital status, employment status, and education level, as well as a range of measures that assessed mindsets around health, which were the primary outcomes of this analysis although not the primary outcomes of the trial itself. Outcomes for the current analysis included well-being, health interconnectedness, social capital markers, neighborhood disorder, and worry—including sense of safety—and direct and indirect violence experiences.
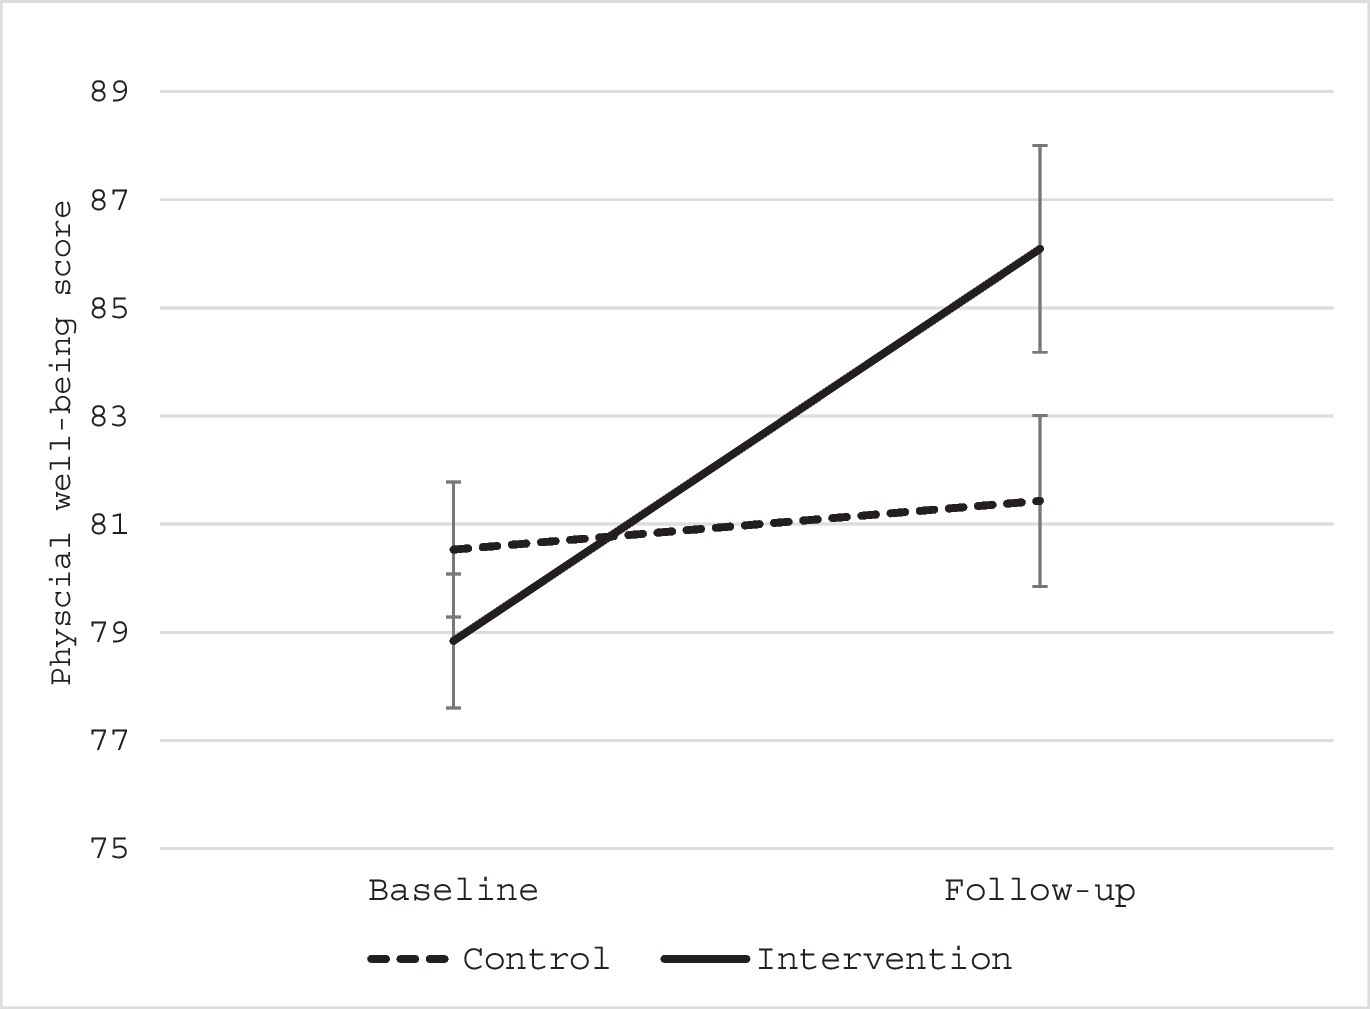
Well-being was assessed through a measure made up of five items scored on a five-point scale from 5 = “never” to 1 = “always” with questions related to how the respondent felt over the past month, with statements ranging from “I have felt cheerful and in good spirits” to “my daily life has been filled with things that interest me.” The total score ranged from 5 to 25, with higher scores indicating worse health.
The 4-item Perceived Stress Scale [16] was utilized to examine the level of reported stress. Respondents were asked, on a scale from 1 (“always”) to 5 (“never”), and scores were summed across items, ranging from 4 to 20, with higher scores indicating greater perceived stress.
Health interconnectedness was assessed through the Health Interdependence measure using three items [17]. One item scored on a 4-point scale from “a lot” = 1 to “not at all” = 4 (“How much would you say that the place where you live affects your own personal health?”), one item on a 3-point scale from “healthy” = 1 to “unhealthy” = 3 (“Overall, would you say that you live in a healthy community, an unhealthy one, or one that is somewhere in between?”), and the last item on overall health scored on a 4-point scale from “excellent” = 1 to “poor” = 4 (“Would you say your health in general was…”). Items were recoded into binary variables representing the belief that place impacts health (“a lot” or “some” vs. “not much” or “not at all”), that the respondent believed their neighborhood is a healthy one (vs. “unhealthy” or “somewhere in between”), and an excellent or good perception of their own health (vs. “fair” or “poor”).
Social capital was assessed with three separate indicators—sense of community, collective efficacy, and civic engagement. Sense of community was measured using the sense of community index (SCI), a validated tool that measures perceptions of connection and membership to a group or community [17]. The SCI includes 12 items, scored on a “Mostly true/Mostly false” scale for each item, resulting in total scores ranging from 0 to 12. The SCI was designed to include an overall score and four subscale scores that capture more specific constructs for sense of membership, sense of influence, reinforcement of needs, or shared emotional connection. SCI demonstrated strong reliability (Cronbach’s alpha = 0.85).
Participants’ perceptions of neighborhood collective efficacy were assessed with survey items taken from measures developed by Morenoff and colleagues [18] which included 8 items scored on a 5-point scale ranging from 1 (“strongly disagree”) to 5 (“strongly agree”), for total scores ranging from 8 to 40. Lower scores indicated a lower sense of collective efficacy. The measure demonstrated strong internal consistency in our sample (Cronbach’s alpha = 0.85).
Civic engagement was assessed with “yes” or “no” responses related to questions about how individual civic engagement might influence governmental decisions around health issues [17], combined into a summary score ranging from 0 to 6. Participants indicated whether they: “voted for or against a candidate for public office because of their position on a health problem or issue”; “contributed time or money to an organization working to prevent or cure a specific disease like cancer or HIV/AIDS”; “contributed time or money to an organization working to make the community a healthier place to live”; “contributed time or money to an organization working to pass a government health law or policy”; “volunteered for a group/board/committee/council that addresses health-related issues and activities for my community”; “written an email, letter or signed a petition on some health problem or issue.”
Neighborhood disorder and worry were measured with 17 binary (“yes” = 1/ “no” = 0) items indicating whether the respondent is worried about: drug dealers or users hanging around; having property stolen; walking alone during the day; walk alone at night; letting children go outside during the day; letting children go outside during the night; being robbed; being murdered; litter or trash on the sidewalks or streets; graffiti on buildings and walls; abandoned cars; vacant, abandoned, or boarded up buildings; houses and yards not kept up; drunks hanging around; gang activity; different social groups who do not get along with each other; and gun violence. Items were combined into an overall neighborhood disorder and worry score, ranging from 0 to 10 (Cronbach’s alpha = 0.92). Items were also broken down further to represent sub-scales for neighborhood disorder, worry about safety or fear of being victimized, and worry about community violence.
In addition to the items above, sense of safety was also measured with a perceived safety scale, measured on a scale from 1 to 10 (where 1 means “completely safe” and 10 means “extremely dangerous”) and with the question of how safe participants felt to walk around alone in their neighborhood after dark in the last month.
Direct and indirect violence experiences were measured with a series of six binary items (“yes” = 1 and “no” = 0) that asked respondents whether the following occurred in the last month: involvement in any fights in your neighborhood; seen someone shoved, kicked, or punched in your neighborhood; hearing gunshots in your neighborhood; carrying a gun in your neighborhood; experienced any kind of physical violence by friends or family members; and experienced any kind of physical violence by strangers. The variables were also combined into a summative score that ranged from 0 to 6, with higher values indicating greater exposure.
The primary exposure was measured at the cluster level as a binary variable (treatment vs. control cluster). A secondary exposure captured the level of treatment (control, moderate level, high level), which included information on the frequency of treatment maintenance (number of times treated and average time between treatments), whether any parcels in the cluster included fences installed, whether any dumping was removed on the parcel, the average cluster land size treated, and the number of lots treated within each cluster. Treatment clusters at the 75th percentile or higher on these factors were considered a higher level of treatment, while others were considered moderate. Fifty-six percent of the 194 clusters were in the treatment group, with 52% considered moderate and 48% high levels of treatment.
The primary cluster level moderator examined was ICE [15], estimated for every census tract in New Orleans, LA, using 2014–2018 American Community Survey (ACS) 5-year estimates of household income by race/ethnicity by taking the difference between the number of Non-Hispanic (NH) white persons whose annual household income was greater than or equal to the 80th percentile (> $100,000) minus the number of NH Black persons whose household income was less than the 20th income percentile (< $25,000), divided by the total population with known income in the tract. Values ranged from − 1 (indicating 100% of the population is concentrated in the most deprived group) to 1 (indicating 100% of the population is concentrated in the most privileged group), and for the purpose of testing effect modification, ICE was categorized as high or low based on the median value of the cluster sample.
Statistical AnalysisMultilevel repeated measures regression was employed, utilizing generalized estimating equations (GEE), to examine the impact of treatment over time, with participants nested within clusters and accounting for repeated measures over time among participants. Regression models were analyzed separately for each outcome. Moderation effects were tested with two-way interaction terms in the regression model and also stratified by ICE [19]. For ease of interpretation, we converted coefficients from models into the percentage change in outcomes. All analyses were conducted with SAS version 9.4.
留言 (0)