Experimental model
Experiments were performed on 21 male Sprague-Dawley rats (220 ± 23 g body weight, 90 days of age at the start of the experiments) in the Experimental Animals Unit of Trakya University (Edirne, Türkiye). The animals were housed at controlled temperature of 21 ± 2 °C and humidity of 55%, and a 12-hour dark-light cycle (light from 07:00 to 19:00 h).
The rats stayed individually in plastic cages with free ad libitum access to purified water and standard laboratory chow (Optima Rat Chow-Bolu, Türkiye; see for chemical composition Table 1). Tap water was purified by passing through an automatic reverse osmosis water system. The duration of the experimental period was 8 weeks. The animals were randomly assigned to three groups. The rats in the control group (C, n = 7) received purified water during the experimental period. The fructose group (F, n = 7) received purified water enriched with fructose. Rats in the fructose plus activity group (F + A, n = 7) had access to the fructose-enriched drinking water and performed voluntary physical activity using the running wheel present in their cages.
Table 1 The ingredients of standard laboratory feedThe fructose-enriched solution was prepared daily by dissolving D-fructose (BIOMATIK, Cat. No: A2419, Cambridge, Ontario, Canada) in the drinking water to an end-concentration of 200 g/L to induce Metabolic Syndrome in group F and F + A. Water consumption (with or without fructose) was measured daily. Daily fructose consumption was calculated by subtracting the remaining drinking water volume from the total volume administered. The study was completed without any mortality in the experimental groups.
To determine whether rats meet the criteria for Metabolic Syndrome, the serum concentrations of triacylglycerol, total cholesterol, high-density lipoprotein (HDL-C) and low-density lipoprotein (LDL-C), glycerol, fatty acids, glucose and insulin were analyzed at the end of the 8-weeks feeding period. Body weight and naso-anal length were measured at the end of experimental period in gram and in mm, respectively. The Lee index [24], also a marker of Metabolic Syndrome, was calculated using the formula of the rats’ cube root of body weight (g)x10 divided by the naso-anal length (mm). Another marker of Metabolic Syndrome, i.e., blood pressure (BP) was measured on the first day and one day before the last day of the experimental period.
The night before the animals were sacrificed, they were fasted for 12–14 h from 19:00 for standardized serum measurements of metabolites, including serum lipids as markers of metabolic syndrome. The next morning between 07:00 and 11:00 h, the rats were anesthetized with intraperitoneal injection of ketamine (60 mg/kg) + xylazine (5 mg/kg). Then the thorax was opened, and a blood sample was collected directly from the left ventricular cavity with a 10-ml syringe and 22-gauge needle. The dose of ketamine used in this study (60 mg/kg) was below levels that would cause metabolic changes. A previous study reported that ketamine did not cause changes in plasma insulin concentrations and could affect lipoprotein lipase activity in adipose tissue only at high (120 and 140 mg/kg) concentrations [25].
Blood samples were allowed to clot at room temperature for 30 min. Thereafter, the clotted blood samples were centrifuged at 3000 rpm for 15 min at 4 °C to obtain serum. The serum samples were stored at -80℃ until analysis. After collection of blood, the animals were rapidly sacrificed by exsanguination and tissue samples of the intraperitoneal tissue were obtained. Half of the samples were placed in liquid nitrogen and transferred into cryotubes and stored at -80 °C for protein analysis using the ELISA method. The other half of the retroperitoneal adipose tissue samples were placed in 10% formalin solution for histological/histochemical analysis. Thereafter, the heart and liver were extirpated and weighted. Subsequently, the right and left ventricle of the heart were obtained, and their weight measured. Heart weight (mg)/tibia length (mm) ratios were calculated to assess exercise-induced cardiac hypertrophy, if any [26]. The experimental protocol was approved by the Trakya University Animal Experiments Local Ethics Committee (TUHADYEK-2018/34).
Voluntary physical activity
The rats of group F + A were housed in plastic cages individually with free access to a stainless-steel running wheel as described previously [27]. The running wheel was mounted in each cage and a device recording the frequency of rotation were used, allowing for the measurement of the daily running distance. Similar to previous studies [28], the rotating wheels were 31.5 cm in diameter and 10 cm in width, and were placed in cages with a wheel base of 7 cm height above the floor of the cage and a circumference of 1081 cm. The running wheels were removable and cleanable. The rats of the F + A group were kept in cages with this kind of running wheel two weeks before the start of the experiment to familiarize the animals with the device. Based on our previous experiences, 2000 m/day was taken as the minimum average running activity required to qualify the rat as physically active [29].
Blood pressure and heart rate measurements
Blood pressure (BP) and heart rate (HR) was determined weekly with the tail-cuff plethysmography method in conscious rats using a tail sensor and a noninvasive blood pressure analyzer (MAY NIBP250 Commat-Türkiye). Prior to blood pressure measurements, each rat was placed in a heat cabinet with a restrainer, thereafter the ambient temperature of the cabinet was slowly increased to 32–34 °C. After 30 min to allow the rats to adapt and calm down, the warmth-induced dilated tail artery was ready for the measurements. A cuff was placed and inflated on the tail and the cuff was released several times to condition the rat for the procedure. BP and HR were measured five times by analyzing peak-by-peak pulses to acquire an average value. The measurements were performed at one-minute intervals, the highest and lowest measurements were excluded to obtain reliable blood pressure measurements, and the remaining three measurements were used to calculate the average systolic blood pressure (SBP), diastolic blood pressure (DBP), similar to a previous study [30].
Serum lipid and glucose concentrations
Serum triacylglycerol, total cholesterol, HDL-C, and LDL-C levels were measured by an enzymatic method (Abbot Architect c16, USA). The glycerol concentration in serum samples was determined using the Glycerol Colorimetric Assay Kit (BioVision Cat. No: K630-100, CA, USA) following the manufacturer’s instructions. The fatty acid concentration in serum samples was determined using the Free Fatty Acid Quantification Colorimetric Kit (BioVision Cat. No: K612-100, CA, USA) according to the manufacturer’s instructions. Glycerol and free fatty acid absorbances were measured using a spectrophotometer at 570 nm wavelength. A standard curve was constructed for each plate, and values were presented as mmol/L. The analyses of glycerol and free fatty acid concentrations were performed in duplicate.
Serum glucose levels were measured by an enzymatic method (Abbot Architect c16, USA), and insulin levels were determined by the enzyme-linked immunosorbent assay (ELISA) method (BT LAB Cat. No: E0707Ra, Shanghai, China). The Insulin resistance (HOMA-IR: Homeostatic Model Assessment for Insulin Resistance) value was calculated by the formula of HOMA-IR: serum insulin (mU/L) times blood glucose (mmol/L) divided by 14.5 [31].
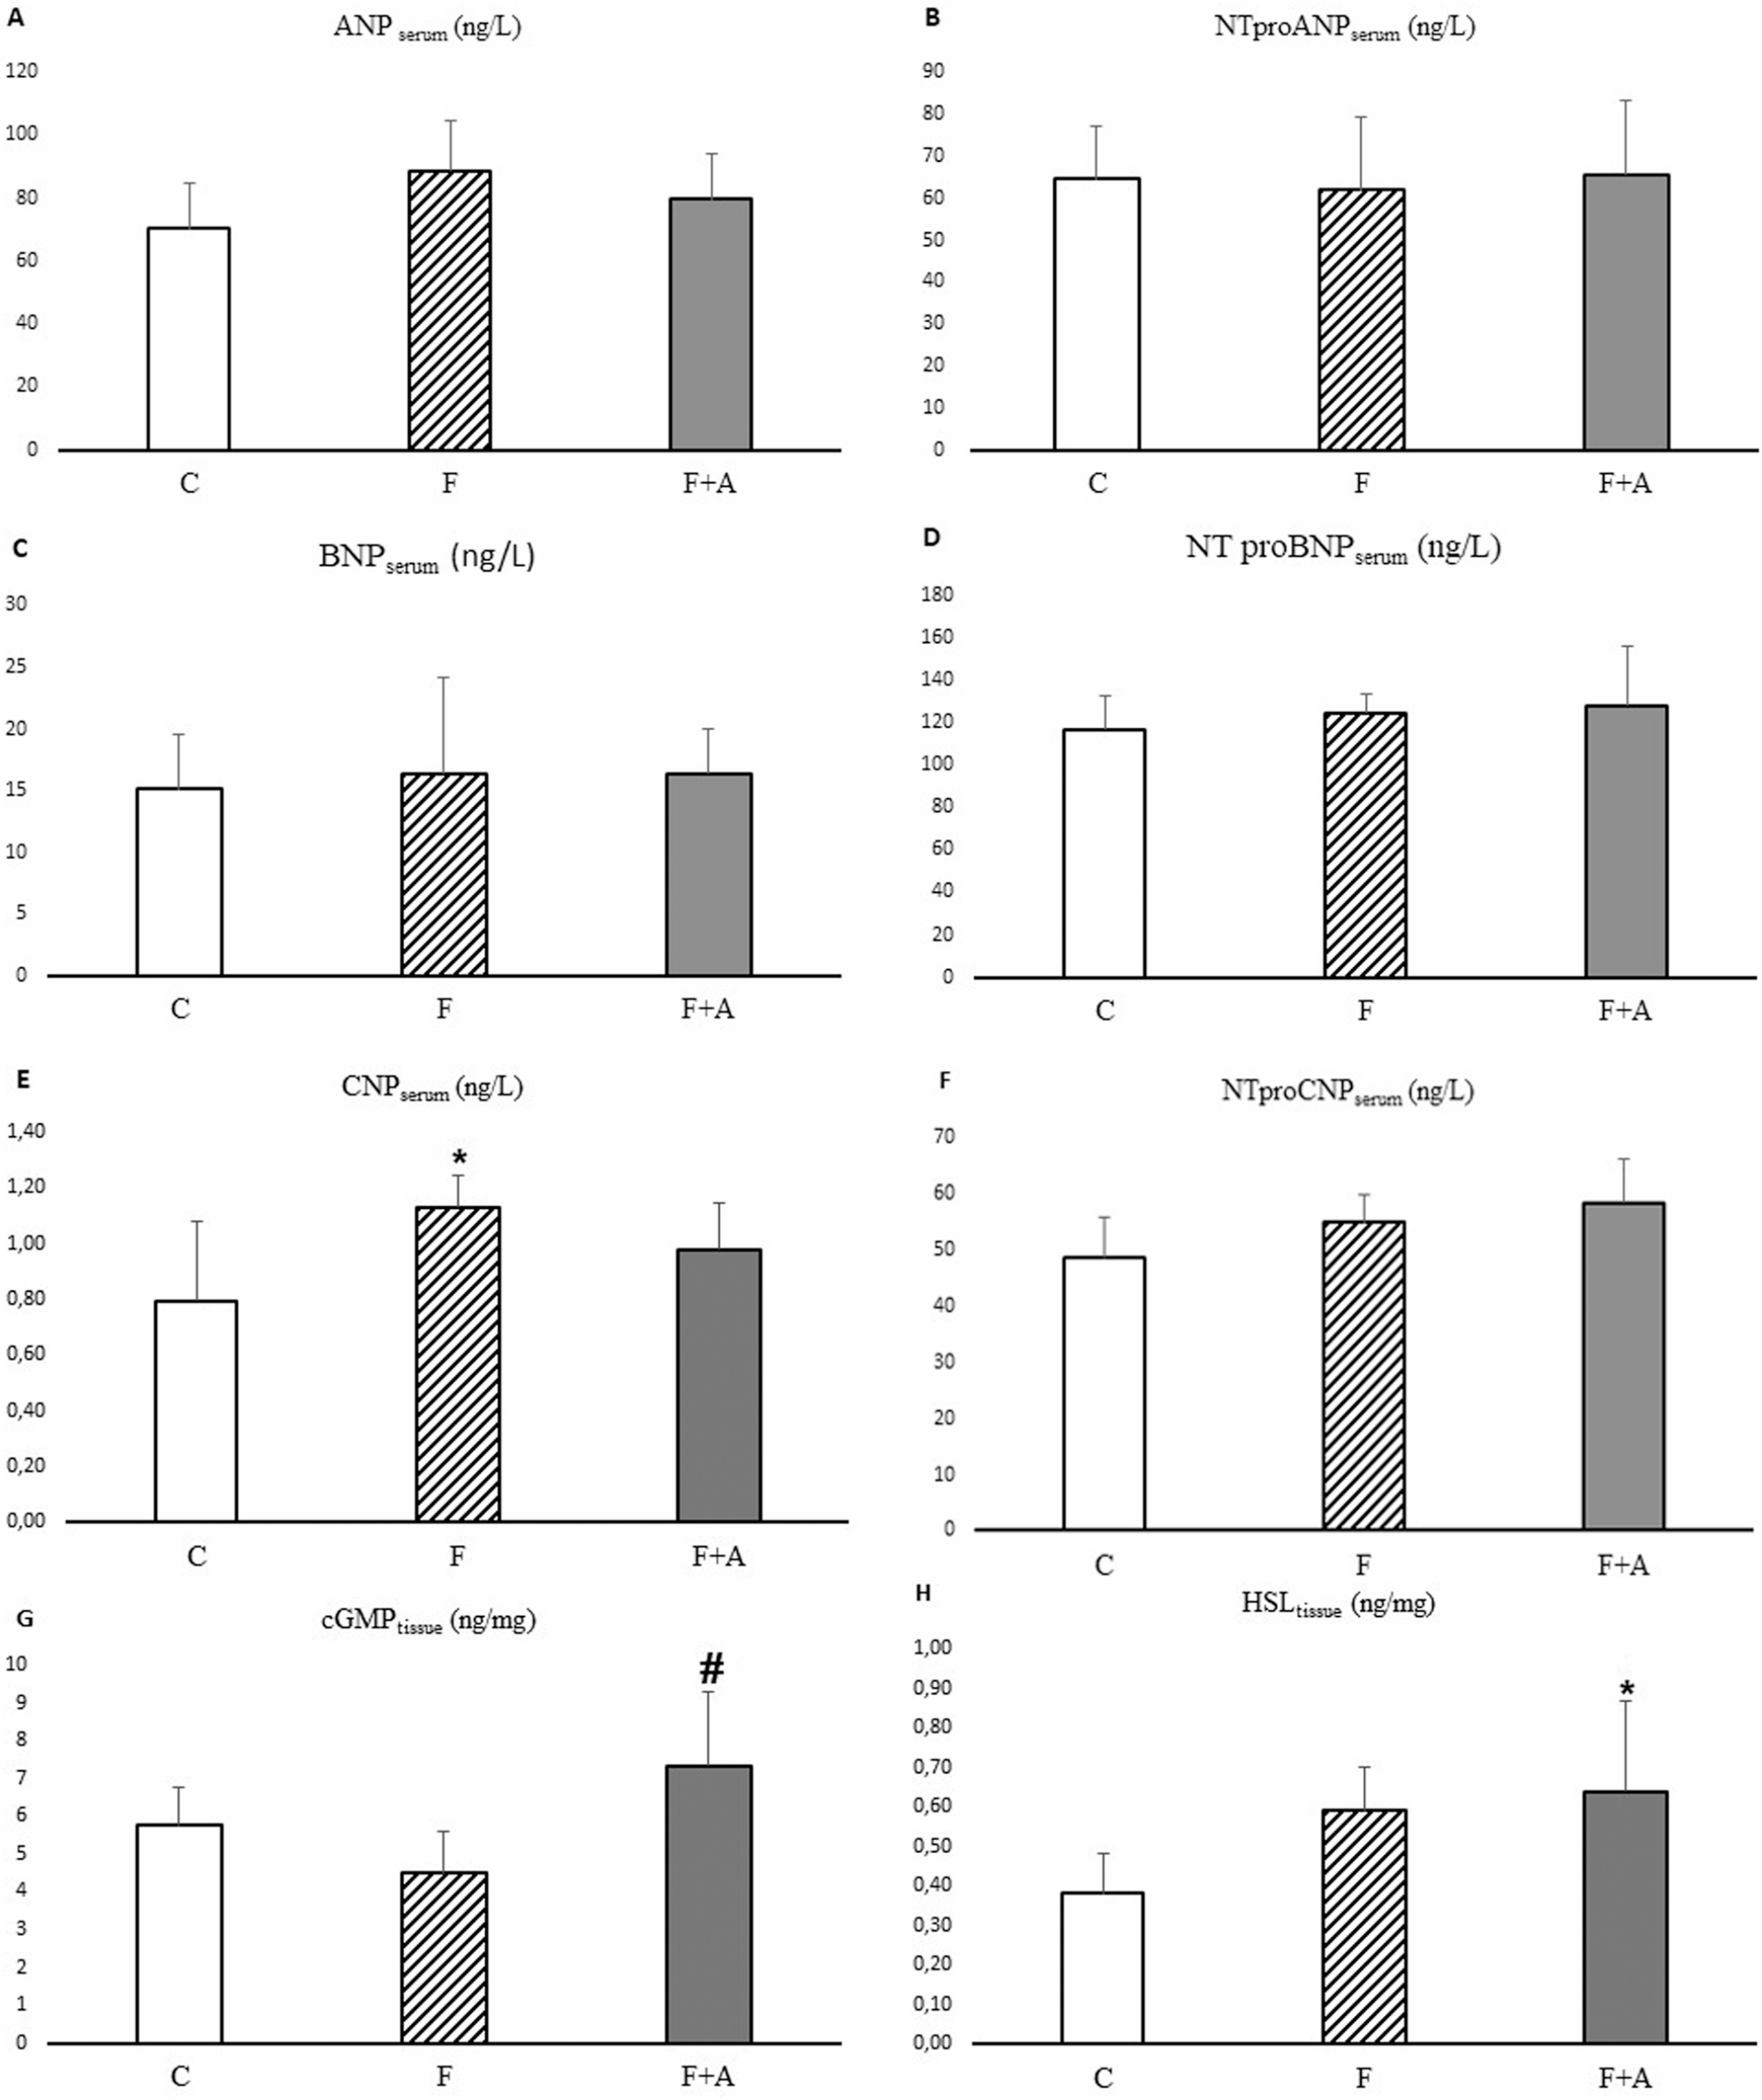
Serum ANP, BNP and CNP concentration
ANP (Cat. No: E0642Ra), NT-proANP (Cat. No: E1810Ra), BNP (Cat. No: E0475Ra), NT-proBNP (Cat. No: E0067Ra), CNP (Cat. No: E0055Ra) and NT-proCNP (Cat. No: E1811Ra) concentrations were measured by ELISA in duplicate (BT LAB, Shanghai, China). Detection ranges of the ELISA kits used in these analyses were 5 ng/L-1500 ng/L for ANP, 7 ng/L-1500 ng/L for NT-proANP, 1 ng/L-400 ng/L for BNP, 5 ng/L-2000 ng/L for NT-proBNP, 0.05 ng/mL-20 ng/mL for CNP, and 3 ng/L-900 ng/L for NT-proCNP. Intra-assay variation was less than 8% and inter-assay variation was less than 10%.
Tissue homogenization and measurement of protein content
Frozen retroperitoneal adipose tissue samples were minced with a scalpel and weighed on a precision scale. Then, 300 µL of cold homogenization buffer (Sigma-Aldrich, St. Louis, MO, USA) was added (10 mM phosphate-buffered saline [PBS], pH: 7.4, 500 µL/L Triton X-100) to approximately 300 mg of the frozen, minced adipose tissue. Thereafter, the samples were homogenized with an ultrasonic homogenizer for 10 s in an ice-cold environment. The homogenates were centrifuged at 3000 rpm for 10 min at 4 °C. The uppermost fat layer was removed from each tube and discarded. The remaining homogenate was maintained. Subsequently, 400 µL of ethanol: chloroform mixture (2:3) was added per 0.8 mL homogenate. The mixture was first vortexed in a vortex mixer and then centrifuged at 10,000 x g rotation speed at + 4 °C for 30 min. After centrifugation, two lipid layers were formed on top and bottom of the test tube with a liquid layer in between. The liquid layer was collected as ‘supernatant’. Supernatant processing was carried out using the method described by Alver et al. [32]. The protein concentration of supernatants was measured with the BCA Protein Assay Kit (SMART BCA Protein Assay Cat. No: 21071, MA, USA). The resulting supernatants were used in ELISA analyses.
Biochemical analysis of homogenates of retroperitoneal adipose tissue
In the present study, we determined the tissue content of cGMP (Cat. No: E0297Ra) being the second messenger stimulated by natriuretic peptides, the key lipolytic enzyme HSL (Cat. No: E0922Ra), and of AQP7 (Cat. No: E1421Ra) and AQP3 (Cat. No: E0567Ra), being proteins transporting glycerol as well as water in retroperitoneal adipose tissue, using an ELISA kit (BT LAB, Shanghai, China) according to the manufacturer’s instructions.
Histological analysis of adipose tissue
Retroperitoneal adipose tissue, fixated in 10% buffered formalin solution for 24 h, were submerged in paraffin blocks and sectioned to 4 μm thickness. Deparaffinization was carried out by keeping the slices in a 70oC oven for 1 h and subsequently in xylene at room temperature for 45 min. Slices were passed through graded ethanol solutions (ethanol content: 90-80-70%) and stained with hematoxylin-eosin (H&E) for the histo-morphometric examination of adipocytes under the light microscope (Nikon Eclipse E600). Tissue slices randomly selected per animal were embedded in paraffin blocks and each section was examined at X10 magnification using a light microscope. Cell diameter was determined using 30 adipocytes per section, three sections per animal, and seven animals per group. Dominant adipocyte population was selected, analyzed, and measured in each section.
For immunohistochemical staining of HSL and perilipin 1 (PLIN-1) levels in retroperitoneal adipose tissue, 4 μm thick sections prepared from formalin-fixed and paraffin-submerged tissues were placed on electrostatically charged slides and dried at 70 °C for at least 1 h. The immunohistochemical staining process was performed with a fully automatic immunohistochemical staining device (Ventana BenchMark Ultra IHC/ISH System, Tucson, AZ, USA) and antigen retrieval was performed. Anti-HSL antibody (mouse monoclonal antibody, 1:50 dilution, Cat. No: sc-74489, Santa Cruz Biotechnology, USA) and anti-perilipin 1 antibody (rabbit polyclonal antibody, 1:50 dilution, Cat. No: bs-10779R, Bioss Antibodies, USA) were applied to the adipose tissue slices, separately. “The entire immunohistochemical staining process, including deparaffinization, rehydration and antigen retrieval is performed by CC1 (prediluted; pH 8.0) antigen retrieval solution (Ventana Medical Systems, Roche Group, Tucson, AZ, USA), performed on the BenchMark ULTRA automated slide stainer (Ventana) for 64 minutes at 100°C (default temperature on ULTRA). The human adrenal gland served as positive control for HSL, and adipose tissue for PLIN-1. Positivity was determined by membranous staining for PLIN-1. Both for HSL and PLIN-1, at least five fields selected randomly were examined at 40X magnification and the results were expressed as percent staining.
Each case was scanned in at least five randomly selected fields at 40x magnification and reported as staining percentages. The percentage of immunopositive cells was categorized as follows: score 1: 0–5%, score 2: 5.1–50%, score 3: 50.1–80%, score 4: 80.1–100%. Additionally, scoring was performed based on the intensity of immunohistochemical staining. Staining intensity was classified as follows: score 0: negative, score 1: weak, score 2: moderate, score 3: strong. The staining score for each sample was obtained by multiplying the staining extent score by the staining intensity score [33]. All these assessments were conducted by a researcher who is an experienced pathologist.
Statistical analysis
All values are expressed as mean ± standard deviation (SD). Data were analyzed using the SPSS (Statistical Package for the Social Sciences) software. The Shapiro-Wilk test was used to check the normality of data distribution and the differences between variances. One-way ANOVA test and Tukey’s test were utilized to compare the variables showing normal distribution between the groups. The Kruskal-Wallis test and Mann-Whitney-U test were employed to compare the variables lacking a normal distribution. The Wilcoxon signed-rank test was used to compare activity levels between study weeks. A p-value ≤ 0.05 was considered statistically significant.


留言 (0)