Patient and public involvement
Obesity type 2 diabetes mellitus (O-T2DM) subject selection criteria: (a) all patients met the diagnostic criteria of the American Diabetes Association criteria (2018); (b) fasting blood glucose ≥ 7.0 mmol/L, glycosylated hemoglobin (HbA1C) ≥ 6.5%; (c) body mass index (BMI) ≥ 25 kg/m2; and (d) patients with complete background information. Exclusion criteria: (a) patients with severe liver, kidney, lung, or systemic disease; (B) patients with malignant tumors; (c) patients with neurological disease; (d) patients with vascular disease, inflammation, and immune disorders. The patients with O-T2DM in this study were from Hepingli Hospital and National Medical Hall of Beijing University of Traditional Chinese Medicine from December 2018 to September 2021, as well as the healthy physical examination population was recruited from the physical examination center of Hepingli Hospital and Water Conservancy Hospital. The study was approved by the Ethics Committee of Beijing University of Traditional Chinese Medicine (BUCM), with the ethical batch number of (2017BZHYLL0105). All procedures were performed in accordance with the Declaration of Helsinki, and all participants received written informed consent. Confidentiality should be observed by both the investigator and the subject. The enrolled subjects were divided into Control and O-T2DM groups (Total = 30, Normal = 15, O-T2DM = 15). There was no statistical difference between the Control and O-T2DM groups in terms of gender and age (P > 0.05). After enrollment, fasting venous blood was collected from both groups for subsequent experiments.
Total RNA extraction, mRNA library construction and Illumina sequencing
Peripheral blood was collected from subjects and centrifuged at 12,000×g for 15 min at 4 °C to extract serum, total RNA was isolated from collected serum samples using Trizol reagent (Invitrogen, Carlsbad,CA, USA), and RNA concentration and purity (OD260/280 and OD260/230) were measured using NanoPhotometer® spectrophotometer (IMPLEN, CA, USA); The RNA Nano 6000 Assay from Bioanalyzer 2100 Systems (Agilent Technologies, CA, USA) was used to accurately test sample RNA integrity. After RNA purification from total RNA using NEBnext ultra-RNA library prep kit, mRNA was enriched by Oligo (dT) magnetic beads according to manufacturer’s instructions. The first strand of cDNA was synthesized in M-MuLV reverse transcriptase system using fragmented mRNA as template and random oligonucleotide as primer. Then the RNA strand was degraded by RNase H, and the second strand of cDNA was synthesized from dNTPs in DNA polymerase I system [23]. The purified double-stranded cDNA was subjected to terminal repair, A-tail addition and sequencing adapter ligation. AMPure XP beads were used to screen cDNA of about 370–420 bp. PCR amplification was performed, and PCR products were purified again by AMPure XP beads. Finally, the library was obtained. The quality of the library was determined by using an Agilent 2100 System (NanoDrop ND-1000) analyzer and accurately quantified by quantitative real-time polymerase chain reaction (library effective concentrations greater than 2 nM). Prior to data analysis, ribosomal RNA (rRNA) was removed using the Epicentre Ribozero™ rRNA Removal Kit (Epicentre, USA). Linear RNA was removed using RNase R (Epicentre, USA). Subsequently, the fragments were randomly fragmented to 250–300 bp. Through fragment length selection, finally, all RNAs except ribosomal RNA and small-fragment RNAs (such as microRNA, siRNA, etc.) were obtained, including lncRNA, mRNA, circRNA, etc. A strand-specific library was constructed [24], and then sequenced using Illumina NovaSeq 6000.
Data quality control
Sequencing fragments are converted into reads by CASAVA base recognition from image data measured by high-throughput sequencer. Raw data is filtered by removing reads with adapters, removing reads containing N (N indicates that the base information cannot be determined), and removing low-quality reads (reads with Qphred ≤ 20 accounting for more than 50% of the total read length). At the same time, Q20, Q30 and GC content calculations were performed for clean data.
Identification of differentially expressed mRNA and circRNA
The expression of mRNAs was identified by the HTSeq (0.9.1) statistics. The Read Count values on each gene were considered to be the original expression level, and then the Fragments Per Kilobase of transcript sequence per Millions base pairs sequenced (FPKM) method was used to standardize them.
Use the two most commonly-used circRNA identification software, find_circ [19] and CIRI (v2.0.5) [25], and the methods in the corresponding references to identify circRNAs. Meanwhile, use Transcripts Per Kilobase Million (TPM) for normalization of the expression level.
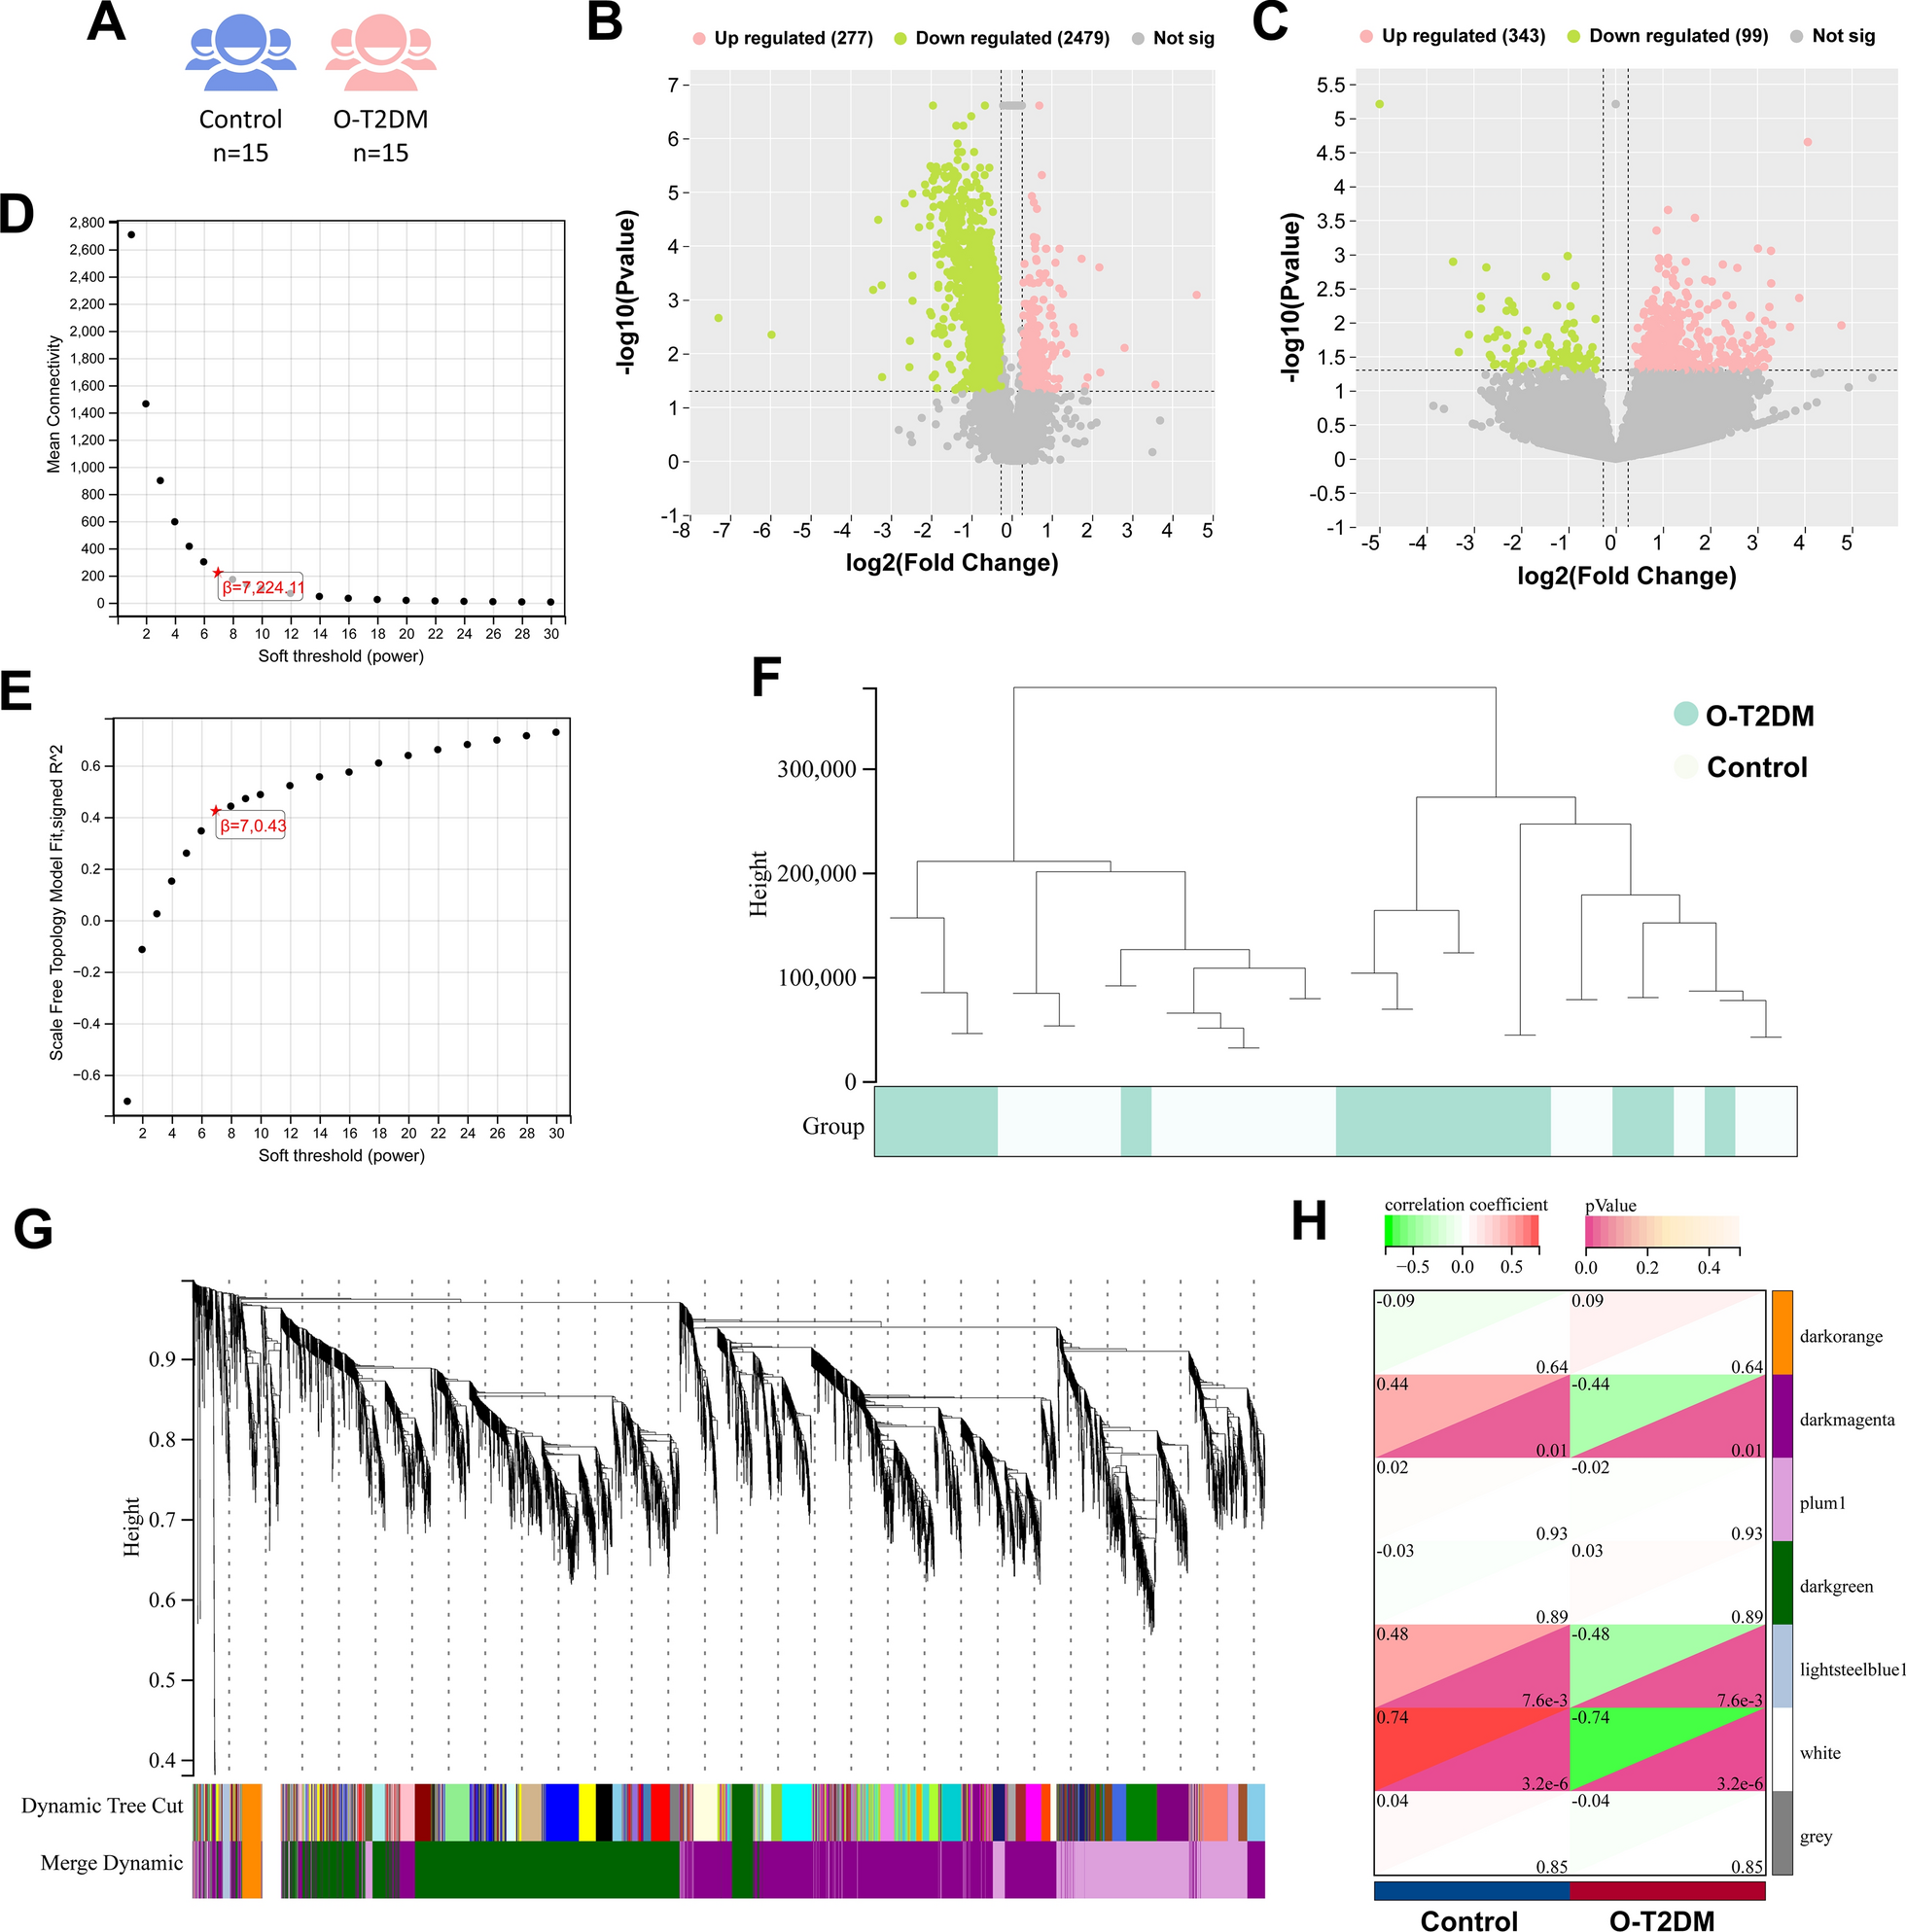
The DESeq2 (version 1.20.0) [26, 27] was used to analyze the differentially expressed mRNAs and circRNAs. RNAs with FC > 1.2 or < 0.833 and pvalue < 0.05 [28] were identified as differentially expressed.
Weighted gene co-expression network analysis
We constructed a co-expression network using WGCNA from the R package [29]. This is a scale-free network construction method that identifies gene clusters with highly correlated expression profiles. By transforming the correlation matrix into an adjacency matrix, we estimate Pearson correlation coefficients among genes according to FPKM values of genes, and then evaluate weighted co-expression relationships among all genes in the adjacency matrix. All genes were clustered by hierarchical clustering and dynamic tree cutting function detection module. To obtain high reliability of the results, the minimum number of genes was set to 30, the sensitivity was set to 3.0, and the module merging threshold was set to 0.25 to generate gene modules. Gene significance (GS) and module membership (MM) are calculated to correlate modules with phenotypic data. MM threshold was set to 0.8 and GS threshold was set to 0.1 to extract the information of corresponding module genes for further analysis [30].
Pathway enrichment analysis
Metascape (https://metascape.org/) database was used to perform pathway enrichment analysis to determine the underlying molecular mechanisms of selected genes. For analysis purposes, we use R to delineate important KEGG pathways according to p-values. Genset enrichment analysis (GSEA) is used to determine whether a defined set of genes shows significant consistent differences between two sample groups. GSEA was performed using GSEA software 2.2.1 (http://www.broadinstitute.org/gsea) [31] and the gene set for C2 was obtained from the molecular signature database v5.2 (http://software.broadinstitute.org/gsea/msigdb).
Construction of circRNA–miRNA–mRNA regulatory network
Certain circRNAs can function as competing endogenous RNAs (ceRNAs) for miRNAs. Candidate circRNAs for constructing circRNA–miRNA–mRNA networks were derived from the differentially expressed circRNAs selected above. RNA Interactomes Encyclopedia of RNA Interactomes (ENCORI, http://starbase.sysu.cn/index.php) was used to predict miRNA binding sites for candidate circRNAs, and these predicted miRNAs constitute candidate miRNAs for circRNA–miRNA–mRNA networks. TargetScan [32], miRDB [33], and miRWalk [34] were then used to predict mRNA targets for candidate miRNAs. The predicted mRNA targets are intersected with the differential mRNAs screened in the above experimental studies to obtain candidate mRNAs of the circRNA–miRNA–mRNA network. Cytoscape software (V3.10.0) was employed to visualize the network, construct the circRNA–miRNA–mRNA network, and conduct data analysis through the application of Network Analyzer and CytoNCA.
Real-time quantitative PCR, RT-qPCR
RT-qPCR was used to verify core RNA expressions in the circRNA–miRNA–mRNA network. Total RNA was extracted from two sample groups and reverse transcribed into cDNA as per the manufacturer’s instructions. Reverse transcription for circRNA and mRNA was done using kit No. G3337, while miRNA reverse transcription employed the A-tail method with kit No. AG11716. CircRNA, mRNA, and miRNA cDNA were prepared following the kit instructions. Amplification was performed on a fluorescence quantitative PCR instrument with the following settings: Stage 1: 95 °C for 30 s; Stage 2 (40 cycles): 95 °C for 20 s, 60 °C for 30 s; Stage 3 (melting curve): 65 °C to 95 °C. Fluorescence signals were collected every 0.5 °C. CT values were obtained at the end of the cycle. β-actin served as the internal reference for circRNA and mRNA, while U6 was used for miRNA. Relative expression levels were calculated using the 2 −△△Ct method (primer sequences in Table 1).
Table 1 Primer sequencesStatistical methods
SPSS 20.0 (SPSS, Inc., Chicago, IL, USA) software, and the measurement data were expressed as x ± s. The measurement data that met the normality were analyzed for significant differences using one-way analysis of variance, and the measurement data that did not meet the normality were analyzed for significant differences using the Kruskal Wallis nonparametric test. The Chi-square test was used for frequency distribution data. P < 0.05 was considered statistically significant.

留言 (0)