
記住我
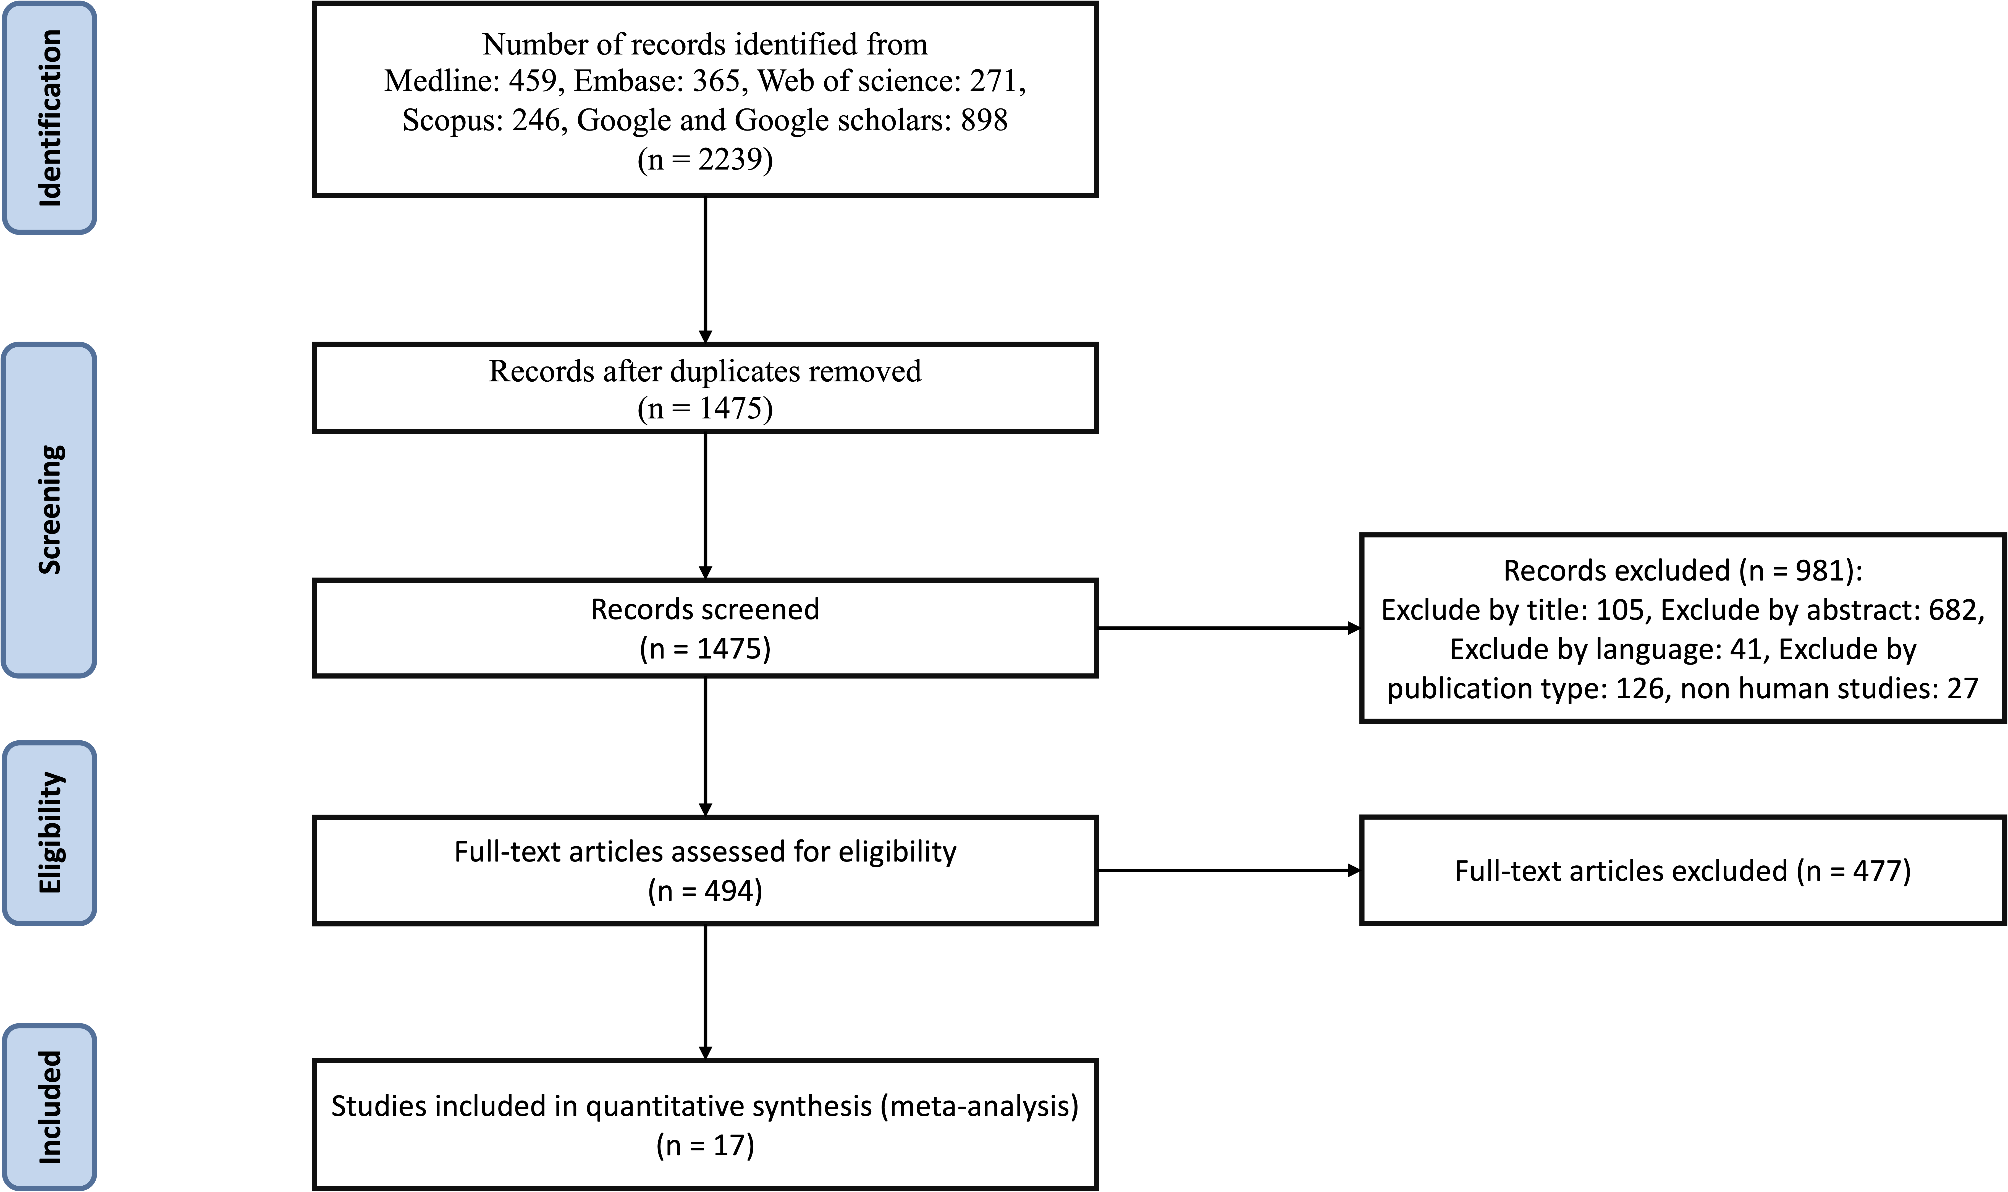
This retrospective cohort study was conducted in accordance with the Declaration of Helsinki and approved by the Ethics Committee of Henan Provincial People’s Hospital (Approval Code: 2021-68). The requirement for informed consent was waived by the ethics committee due to the retrospective nature of the study and the use of de-identified data. We analyzed data from adult patients with T2DM who underwent regular annual health examinations at the Health Management Center of Henan Provincial People’s Hospital between January 2018 and December 2023. These examinations were conducted as part of corporate health programs, ensuring systematic and standardized data collection. All patient data were anonymized before analysis. All participants were diagnosed without incident CAC by coronary CT during their first examination. Exclusion criteria included: absence of coronary CT in follow-up examinations; less than six months between two health examinations; patients with heart disease, including coronary artery disease, congenital heart disease, or previous cardiac surgery; history of any form of cancer; mental or cognitive disorders in women; immobility; pregnant or breastfeeding women; use of antiplatelet drugs; missing lipid profile data; and incomplete or extreme values in other laboratory indicators. Ultimately, 2,631 participants were selected for the final analysis, with 1,746 participants free of CAC at the end of the follow-up period and 885 participants experiencing incident CAC. General demographic information, medical history, and medication history of the participants were collected through face-to-face interviews by professional researchers. The specific case selection flowchart is shown in Fig. 1.
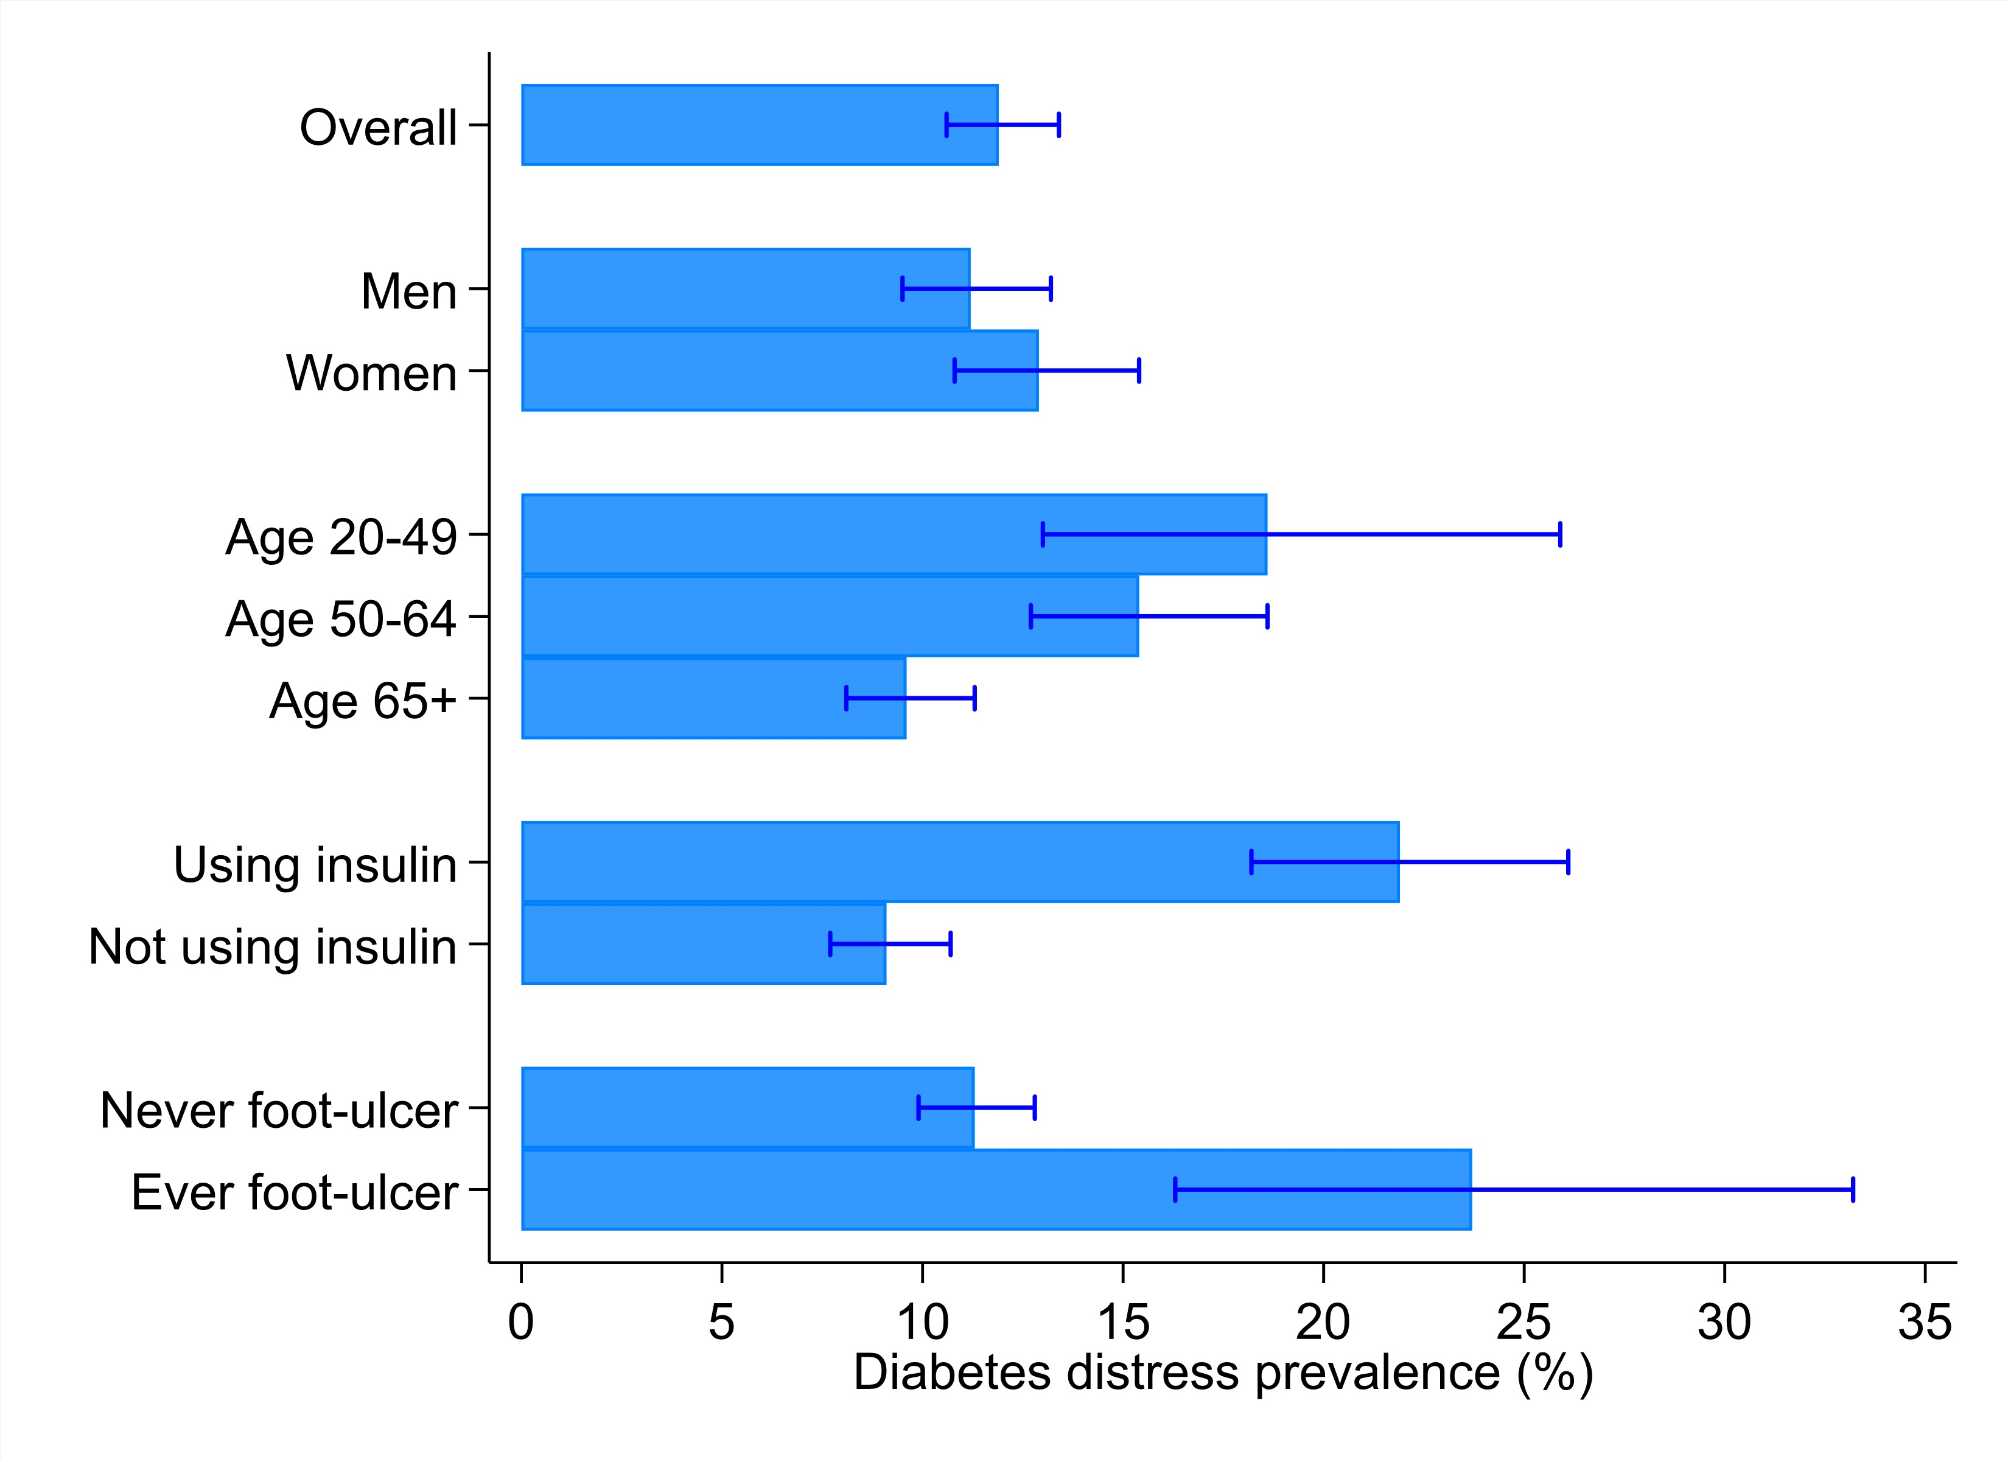
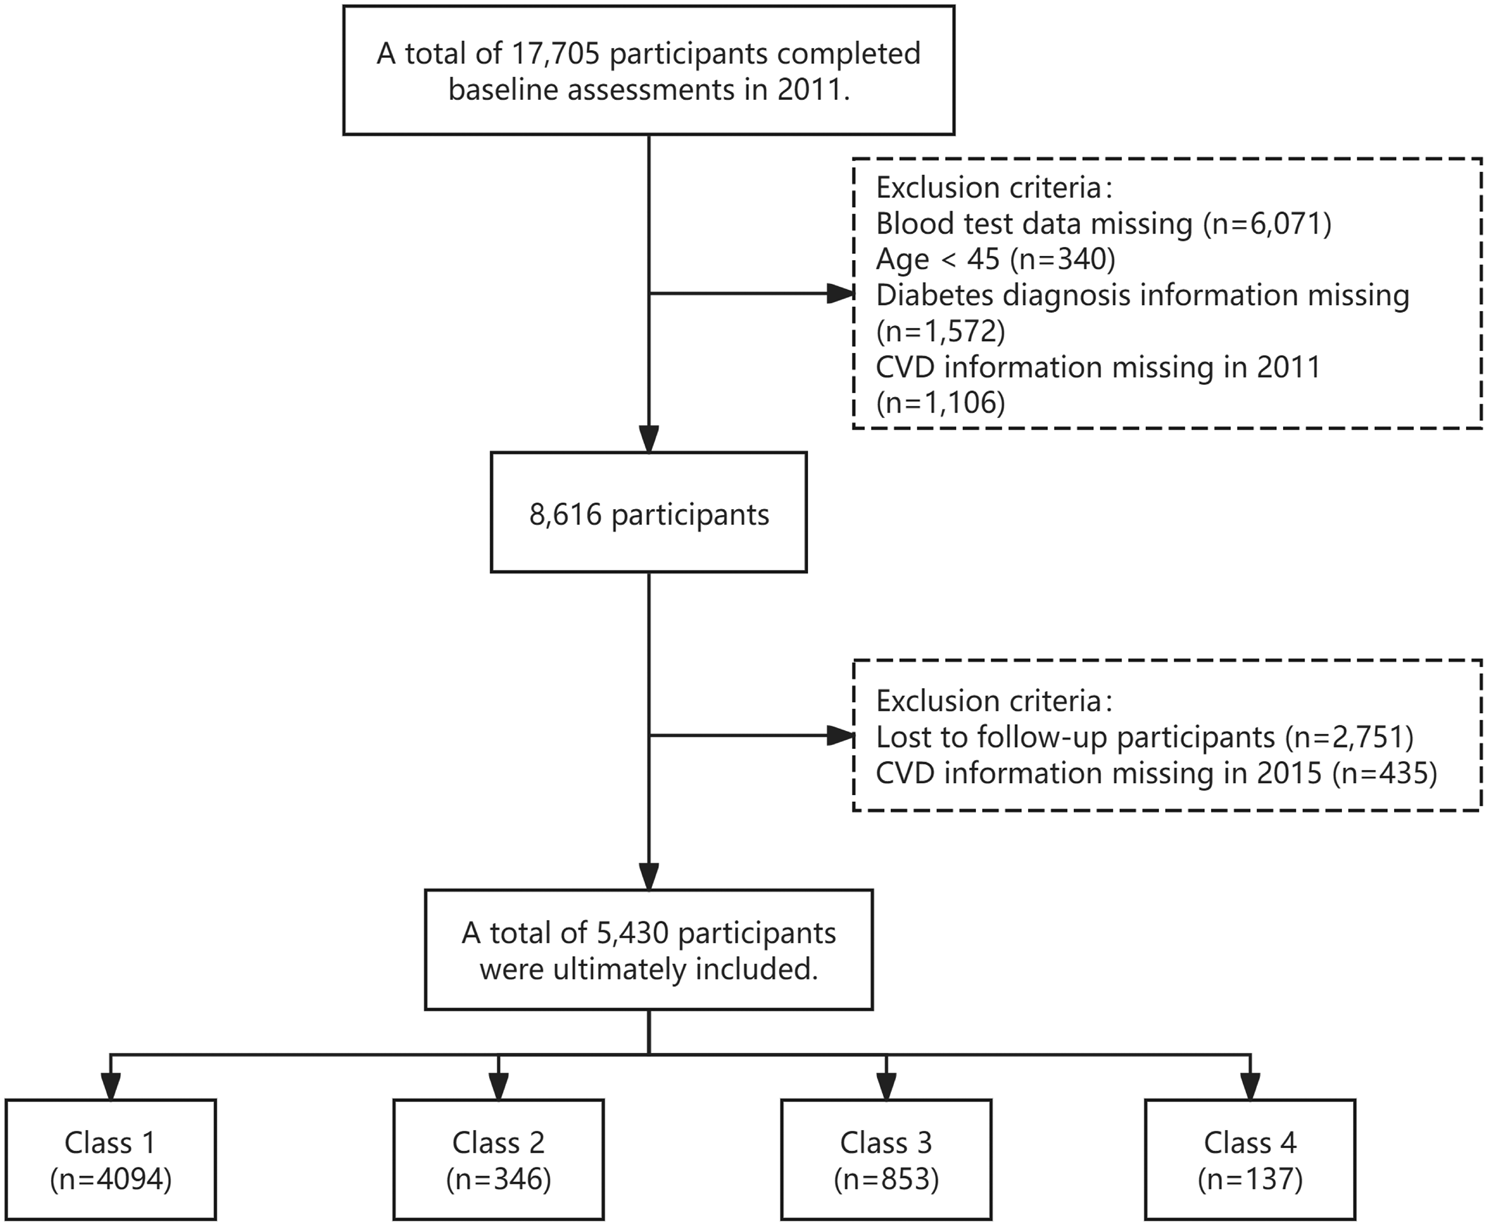
Fig. 1
Flowchart of participants selection
Definition of variablesThe diagnosis of T2DM was based on the American Diabetes Association criteria [13]: a previous physician diagnosis of diabetes or current treatment with hypoglycemic medications, or fasting plasma glucose ≥ 7.0 mmol/L, or glycosylated hemoglobin (HbA1c) level ≥ 6.5%, or 2-hour oral glucose tolerance test (OGTT) blood glucose ≥ 11.1 mmol/L, or use of insulin or oral hypoglycemic agents. Asymptomatic specifically refers to the absence of cardiac symptoms (such as chest pain or shortness of breath) at baseline, rather than the absence of all diabetes-related complications. All participants underwent comprehensive health examinations at our Health Management Center, which included standardized clinical assessments and laboratory tests.
Hypertension was defined as a systolic blood pressure (SBP) ≥ 140 mmHg or diastolic blood pressure (DBP) ≥ 90 mmHg on two consecutive measurements, self-reported hypertension, taking antihypertensive medication, or undergoing antihypertensive treatment [14]. Hypotension was defined as SBP ≤ 90 mmHg or DBP ≤ 60 mmHg. Blood pressure within these ranges was considered normal.
All T2DM patients were categorized into three groups based on LDL-C levels: T1 (0.66–2.43 mmol/L), T2 (2.44–3.18 mmol/L), and T3 (3.19–7.21 mmol/L).
Current smoking was defined as self-reported smoking by the participants. Current drinking was defined as consuming at least one alcoholic beverage per week in the 12 months before the health examination.
Laboratory measurementsAll researchers received standardized training to ensure impartiality and accuracy. Before the examination, researchers used standardized questionnaires to collect necessary information from all participants, including medical history, such as current diabetes, history of various cancers, heart surgeries, and current medications. After completing the questionnaires, researchers organized, summarized, and verified the data.
Venous blood samples were collected from all participants at 8 a.m. after an overnight fast to measure various biochemical markers, including total protein, total bilirubin, alanine aminotransferase (ALT), aspartate transaminase (AST), glutamyl transpeptidase (GGT), creatinine, uric acid, total cholesterol (TC), LDL-C, triglycerides (TG), high-density lipoprotein cholesterol (HDL-C), fasting plasma glucose, and HbA1c. Blood glucose levels were measured using the Olympus® AU 5400 automatic biochemical analyzer (Olympus Corporation, Shizuoka, Japan). Other indicators were assessed following standard laboratory procedures.
SBP and DBP were measured by researchers using an electronic sphygmomanometer (OMRON U30, Omron Corporation, Kyoto, Japan) with the right arm in a semi-flexed position at heart level.
Study endpoints and definitionsThe primary endpoint was the occurrence of an incident CAC more than six months after the baseline health screening. All coronary CT examinations were performed as part of a standardized cardiovascular risk assessment protocol in our corporate health examination program. These examinations were conducted based on clinical indications and standardized protocols, not individual requests.
All scans were performed using 256-slice CT scanners with radiation dose optimization following the ALARA (As Low As Reasonably Achievable) principle, ensuring minimal radiation exposure while maintaining diagnostic image quality. The mean effective radiation dose was 2.4 ± 1.4 mSv, which is within the recommended range for coronary CTA examinations. Incident CACs were determined by coronary CT results. The scan results were independently read at a centralized reading center, and the calcification amount was quantified using the Agatston scoring method by imaging radiologists [15]. An Agatston score of 0 was defined as without incident CAC, indicating no detectable calcified deposits in the coronary arteries. An Agatston score greater than 0 was defined as having incident CAC.
All incident CACs were judged and confirmed by an independent imaging radiologist using predefined criteria and then reviewed and confirmed by another senior imaging radiologist who was blinded to the study. Any discrepancies were resolved by consulting a third, more experienced senior imaging radiologist. If a participant had consecutive examinations showing incident CAC, the time of the first occurrence was recorded.
Statistical analysisAll statistical analyses were performed using R version 4.2.0 (R Foundation) and EmpowerStats (http://www.empowerstats.com, X&Y Solutions, Inc., Boston, MA). All statistical tests were two-tailed with a significance level of P < 0.05.
Normality tests were conducted on all datasets to assess continuous variables. Normally distributed continuous variables were described as mean ± standard deviation, while skewed continuous variables were presented as median (interquartile range). Group differences for continuous variables were evaluated using t-tests or rank-sum tests. Categorical variables were expressed as frequencies and percentages, and comparisons were conducted using chi-square tests or Fisher’s exact tests. Kaplan-Meier survival curves were employed to illustrate the occurrence of incident CAC during follow-up among different LDL-C groups, with comparisons made using the log-rank test. The variance inflation factor (VIF) was calculated to detect multicollinearity among variables in the model, with VIF < 10 indicating no multicollinearity. Univariate and multivariate Cox proportional hazards regression models were used to examine the association between LDL-C and CAC, providing hazard ratios (HR) and 95% confidence intervals (CI). The univariate Cox model explored relationships between various variables and CAC risk, while the multivariate Cox model assessed the relationship between LDL-C levels and incident CAC after adjusting for demographic factors (sex, age, ethnic group), lifestyle factors (current smoking, current drinking, BMI), medical conditions and medications (hypertension status, antidiabetic medications, statins), and laboratory parameters (total protein, total bilirubin, ALT, AST, GGT, creatinine, uric acid). Subgroup analyses investigated the association between LDL-C and incident CAC across different subgroups, including sex, age, BMI, blood pressure status, hypertension treatment, diabetes medications, and statin use. Interaction P-values were determined using the multivariate Cox regression model. All analyses were based on baseline participant data.
留言 (0)