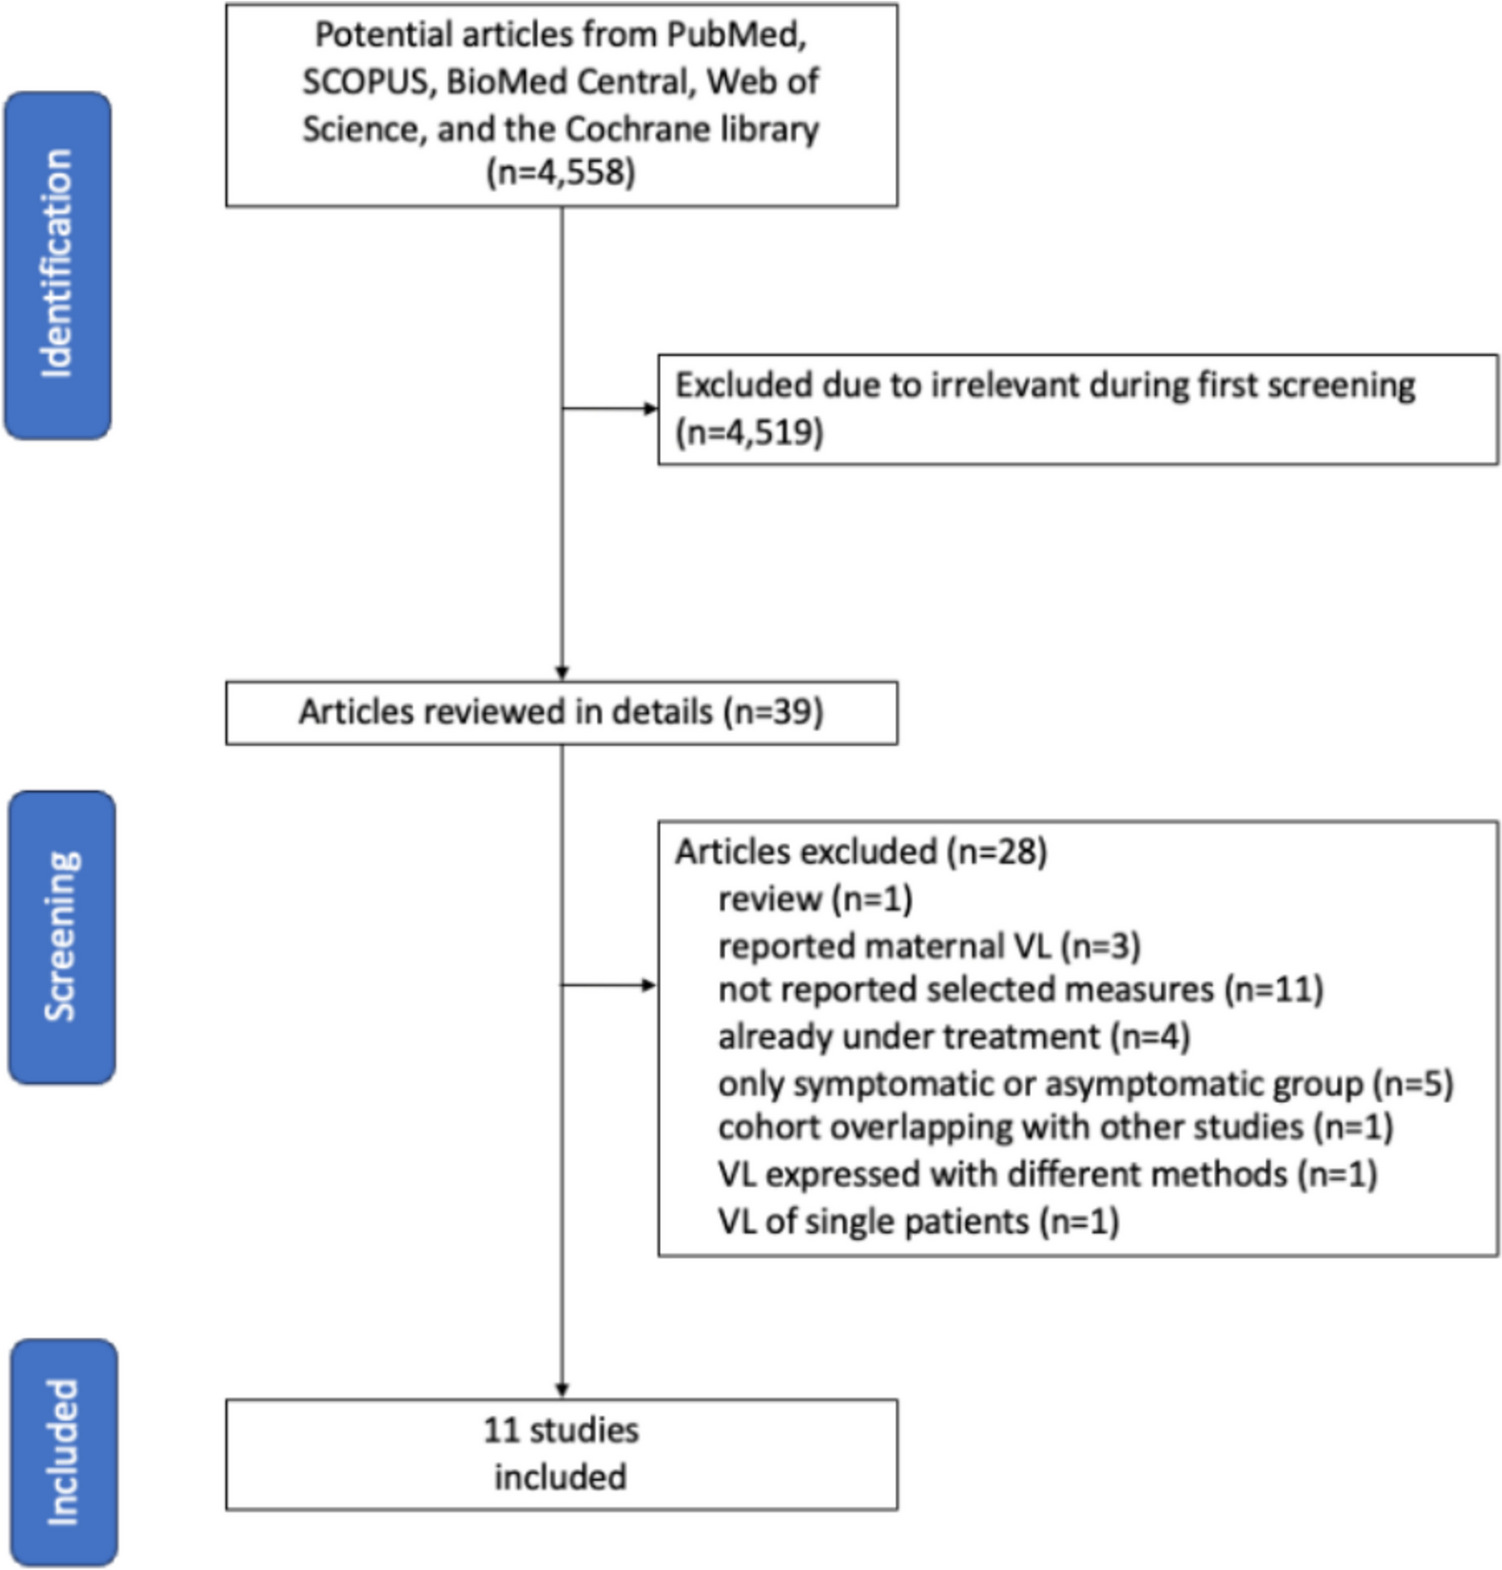
The investigation was performed according to the Preferred Reporting Items for Systematic Reviews and Meta-Analysis (PRISMA) guidelines [16]. Before starting the project, we developed a systematic review protocol, including the choice of databases to be searched, search terms, eligibility criteria, and data to be extracted. Methods to aggregate data and to solve any dispute were also decided. We registered the protocol in the International Prospective Register of Systematic Reviews (ID No. CRD42024537242). The protocol can be accessed by the following link: https://www.crd.york.ac.uk/prospero/display_record.php?RecordID=537242. In addition, it has been also registered on protocols.io as follows: dx.doi.org/https://doi.org/10.17504/protocols.io.14egn61qml5d/v1.
Institutional Review Board approval is not required for this type of studies.
Studies were selected according to the following criteria.
Eligibility criteria
We retrieved all English-language research articles reporting evaluation of viral load in biological samples at time of diagnosis in infants with congenital CMV infection. Moreover, patients should be defined according the severity at birth with classification criteria explicitly reported. Considering that this definition was not overlapping through different articles in past years, we accepted the recent definition of the European Consensus, where isolated SNHL is included in the symptomatic onset, as summarized in Table 1 [17].
Table 1 Symptoms and signs of infants with cCMV [17]We selected studies reporting data about viral load in biological samples at time of diagnosis. CMV viral loads can be expressed both in copies per milliliter (cp/mL) or genome equivalents per milliliter (ge/mL) and international units per milliliter (IU/mL) with a conversion factor of 1 [18]. For this reason, studies expressing viral load in both measurements were included. Articles describing viral load on biological samples of children treated with antivirals at the time of sample collection were excluded because the therapy reduces viral load [7].
Viral load in children with symptomatic infection at onset was compared with those with asymptomatic infection. It could be described as median or mean in symptomatic and asymptomatic groups.
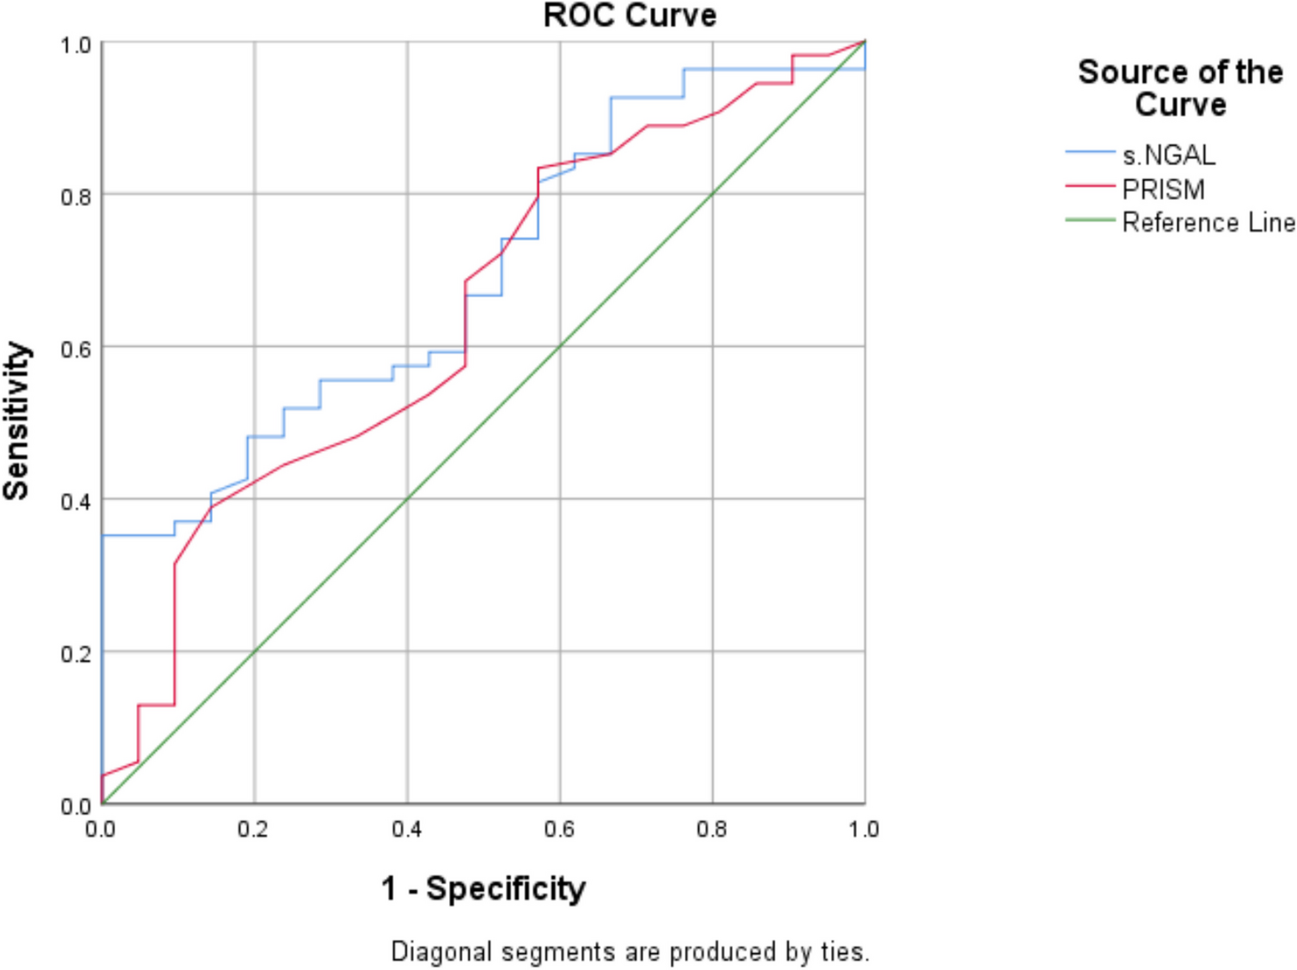
Our outcome was to test the accuracy of viral load in different biological samples to differentiate symptomatic and asymptomatic infection in children with cCMV.
The databases PubMed, SCOPUS, BioMed Central, Web of Science, and the Cochrane library were searched until August 2024. We decided not to select a starting time for searching because it was difficult to establish a specific moment when CMV DNA was evaluated in cCMV.
The above databases were searched using keywords: congenital (AND) cytomegalovirus infection, congenital CMV infection. The addition of “viral load” to keywords reduced evaluable studies because not all expressed in the title these measurements. Reference lists of included articles were scanned for any additional eligible studies.
We excluded unpublished or non-peer-reviewed reports. Moreover, we excluded review papers, case reports due to likely reporting bias, and papers in which only symptomatic or asymptomatic infants were described, due to a not possible compare of the two groups in the same population enrolled.
Two reviewers (SS and RG) independently selected eligible abstracts and verified the acceptability of the full studies. Three authors (SS, RG, and PD) extracted data and assessed risk of publication bias (as reported in details in the statistical section). Any disagreements regarding grading of quality were resolved through discussion with a third author (FR). Results were compared and discussed among all the authors and controversies were resolved by discussion.
Data were extracted using a standardized form derived from the Cochrane data collection template and reported in a Microsoft Excel (Microsoft, 2013) spreadsheet. The following data were extracted from the study; author, year of publication, number of children included and number of symptomatic and asymptomatic infants at birth, type of biological sample used for viral load evaluation, viral load in symptomatic and asymptomatic group expressed as median or media value, minimum, max and first and third quartile, and p-value.
The methodological quality of the eligible studies was independently assessed by two reviewers using the Quality Assessment of Diagnostic Accuracy Studies 2 (QUADAS-2) tool [19]. The risk of bias was classified as low, high, or unclear. Any discrepancies between the investigators in the quality assessment will be documented and discussed until achieving a consensus. All eligible studies were considered for the meta-analysis, regardless of their quality, and assessed for risk of bias.
Statistical analysis
Quantitative variables were expressed as median and interquartile range (IQR: Q1-Q3). The viral load was expressed as CMV PCR (copies/mL or IU/mL). For a limited number of studies [20, 21], where results were presented as mean and standard deviation, medians and IQR were calculated assuming the normality of the variable. Median differences will be used for comparisons between groups.
Pooled estimates of median differences were calculated through a median-based meta-analysis approach, using the quantile matching estimation technique as proposed by McGrath et al. [22]. Median differences and their 95% confidence intervals will be presented using forest plots. Heterogeneity among studies was evaluated using Cochran's Q test and by Higgins and Thompson I2 statistic. Heterogeneity was categorized as low for I2 values below 25%, moderate for values between 25 and 50%, and high for values above 50%.
Publication bias was assessed by inspecting funnel plots for visual asymmetry, positioning comparison-specific effect sizes against their standard errors. Additionally, Egger’s regression test was applied to assess the asymmetry of funnel plots, aiming to determine the statistical significance of the relationship between effect sizes and their corresponding standard errors.
All statistical analyses were conducted using R statistical software. The “metamedian” R package [23] was used for meta-analysis.
Authors assessed each study sampling strategy, representativeness, comparability of the samples, and use of comparable methods of analysis. If applicable, authors could be contacted to clarify unclear or missing observations, data, or outcomes.
The strength of the body of evidence was assessed as follows. For the interpretation of the study contribution to the findings, reference was made to the prior assessment of the included studies’ methodological quality. Moreover, consistency and inconsistency across findings were assessed and any incoherent or contradictory evidence was highlighted and discussed. In addition, GRADE or CERQual approaches were employed for standardized assessment of cumulative evidence quality (as shown in Tables 2 and 3).
Table 2 Quality of the evidence (GRADE) for viral load in bloodTable 3 Quality of the evidence (GRADE) for viral load in urine


留言 (0)