
記住我
Due to the increase in obesity, sedentary lifestyle, high-energy diet, and population aging (1), the prevalence of diabetes is rising rapidly worldwide, exerting adverse with a major impact on the lives and well-being of individuals, families, and societies worldwide. By 2019, close to 0.5 billion people were living with diabetes globally, and this number is expected to increase by 25% by 2030 (2). In addition, half (50.1%) of diabetic patients are unaware of diabetes, and this part of the population has a greater risk of diabetic complications (3). Asia has been experiencing a rapidly growing T2DM epidemic, with China and India being the two major centers in Asia (4). Diabetes and its related complications (such as kidney failure, peripheral arterial disease, cardiovascular disease, and infection, etc.) have a serious effect on people’s quality of life and require a large amount of health services, which greatly aggravates the social burden.
Obesity jeopardizes public health worldwide, and has become the fifth leading cause of death worldwide (5) and the leading cause of preventable death in China (6). According to the latest estimates, nearly 14% of men and 20% of women in the world’s population (over 1 billion people in all) will be obese by 2030 (7). Obesity is now recognized as a chronic, recurrent and multifactorial disease and also as a major risk factor for non-communicable diseases (8). Obesity can cause complications through anatomical and metabolic effects, such as obstructive sleep, diabetes, cardiovascular disease (CVD), non-alcoholic fatty liver disease (NAFLD), and tumor, the multi-organ impairment and disease burden caused by these diseases may become irreversible without timely intervention (9, 10). Obesity is a major risk factor for T2DM, and weight gain and obesity are significantly associated with diabetes incidence (11). Therefore, an effective and accurate obesity assessment parameter is essential to identifying individuals at high risk of diabetes and preventing diabetes.
Body mass index (BMI) and waist circumference (WC) are the most commonly used indexes to evaluate obesity, and accumulated data have shown that they are closely related to the increased prevalence of diabetes. However, those indexes can’t fully reflect the characteristic of obesity, such as the difference between muscle mass and fat mass, between central fat and peripheral fat, and between subcutaneous fat and visceral fat (12–14). Therefore, these traditional measures may not accurately reflect the relationship between obesity and diabetes risk. Quantitative measurements of body composition can be achieved by imaging methods such as computed tomography (CT) or magnetic resonance imaging (MRI), but those methods increase exposure to ionizing radiation and are relatively limited in clinical practice (15). Park et al. (16) proposed a new obesity indicator called “weight-adjusted-waist index (WWI)” in 2018. WWI combines the advantages of WC while diluting the correlation with BMI. Therefore, WWI mainly reflects central obesity (17). Several studies have demonstrated an association between WWI and hypertension, heart failure, hyperuricemia, kidney stones, depression, and all-cause and cardiovascular mortality (16, 18–24).
Previous studies have shown a positive correlation between WWI and the prevalence of T2DM in U.S. and Japan (25–27); however, the relationship between WWI and the prevalence of T2DM in the general adult population in large-sample urban China has not been explored. Therefore, this study aims to further investigate the relationship between WWI and T2DM through a multi-center and large-sample epidemiological survey of Chinese urban adults.
2 Methods2.1 Study populationThe study population was drawn from the REACTION (Risk Evaluation of Cancers in Chinese Diabetic Individuals) study designed to research the correlation of diabetes and prediabetes with the risk of cancer in the Chinese population based on the community. In 2011-2012, 53, 639 participants from eight regional centers (Dalian, Lanzhou, Zhengzhou, Guangzhou, Guangxi, Luzhou, Shanghai, and Wuhan) participated in the study and signed the informed consent form. The subjects of the study were permanent adult residents from 3 to 5 communities randomly sampled in the city.
Inclusion and exclusion criteria (1): Inclusion criteria: individuals aged >18 years old, without restrictions on gender proportion, having good compliance (being objective and sincere for questionnaires, and being able to accept regular follow-up) (2). Exclusion criteria: individuals diagnosed with end-stage renal disease or severe liver dysfunction (n=245); Participants with a history of mental illness or advanced malignant tumor (n=176); Participants aged ≤18 years old (n=381), lacking important data such as height, weight, WC, systolic blood pressure (SBP), diastolic blood pressure (DBP), glycated hemoglobin (HbA1c), fasting blood glucose (FBG), postprandial blood glucose (PBG), smoking status, or drinking status (n=1, 859). A total of 50, 978 participants were included (Figure 1).
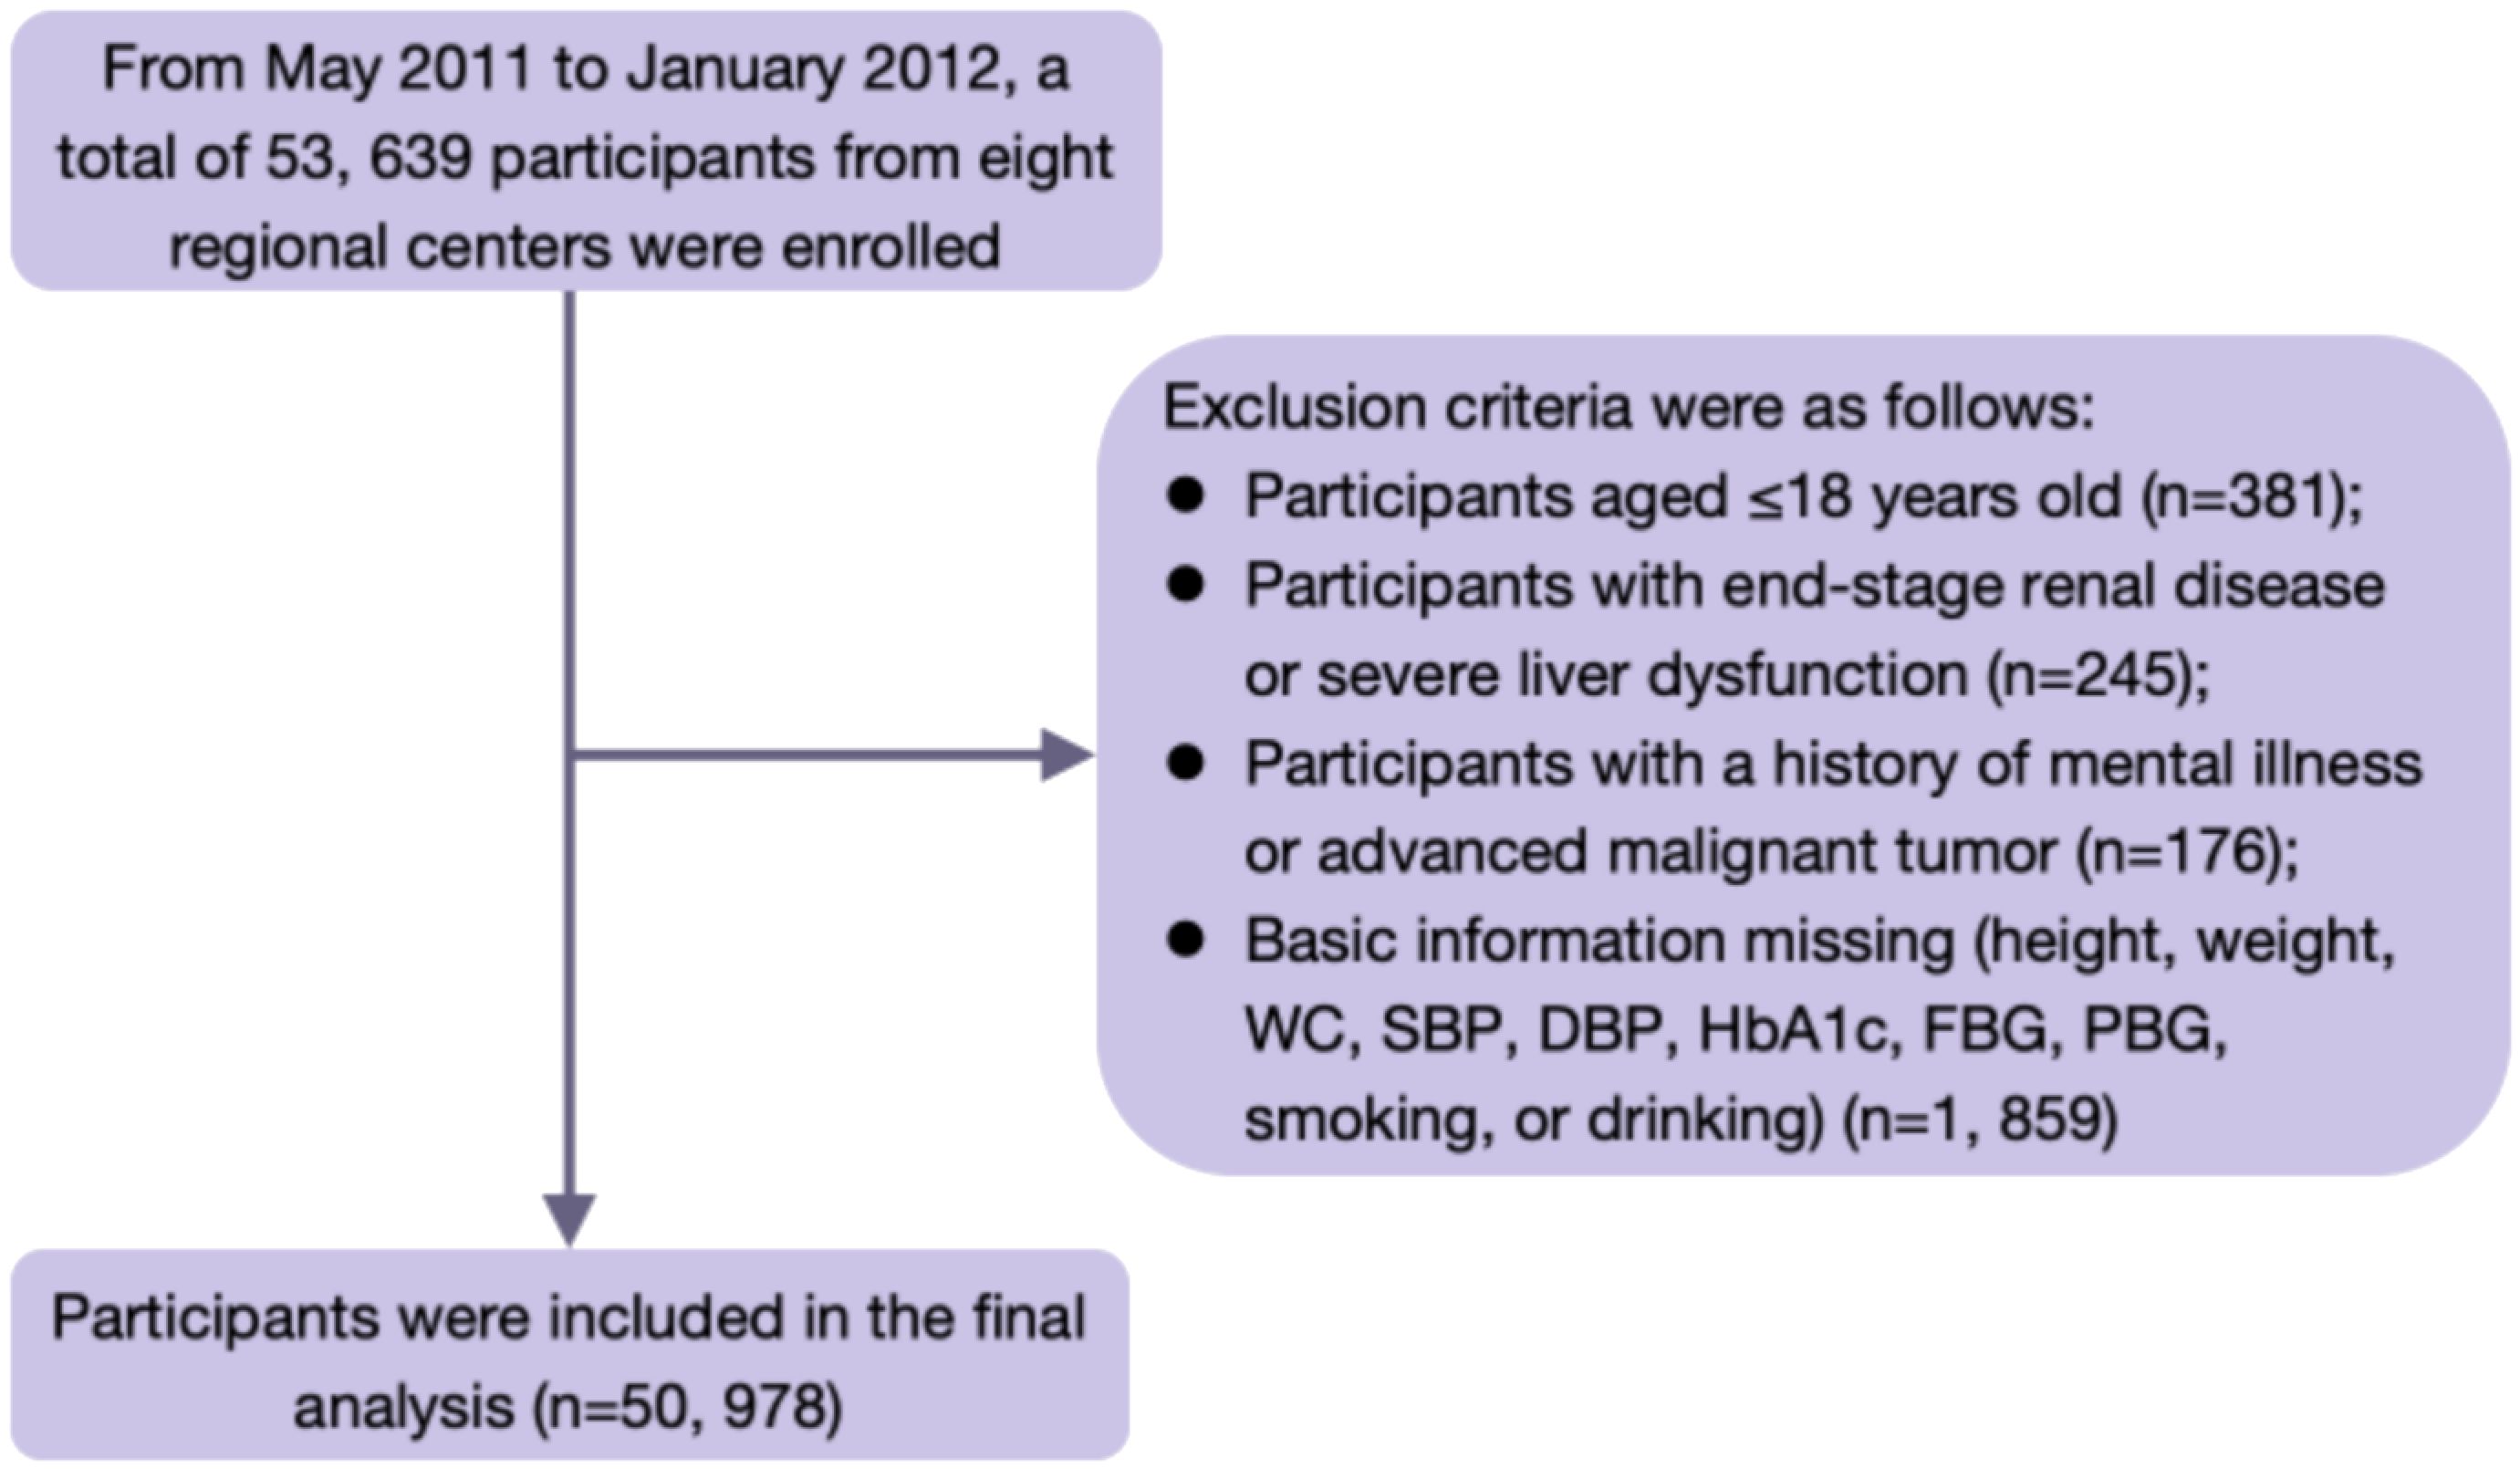
Figure 1. Flow chart of the study population.
2.2 Data collectionA standardized questionnaire was used by trained staff and nurses to collect basic information, medical history, medication history and lifestyle information. Height, weight and WC were measured in a standard standing position, wearing light clothing and no shoes, and recorded to 2 decimal places. WC was defined as the abdominal circumference at the lower margin of the ribs and the midpoint of the sacral line. BMI was calculated as weight divided by the square of height (kg/m2); waist-to-hip ratio (WHR) was calculated as waist circumference divided by hip circumference; and waist-to-height ratio (WHtR) was calculated as waist circumference divided by height. Blood pressure was measured in a standard sitting position, and patients were asked to rest for at least 5 min before measurement. Three measurements were taken every 5 minutes, and the average value was used for statistical analysis.
2.3 Laboratory measurementsBlood samples were collected early in the morning after fasting for at least 10 hours. Patients without diabetes underwent a 75 g glucose tolerance test, and venous blood was drawn at 0 minute and 120 minutes. Biochemical indicators included FBG, PBG, total cholesterol (TC), serum triglyceride (TG), high-density lipoprotein cholesterol (HDL-C), low-density lipoprotein cholesterol (LDL-C), alanine aminotransferase (ALT), aspartate aminotransferase (AST), fasting insulin and HbA1c, serum creatinine (CREA), etc. The estimated glomerular filtration rate (eGFR) was estimated using the CKD-EPI formula updated by lnker et al. (28) in 2021. Fasting plasma insulin levels were measured by glucose oxidase-peroxidase method. Mid-morning clean urine was collected for urinary albumin/creatinine ratio (UACR) determination.
2.4 Variable definitionOverweight was defined as BMI ≥24kg/m2, obesity was defined as BMI ≥28kg/m2, central obesity was defined as male: WC ≥90cm; Female: WC ≥85cm. Hypertension was defined as self-reported hypertension and/or mean systolic/diastolic blood pressure ≥140/90mmHg over three measurements. Diabetes was defined as self-reported diabetes and/or newly diagnosed diabetes (FBG ≥7.0mmol/L and/or PBG ≥11.1mmol/L and/or HbA1c ≥6.5%). Hyperlipidemia was defined as self-reported hyperlipidemia and/or TC ≥6.2mmol/L and/or TG ≥2.3 mmol/L and/or LDL-C ≥4.1mmol/L. WWI were calculated as WC divided by the square root of weight (cm/kg). All subjects were divided into three groups according to the tertiles of WWI: T1 (≤10.47), T2 (10.48-11.13), T3 (≥11.14).
2.5 Statistical analysisAll statistical analyses were performed using SPSS version 27.0 (IBM, Chicago, IL, USA). Study participants were divided into three groups based on the tertiles of WWI. Normally distributed continuous variables were expressed as mean ± standard deviation (SD), and non-normally distributed continuous variables were expressed as median (interquartile range). Categorical variables were expressed as frequencies and percentages. The χ2 test was used to calculate the comparison of count data between groups, with P <0.05 as the statistically significant difference. For measurement data normality analysis was performed firstly, and ANOVA was used for comparisons if they were met, and non-parametric tests were used if they were not. Some covariates had missing values, although the extent of missing data for each variable was less than 20%. These missing values were addressed through means of mean imputation and regression imputation. The variance inflation factor (VIF) was used to assess multicollinearity between predictor variables, with a threshold VIF value of less than 10 indicating the absence of multicollinearity, as shown in Supplementary Table S1. Pearson correlation analysis was used to examine the association between WWI and clinical risk factors of T2DM. Logistic regression was used to analyze the association between WWI and T2DM, and the odds ratio (OR) and 95% confidence interval (CI) were calculated. We developed three models. Model 1 was not adjusted for confounding factors. Model 2 was adjusted for age, sex, BMI, SBP, DBP, heart rate (HR), drinking status, and smoking status. Model 3 was adjusted for TG, LDL-C, HDL-C, ALT, AST, eGFR, CVD, and use of antihypertensive and lipid-lowering drugs based on model 2. In addition, we performed stratified analyses by age, sex, BMI, hypertension, and hyperlipidemia as follows: by age (<60 and ≥60 years old, representing the middle-aged and elderly population), sex (male and female), BMI (<24 kg/m2 and ≥24 kg/m2, representing normal weight or overweight/obesity), hypertension status, and hyperlipidemia status. All statistical tests were two-sided, and P <0.05 was considered statistically significant.
We performed several sensitivity analyses to evaluate the robustness of the results. First, considering potential biases, we excluded missing data from the dataset. In addition, considering the strong relationship between obesity and diabetes, we excluded participants with BMI ≥28kg/m2.
3 Result3.1 Clinical characteristics of the study populationA total of 50,978 participants were included in the analysis. All study subjects were divided into three groups based on the tertiles of WWI. Table 1 shows the baseline characteristics of the study population in the WWI tertiles and the comparison among the three groups with different WWI levels. The majority of the participants were women (68.6%), and most of them were middle-aged and elderly, with a median age of 57 years. Compared with participants in the T1 group, those in the T3 group were older, had higher values of SBP, DBP, BMI, WC, HC, WHR, WHtR, higher levels of TyG, HOMA-IR, FBG, PBG, HbA1c, fasting insulin, UACR, serum TC, TG, LDL-C, HDL-C, lower levels of eGFR and education, lower proportion of current smokers and alcohol drinkers (all P <0.001). In the total population, the prevalence of obesity, central obesity and T2DM was 14.2%, 46.9% and 11.0% respectively. With the increase of WWI tertiles, the prevalence of T2DM increased (P-trend <0.001). In addition, the prevalence of hypertension, hyperlipidemia, CVD and NAFLD also increased gradually with the higher WWI tertiles (P-trend <0.001). Moreover, participants in the T3 group had a higher proportion of medication use (antihypertensive, lipid-lowering, oral glucose-lowering and insulin) than those in the T1 group.
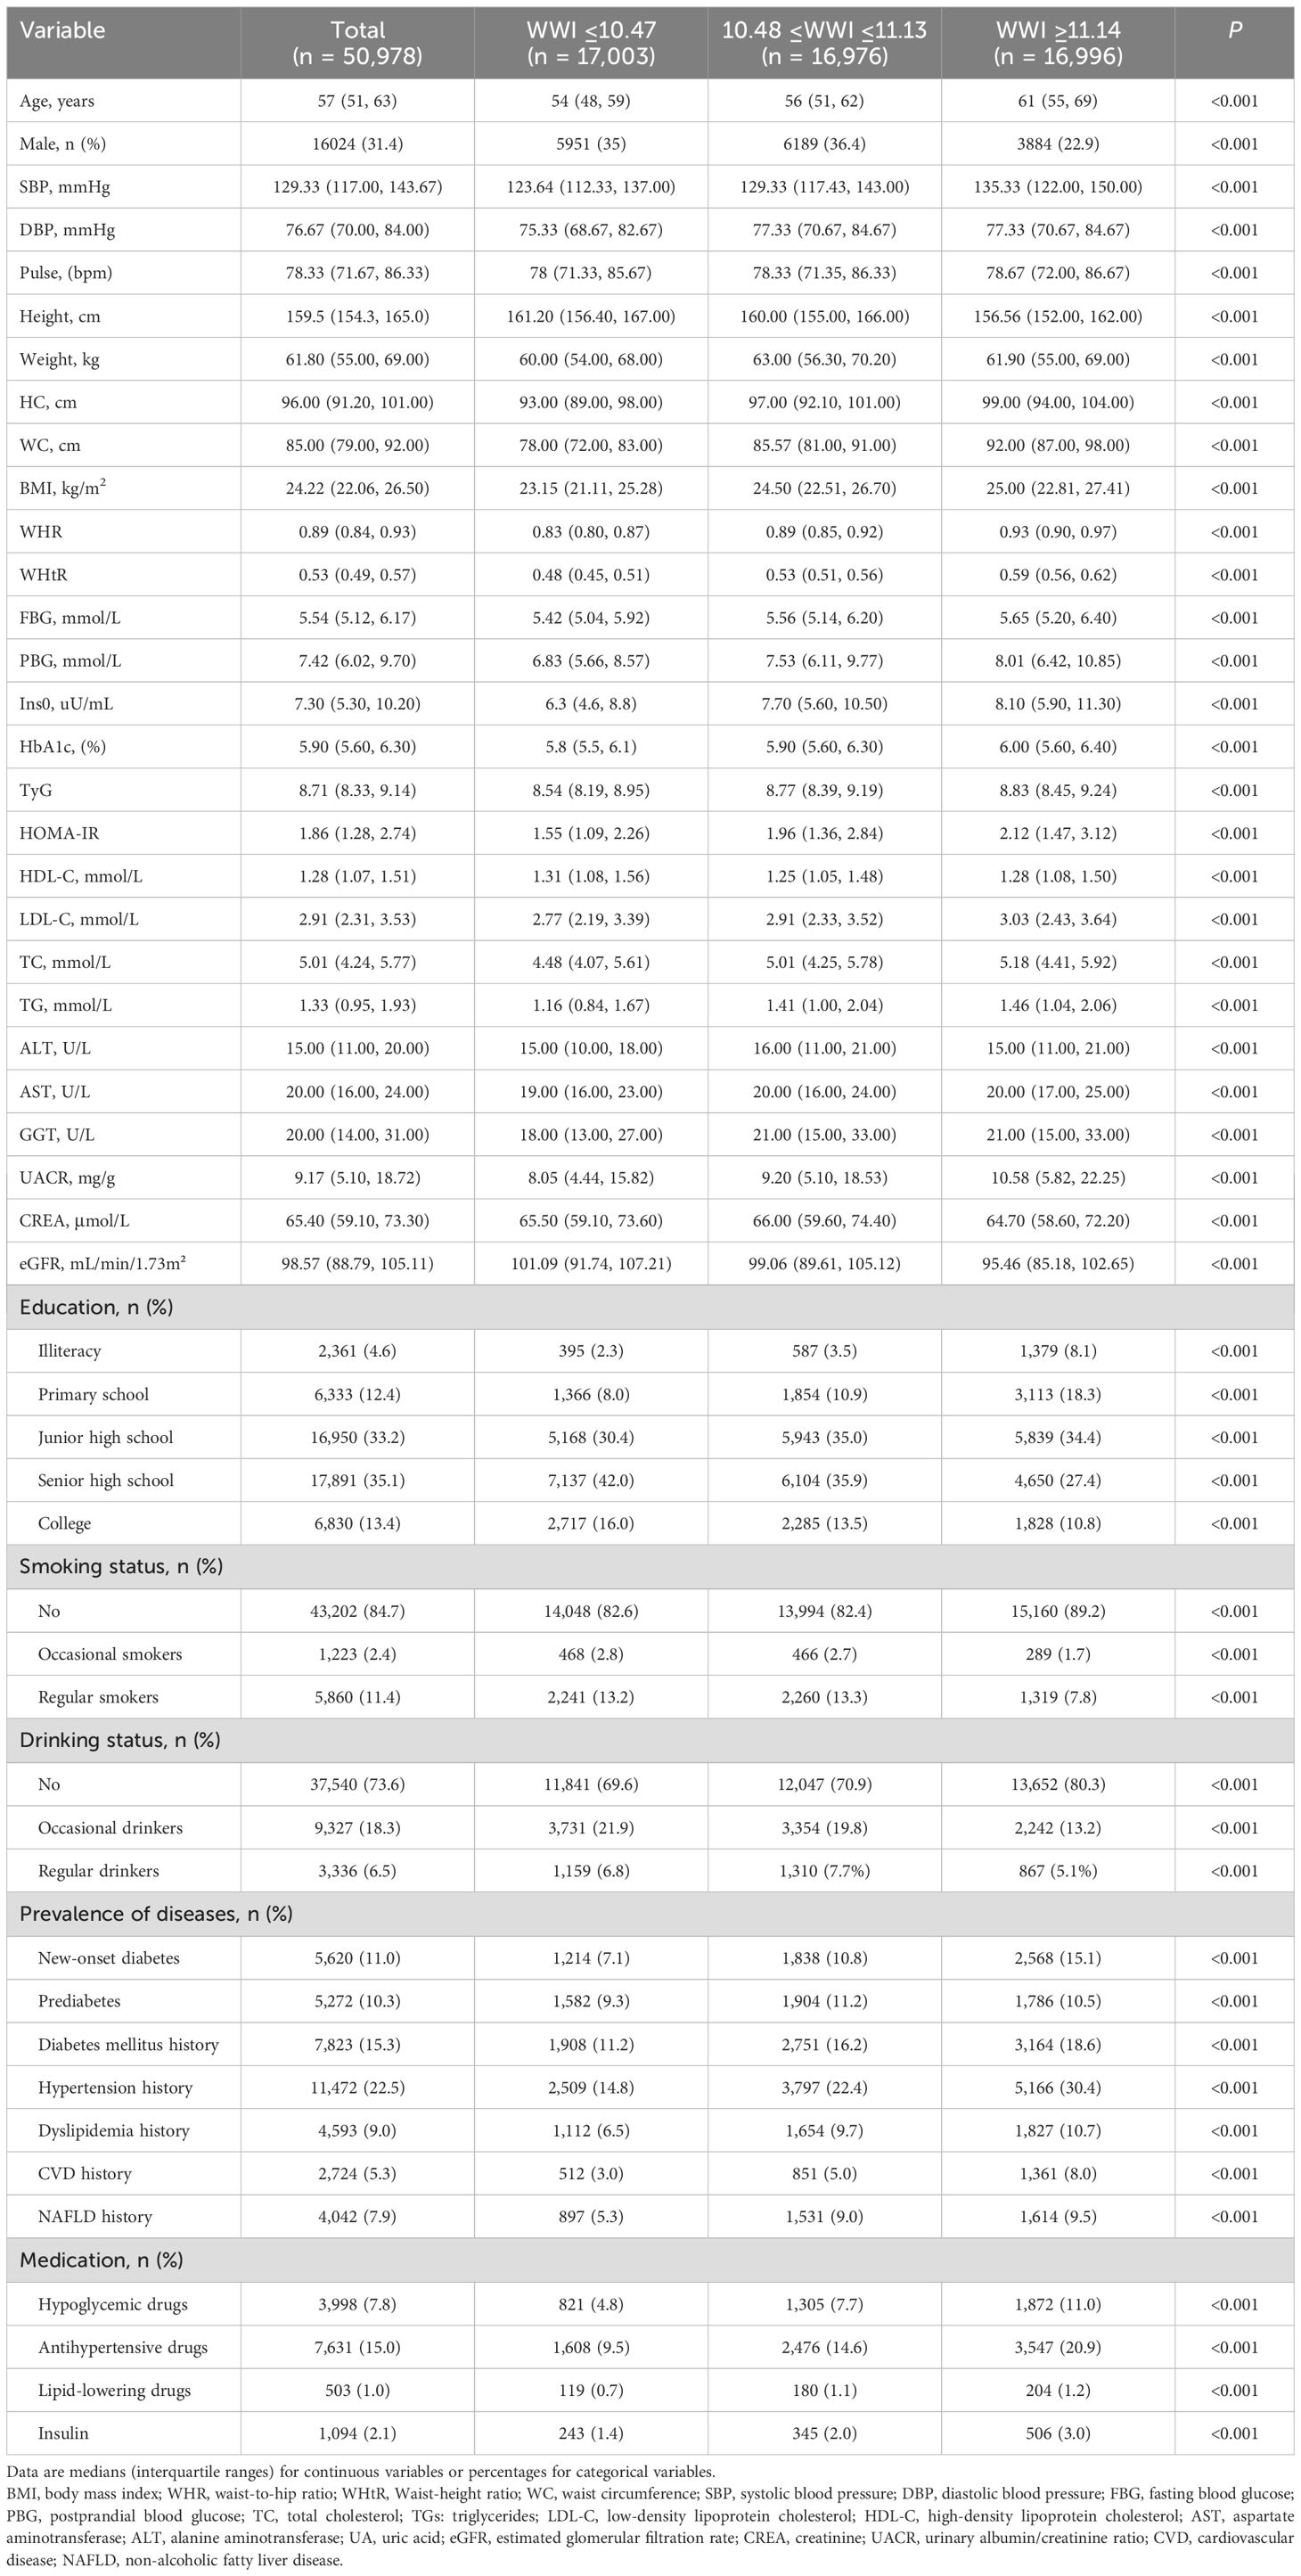
Table 1. Basic characteristics of participants by WWI tertile.
3.2 Correlations of WWI with T2DM-related clinical parametersWe used Pearson correlation analysis to examine the association between WWI and T2DM-related clinical parameters. The results shows that WWI was positively correlated with age, WC, WHR, SBP, FBG, PBG, HbA1c, and Scr, and was negatively correlated with BMI, DBP, TC, TG, ALT, LDL-C, and eGFR (all P <0.05). No significant correlation was observed between WWI and HDL-C, AST (P <0.05) (Table 2).

Table 2. Correlations of WWI with T2DM-related clinical parameters.
3.3 Association between WWI Tertile and T2DM risk in Chinese urban adultsTable 3 shows that the risk of T2DM increased with increasing WWI tertiles (P-trend <0.001). In Model 1, univariate analysis showed that WWI was associated with an increased risk of T2DM. In Model2, age, sex, BMI, SBP, DBP, HR, drinking status, and smoking status were adjusted. Then, TC, TG, LDL-C, HDL, ALT, AST, eGFR, CVD, antihypertensive drugs, and lipid-lowering drugs were added to model 3. The results were shown in Table 3. After fully adjusting for confounding factors, WWI remained independently associated with T2DM. Compared with the lowest tertile of WWI, T2 and T3 were associated with a 0.218-fold [1.218 (1.152, 1.288), P <0.001] and 0.286-fold [1.286 (1.212, 1.364), P <0.001] increase in the odds of developing T2DM, respectively. These results underscored a significant and positive association between WWI and the risk of T2DM. Additionally, our results showed that WWI was still positively correlated with T2DM when it was a continuous variable.
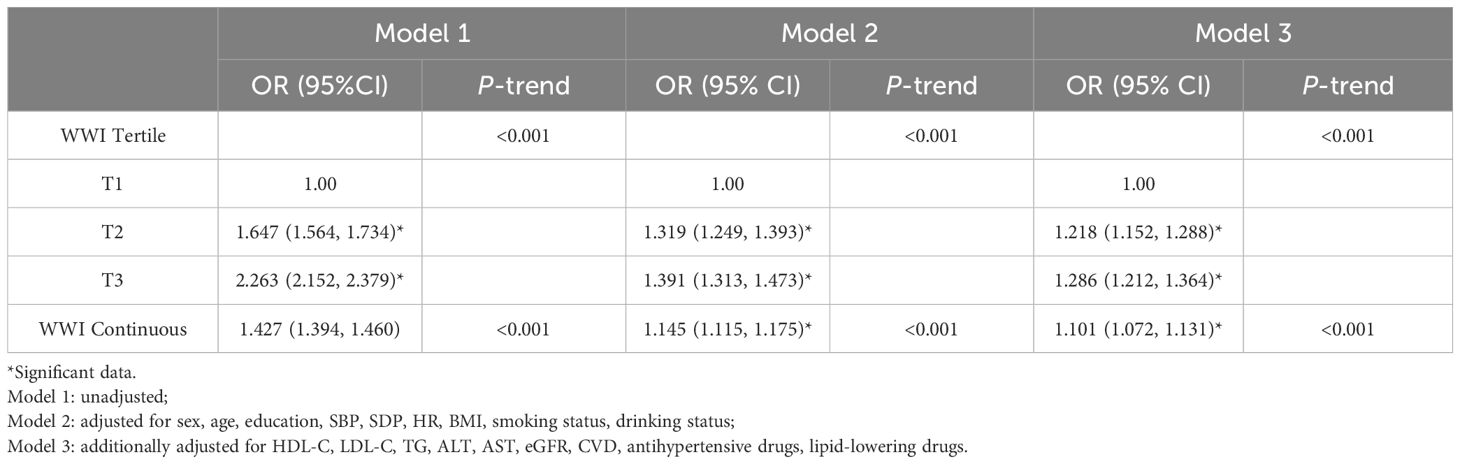
Table 3. Association between WWI Tertile and T2DM in Chinese urban adults.
3.4 Subgroup and sensitivity analysisStratified analyses were conducted based on age, sex, BMI, hypertension, and hyperlipidemia to further investigate the association between WWI and T2DM (Figure 2). The results showed that the ORs for T2DM significant increased with higher WWI. Of note, there was a significant interaction between WWI and age, BMI and sex (P for interaction <0.05). In those aged <60 years, BMI >24 kg/m2 and males, there was a stronger correlation between WWI and T2DM. However, the interaction with other stratification factors such as hypertension and hyperlipidemia were not significant (Supplementary Table S2). The results obtained after excluding missing data from the dataset are consistent with the results of the primary analysis (Supplementary Table S3). Furthermore, the results remained stable after the exclusion of participants BMI ≥28kg/m2 (Supplementary Table S4).
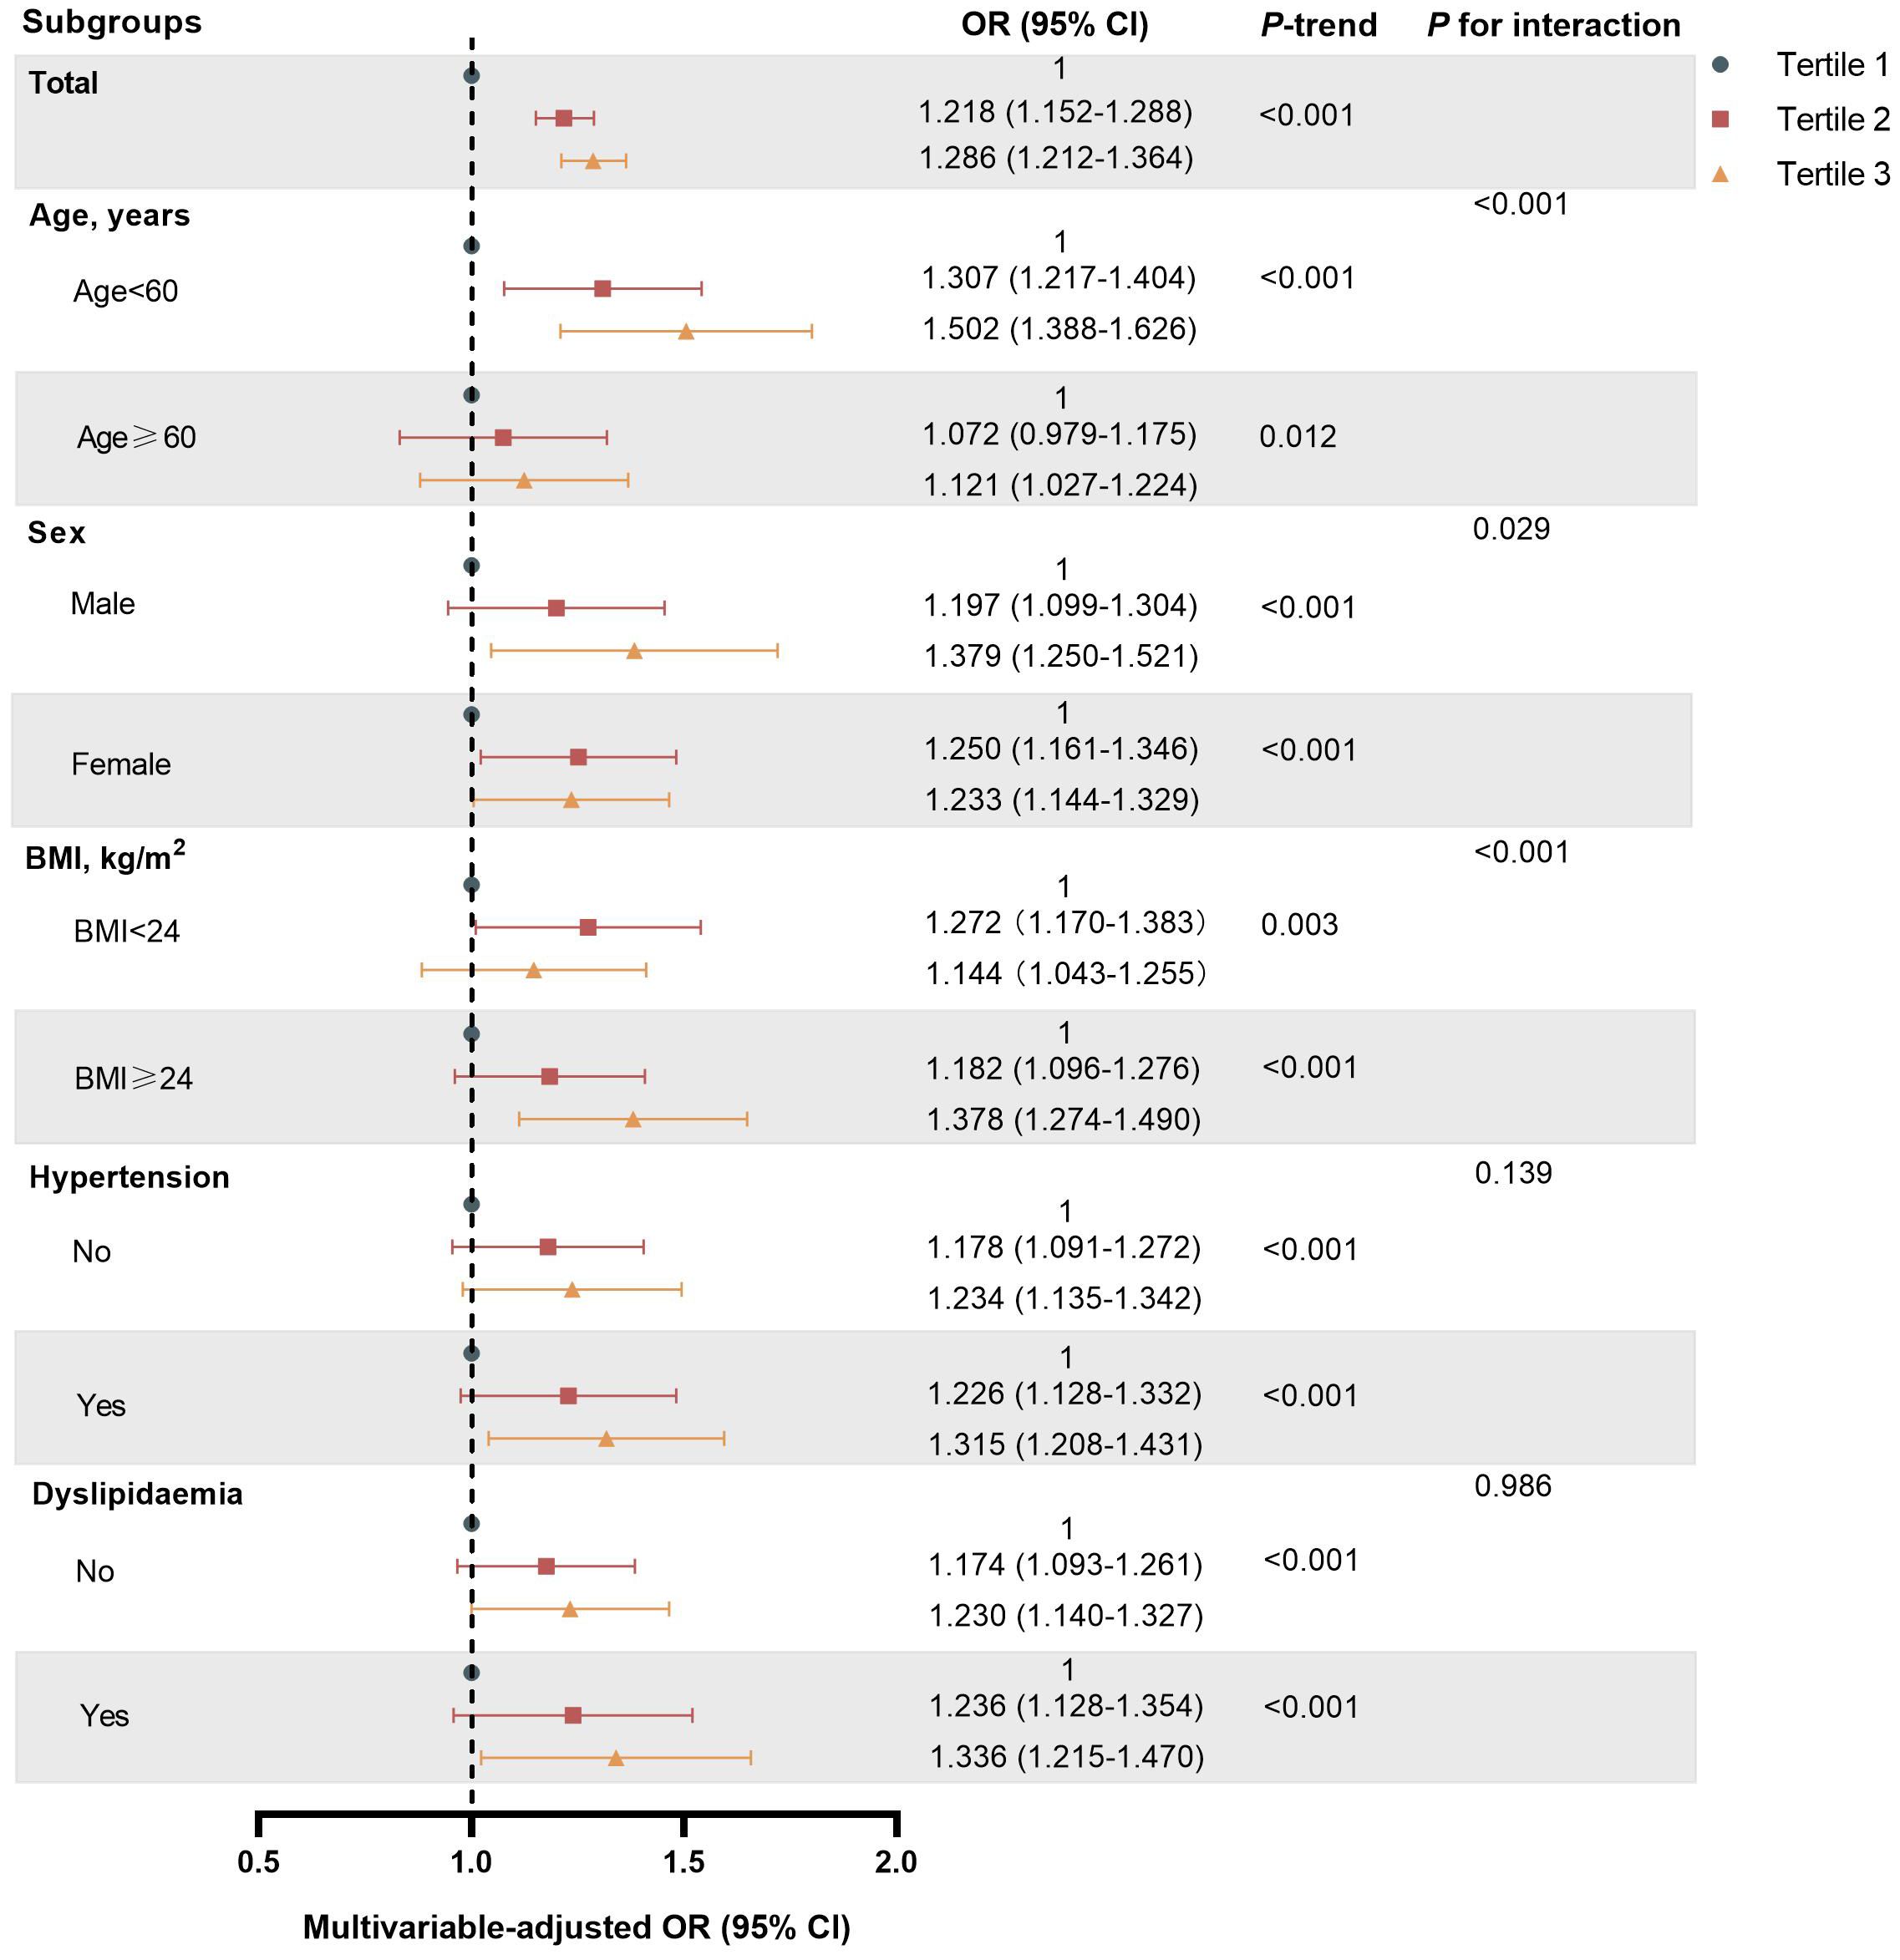
Figure 2. Subgroup analyses of association between WWI Tertile and T2DM risk in Chinese urban adults.
4 DiscussionWWI is a new anthropometric indicator to assess adiposity. In this cross-sectional study examining the relationship between WWI and T2DM among Chinese urban adults, we demonstrated a positive association between WWI and the risk of T2DM, which was consistent and stable after adjustment for a wide range of biochemical and lifestyle risk factors. Further stratification analysis revealed that the positive association between WWI and T2DM held true in age, sex, BMI, hypertension, and hyperlipidemia subgroup and was especially stronger in those aged <60 years, BMI ≥24 kg/m2 and males.
A cross-sectional study in U.S. adults (n = 31,001) by Zheng et al. (25) observed a strong positive correlation between WWI and the odds of T2DM, and found higher odds of T2DM among younger and non-hypertensive populations. In a prospective cohort study (n = 9,205) in the rural areas of northeast China, Yu et al. (26) found that increasing WWI was significantly associated with a higher incidence of newly diagnosed T2DM, indicating that WWI could be used as a simple and effective predictors of T2DM.Another study (27) reported that there was a positive linear association between baseline WWI and newly diagnosed T2DM in Japanese adults. Our findings were generally consistent with the above studies and further demonstrated that WWI could be a simple and effective predictor for T2DM. Moreover, consistent with previous study of Zheng et al., we also found a significant interaction between WWI and age, and showed that the association between WWI and T2DM was stronger in those aged <60 years. Likewise, other obesity index, such as WC, was demonstrated to be more associated with T2DM in individuals aged <60 years than in those aged ≥ 60 years (29). The reason may be as follows. Firstly, age affects body composition. Younger people tend to have more muscle mass, but muscle mass gradually decreases while fat content increases with age progression (30, 31). Secondly, age affects fat distribution. Studies have reported that central obesity is more significant in the elderly than in the young (32, 33).
As mentioned earlier, obesity leads to the occurrence of diabetes, but most of the previous studies were conducted using BMI and WC as indicators of obesity. However, both of BMI and WC have some disadvantages in evaluating obesity. For example, BMI neither reflects the distribution of body fat nor can differentiate between fat and muscle. Although WC can assess the degree of abdominal obesity, it could not differentiate between subcutaneous and visceral obesity. Recent studies have shown that central obesity is more closely associated with T2DM (34–36). Since WWI is derived from weight-standardized WC which mainly reflects pure central obesity independent of weight, it can be used as a better indicator of central obesity than WC. In addition, several studies have shown that WWI is positively correlated with fat mass and negatively correlated with muscle mass measured by various methods (37, 38). Thus, WWI could reflect body composition and fat distribution, and may be superior to BMI and WC in accurately evaluating central obesity.
As a better indicator of central obesity, WWI may induce diabetes through the following mechanisms: Firstly, altered adipose tissue metabolism: insulin-resistant factors such as free fatty acids (FFA), cortisol, and testosterone are active in abdominally obese individuals. FFA increases the generation of hepatic lipid and lipoprotein, and may reduce the clearance of the liver on insulin, causing insulin resistance in muscle and liver (39). Cortisol and testosterone have a “licensing” effect on adipolysis, thus amplifying the lipolytic stimulus and inducing insulin resistance in muscle (40). Secondly, altered endocrine function of adipose tissue: When adipocyte dysfunction occurs as a result of adipose tissue dilatation, there is an imbalance between pro-inflammatory and anti-inflammatory adipokines secreted by adipose tissue. For example, adipose tissue releases a variety of pro-inflammatory molecules. Aldosterone, a hormone traditionally associated with blood pressure regulation, has been implicated in the inflammatory response within adipose tissue (41). Studies have shown that aldosterone treatment of cultured adipocytes increases the expression of interleukin-6 (IL-6), plasminogen activator inhibitor-1, chemerin, and leptin, which are key players in the inflammatory cascade that can lead to insulin resistance (42). Additionally, the chronic low-grade inflammation in obesity, characterized by an increase in pro-inflammatory cytokines such as IL-6) and tumor necrosis factor-α, along with C-reactive protein, creates a state that may precipitate insulin resistance (43, 44). In contrast, anti-inflammatory factors such as adiponectin can regulate insulin sensitivity by reducing ectopic fat deposition, but high accumulation of visceral fat can reduce the concentration of adiponectin. For instance, excess aldosterone will lead to a decrease in blood adiponectin levels and correspondingly reduce its expression in visceral adipose tissue, thereby increasing susceptibility to a range of metabolic complications (45, 46). The dysregulation of the above pro-inflammatory and anti-inflammatory adipokines may have local or systemic effects on the inflammatory response, leading to the occurrence and progression of obesity-induced diabetes and other complications (47). Thus, our study further demonstrated the significance of early screening of central obesity for the prevention of diabetes and the potential of WWI as an accurate indicator to reflect central obesity.
A growing number of studies have explored the relationship between WWI and other diseases. Park et al. (16) research has found a positive linear association between WWI and cardiometabolic morbidity and mortality. In addition, two studies have showed that elevated WWI levels were independently associated with increased risks of cardiovascular and all-cause mortality in the Chinese population (19, 23). Subsequently, Fang et al. (48) found that higher levels of WWI were significantly associated with an increased risk of CVD in U.S. adults. Zhang et al. (18) found a significant correlation between WWI and risk of heart failure (HF) in a cross-sectional study, which can be used as an independent linear indicator of the risk of prevalent HF in the general population. What’ more, Li et al. (22) and Liu et al. (49) showed that WWI was positively associated with an increased risk of depression. To sum up, increased WWI levels are significantly associated with a variety of diseases and can be used for early disease screening.
The strengths of our study are the large sample size and the fact that the participants came from eight urban regions in different geographic areas of China. Nevertheless, this study had some limitations: First, some of the diseases identified in the survey were self-reported by participants, which may be underreported or overreported despite rigorous questionnaire survey according to the diagnostic criteria of the disease. Second, although we have adjusted for many important covariates, we cannot rule out any potential residual confounding. Third, since this was a cross-sectional study, causal relationship cannot be inferred, which needs to be further verified in a larger follow-up study.
5 ConclusionIn conclusion, this study showed that WWI was significantly and positively associated with the risk of T2DM in Chinese urban adults for the first time, and the association was especially pronounced in those aged <60 years, BMI ≥24 kg/m2 and males. We expect that larger prospective cohort studies will be conducted to further investigate the association between WWI and T2DM and verify the significance of WWI in screening people at high risk for T2DM.
Data availability statementThe data analyzed in this study is subject to the following licenses/restrictions: Firstly, the dataset is restricted to specific research or analytical purposes only. Secondly, the dataset is subject to copyright protection and must be used in compliance with the stated copyright notice. Finally, specific licenses or permissions may be required to access and use the dataset. Requests to access these datasets should be directed to Qingzheng Wu, d3F6X293bkAxNjMuY29t.
Ethics statementThe research program was authorized by the Human Research of Rui-Jin Hospital affiliated with the School of Medicine of Shanghai Jiao Tong University. (No. 2011-14). The studies were conducted in accordance with the local legislation and institutional requirements. The participants provided their written informed consent to participate in this study.
Author contributionsQZW: Writing – original draft, Writing – review & editing. BingL: Writing – original draft, Writing – review & editing. YW: Methodology, Project administration, Writing – review & editing. YZ: Investigation, Writing – review & editing. QW: Investigation, Writing – review & editing. BinqL: Data curation, Writing – review & editing. WJ: Writing – review & editing. JY: Writing – review & editing. YM: Supervision, Writing – review & editing.
FundingThe author(s) declare that no financial support was received for the research, authorship, and/or publication of this article.
AcknowledgmentsThe authors sincerely thank all participants for taking part in this research.
Conflict of interestThe authors declare that the research was conducted in the absence of any commercial or financial relationships that could be construed as a potential conflict of interest.
Publisher’s noteAll claims expressed in this article are solely those of the authors and do not necessarily represent those of their affiliated organizations, or those of the publisher, the editors and the reviewers. Any product that may be evaluated in this article, or claim that may be made by its manufacturer, is not guaranteed or endorsed by the publisher.
Supplementary materialThe Supplementary Material for this article can be found online at: https://www.frontiersin.org/articles/10.3389/fendo.2025.1460230/full#supplementary-material
References2. Saeedi P, Petersohn I, Salpea P, Malanda B, Karuranga S, Unwin N, et al. Global and regional diabetes prevalence estimates for 2019 and projections for 2030 and 2045: Results from the International Diabetes Federation Diabetes Atlas, 9th edition. Diabetes Res Clin Pract. (2019) 157:107843. doi: 10.1016/j.diabres.2019.107843
PubMed Abstract | Crossref Full Text | Google Scholar
5. Giordano A, Cinti F, Canese R, Carpinelli G, Colleluori G, Di Vincenzo A, et al. The adipose organ is a unitary structure in mice and humans. Biomedicines. (2022) 10:2275. doi: 10.3390/biomedicines10092275
PubMed Abstract | Crossref Full Text | Google Scholar
6. Peng W, Jian W, Li T, Malowany M, Tang X, Huang M, et al. Disparities of obesity and non-communicable disease burden between the Tibetan Plateau and developed megacities in China. Front Public Health. (2023) 10:1070918. doi: 10.3389/fpubh.2022.1070918
PubMed Abstract | Crossref Full Text | Google Scholar
7. World Obesity Federation. World Obesity Atlas 2022 [updated]. London, United Kingdom: World Obesity Federation (2022).
10. Cai X, Song S, Hu J, Zhu Q, Yang W, Hong J, et al. Body roundness index improves the predictive value of cardiovascular disease risk in hypertensive patients with obstructive sleep apnea: a cohort study. Clin Exp Hypertension. (2023) 45:2259132. doi: 10.1080/10641963.2023.2259132
PubMed Abstract | Crossref Full Text | Google Scholar
11. Mokdad AH, Ford ES, Bowman BA, Dietz WH, Vinicor F, Bales VS, et al. Prevalence of obesity, diabetes, and obesity-related health risk factors, 2001. JAMA. (2003) 289:76–9. doi: 10.1001/jama.289.1.76
PubMed Abstract | Crossref Full Text | Google Scholar
12. WHO Expert Consultation. Appropriate body-mass index for Asian populations and its implications for policy and intervention strategies. Lancet. (2004) 363:157–63. doi: 10.1016/S0140-6736(03)15268-3
PubMed Abstract | Crossref Full Text | Google Scholar
13. Flegal KM, Kit BK, Orpana H, Graubard BI. Association of all-cause mortality with overweight and obesity using standard body mass index categories. JAMA. (2013) 309:71–82. doi: 10.1001/jama.2012.113905
PubMed Abstract | Crossref Full Text | Google Scholar
14. Romero-Corral A, Somers VK, Sierra-Johnson J, Thomas RJ, Collazo-Clavell ML, Korinek J, et al. Accuracy of body mass index to diagnose obesity in the US adult population. Int J Obes (Lond). (2008) 32:959–66. doi: 10.1038/ijo.2008.11
PubMed Abstract | Crossref Full Text | Google Scholar
16. Park Y, Kim NH, Kwon TY, Kim SG. A novel adiposity index as an integrated predictor of cardiometabolic disease morbidity and mortality. Sci Rep. (2018) 8:16753. doi: 10.1038/s41598-018-35073-4
PubMed Abstract | Crossref Full Text | Google Scholar
17. Qin Z, Chang K, Yang Q, Yu Q, Liao R, Su B, et al. The association between weight-adjusted-waist index and increased urinary albumin excretion in adults: A population-based study. Front Nutr. (2022) 9:941926. doi: 10.3389/fnut.2022.941926
PubMed Abstract | Crossref Full Text | Google Scholar
18. Zhang D, Shi W, Ding Z, Park J, Wu S, Zhang J, et al. Association between weight-adjusted-waist index and heart failure: Results from National Health and Nutrition Examination Survey 1999-2018. Front Cardiovasc Med. (2022) 9:1069146. doi: 10.3389/fcvm.2022.1069146
PubMed Abstract | Crossref Full Text | Google Scholar
19. Ding C, Shi Y, Li J, Li M, Hu L, Rao J, et al. Association of weight-adjusted-waist index with all-cause and cardiovascular mortality in China: A prospective cohort study. Nutrition Metab Cardiovasc Dis. (2022) 32:1210–7. doi: 10.1016/j.numecd.2022.01.033
PubMed Abstract | Crossref Full Text | Google Scholar
20. Ding Y, Xu Z, Zhou X, Luo Y, Xie R, Li Y, et al. Association between weight-adjusted-waist index and the risk of hyperuricemia in adults: a population-based investigation. Front Endocrinol (Lausanne). (2023) 14:1236401. doi: 10.3389/fendo.2023.1236401
PubMed Abstract | Crossref Full Text | Google Scholar
21. Lin W, Ye Q, Lin M-E. Relationship between the weight-adjusted-waist index and kidney stone: a population-based study. World J Urol. (2023) 41:3141–7. doi: 10.1007/s00345-023-04620-8
PubMed Abstract | Crossref Full Text | Google Scholar
22. Li M, Yu X, Zhang W, Yin J, Zhang L, Luo G, et al. The association between weight-adjusted-waist index and depression: Results from NHANES 2005-2018. J Affect Disord. (2024) 347:299–305. doi: 10.1016/j.jad.2023.11.073
PubMed Abstract | Crossref Full Text | Google Scholar
23. Cai S, Zhou L, Zhang Y, Cheng B, Zhang A, Sun J, et al. Association of the weight-adjusted-waist index with risk of all-cause mortality: A 10-year follow-up study. Front Nutr. (2022) 9:894686. doi: 10.3389/fnut.2022.894686
PubMed Abstract | Crossref Full Text | Google Scholar
24. Zhao J, Cai X, Hu J, Song S, Zhu Q, Shen D, et al. J-shaped relationship between weight-adjusted-waist index and cardiovascular disease risk in hypertensive patients with obstructive sleep apnea: A cohort study. Diabetes Metab Syndr Obes. (2024) 17:2671–81. doi: 10.2147/DMSO.S469376
PubMed Abstract | Crossref Full Text | Google Scholar
25. Zheng D, Zhao S, Luo D, Lu F, Ruan Z, Dong X, et al. Association between the weight-adjusted waist index and the odds of type 2 diabetes mellitus in United States adults: a cross-sectional study. Front Endocrinol (Lausanne). (2024) 14:1325454. doi: 10.3389/fendo.2023.1325454
PubMed Abstract | Crossref Full Text | Google Scholar
26. Yu S, Wang B, Guo X, Li G, Yang H, Sun Y, et al. Weight-adjusted-waist index predicts newly diagnosed diabetes in chinese rural adults. J Clin Med. (2023) 12:1620. doi: 10.3390/jcm12041620
PubMed Abstract | Crossref Full Text | Google Scholar
27. Sun H, Li Y, Shi J, Li K, Zhao Y, Shang L, et al. Weight-adjusted waist index is not superior to conventional anthropometric indices for predicting type 2 diabetes: a secondary analysis of a retrospective cohort study. Fam Pract. (2023) 40:782–8. doi: 10.1093/fampra/cmad047
PubMed Abstract | Crossref Full Text | Google Scholar
28. Inker LA, Enenanya ND, Coresh J, Tighiouart H, Wang D, Sang Y, et al. New creatinine- and cystatin C-based equations to estimate GFR without race. N Engl J Med. (2021) 385:1737–49. doi: 10.1056/NEJMoa2102953
PubMed Abstract | Crossref Full Text | Google Scholar
29. Xi L, Yang X, Wang R, Ku C, Wu B, Dai M, et al. Waist circumference-years construct analysis and the incidence of type 2 diabetes: China health and nutrition survey, 1997-2015. Nutrients. (2022) 14:4654. doi: 10.3390/nu14214654
PubMed Abstract | Crossref Full Text | Google Scholar
30. Kyle UG, Genton L, Hans D, Karsegard L, Slosman DO, Richard C, et al. Age-related differences in fat-free mass, skeletal muscle, body cell mass and fat mass between 18 and 94 years. Eur J Clin Nutr. (2001) 55:663–72. doi: 10.1038/sj.ejcn.1601198
PubMed Abstract | Crossref Full Text | Google Scholar
32. Shen W, Punyanitya M, Silva AM, Chen J, Gallagher D, Sardinha LB, et al. Sexual dimorphism of adipose tissue distribution across the lifespan: a cross-sectional whole-body magnetic resonance imaging study. Nutr Metab (Lond). (2009) 6:17. doi: 10.1186/1743-7075-6-17
PubMed Abstract | Crossref Full Text | Google Scholar
34. Janiszewski PM, Janssen I, Ross R. Does waist circumference predict diabetes and cardiovascular disease beyond commonly evaluated cardiometabolic risk factors? Diabetes Care. (2007) 30:3105–9. doi: 10.2337/dc07-0945
PubMed Abstract | Crossref Full Text | Google Scholar
35. Langenberg C, Sharp SJ, Schulze MB, Rolandsson O, Overvad K, Forouhi NG, et al. Long-term risk of incident type 2 diabetes and measures of overall and regional obesity: the EPIC-InterAct case-cohort study. PloS Med. (2012) 9:e1001230. doi: 10.1371/journal.pmed.1001230
PubMed Abstract | Crossref Full Text | Google Scholar
36. Decoda Study Group, Nyamdorj R, Qiao Q, Lam TH, Tuomilehto J, Ho SY, et al. BMI compared with central obesity indicators in relation to diabetes and hypertension in Asians. Obes (Silver Spring). (2008) 16:1622–35. doi: 10.1038/oby.2008.73
PubMed Abstract | Crossref Full Text | Google Scholar
37. Kim NH, Park Y, Kim NH, Kim SG. Weight-adjusted waist index reflects fat and muscle mass in the opposite direction in older adults. Age Ageing. (2021) 50:780–6. doi: 10.1093/ageing/afaa208
PubMed Abstract | Crossref Full Text | Google Scholar
38. Kim JY, Choi J, Vella CA, Criqui MH, Allison MA, Kim NH. Associations between weight-adjusted waist index and abdominal fat and muscle mass: multi-ethnic study of atherosclerosis. Diabetes Metab J. (2022) 46:747–55. doi: 10.4093/dmj.2021.0294
PubMed Abstract | Crossref Full Text | Google Scholar
41. Song S, Cai X, Hu J, Zhu Q, Shen D, Ma H, et al. Plasma aldosterone concentrations elevation in hypertensive patients: the dual impact on hyperuricemia and gout. Front Endocrinol (Lausanne). (2024) 15:1424207. doi: 10.3389/fendo.2024.1424207
PubMed Abstract | Crossref Full Text | Google Scholar
43. Huby A-C, Antonova G, Groenendyk J, Gomez-Sanchez CE, Bollag WB, Filosa JA, et al. Adi
留言 (0)