
記住我


Participants were recruited from three COVID-19 treatment centers: Mulago National Referral Hospital, Entebbe Grade B Referral Hospital, and Masaka Regional Referral Hospital from June 2020 to December 2022 as described in Kamulegeya et al. [19] Individuals who tested PCR positive for SARS-CoV-2 and their asymptomatic household members were recruited to the study. The resulting COVID-19 biobank managed by the Integrated Biorepository of H3Africa Uganda (IBRH3AU) contains blood (plasma, serum), saliva, urine, stool, and nasal swabs. Participants also completed an electronic questionnaire for demographic data. Asymptomatic control individuals were not PCR tested for SARS-CoV-2 due to the global shortage of tests at the time, so their infection status is unknown.
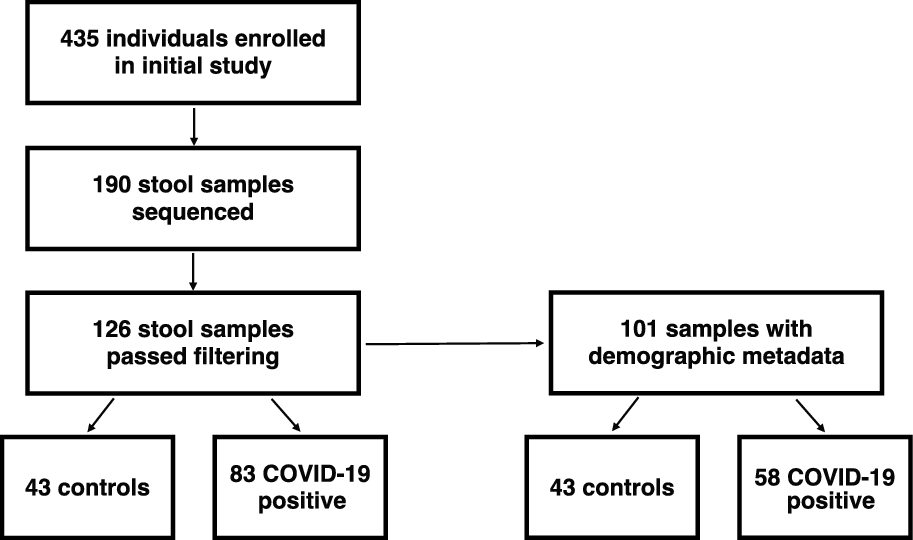
We extracted DNA and generated 16S rRNA gene amplicon sequencing libraries from 190 stool samples. 126 libraries passed quality checks and were used for subsequent analysis (Supplemental Table 1). From these filtered samples, 101 samples had demographic metadata that allowed for more specific analyses, such as geographic location, sex/gender, age, and antibiotic exposure at the time of sample collection (Fig. 1, Table 1).
Fig. 1
Flowchart of participants and analysed stool samples
Table 1 Sample characteristics with available metadata (N = 101)Diversity of the gut microbiome during SARS-CoV-2 infectionWe evaluated the composition of the gut microbiome of individuals positive for SARS-CoV-2 infection and asymptomatic controls using 16S rRNA gene amplicon sequencing of DNA isolated from stool samples. This allowed identification of most amplicon sequence variants (ASVs) at the genus level. Based on the abundances of these ASVs, we calculated alpha diversity for each sample using a metric that includes phylogenetic information (Faith’s Phylogenetic Diversity (PD)) and a metric that is phylogeny independent (Shannon Index). We identified significantly lower alpha diversity in the gut microbiomes of COVID-19 cases compared to those of asymptomatic controls using both metrics, suggesting that COVID-19 cases have less complex microbiomes than controls (Fig. 2A, B, Faith’s PD p*** < 0.001, Shannon p**** < 0.0001, Wilcoxon).
Fig. 2
The gut microbiome of individuals with COVID-19 is less diverse. Alpha diversity is shown using (A) Faith’s Phylogenetic diversity (PD) and (B) the Shannon Index (***p < 0.001 Faith’s PD, ****p < 0.0001 Shannon, Wilcoxon)
We next investigated the similarity of gut microbiomes across individuals using beta diversity. We used the Weighted UniFrac distance metric which takes into account both ASV abundance and taxonomy. The gut microbiomes of individuals infected with SARS-CoV-2 formed an overlapping, but distinct distribution by principal coordinate analysis when compared to asymptomatic controls (Fig. 3A, PERMANOVA p < 0.01). Microbiomes of asymptomatic individuals were more similar to each other, and those of infected individuals were significantly more dispersed (p < 0.01, PERMDISP). We also compared microbiome diversity using the Bray–Curtis and Jaccard distance metrics, which consider abundance and presence/absence respectively (Supplemental Fig. 1A, B). We see similar results using these different distances metrics as we do when using Weighted UniFrac (Supplemental Fig. 1A, B, p < 0.01, PERMANOVA; p < 0.01 PERMDISP). No differences were observed between the microbiomes of male and female subjects (Supplemental Fig. 1C, p < 0.01). Age of subjects, however, was linked to increased dispersion (Supplemental Fig. 1D). This may be in part due to the fact that the median age of asymptomatic controls was much lower than that of the COVID-19 cases.
Fig. 3
Beta-diversity analysis of the gut microbiomes of COVID-19 cases and asymptomatic controls. A Principal coordinate analysis (PCoA) calculated using weighted UniFrac distance metric is shown for individuals who tested positive for COVID-19 and asymptomatic controls (p < 0.01, PERMANOVA; p < 0.01, PERMDISP). The same PCoA is also plotted with point fill indicating recent antibiotic exposure at the time of sample collection (B p = 0.577, PERMANOVA; p = 0.915, PERMDISP) or a symbol indicating whether the individual resides in a rural or urban area (C, p = 0.127, PERMANOVA; p = 0.515, PERMDISP). ABX antibiotics exposure
We overlaid clinical and geographic data on the PCoA plot to see if these groupings drove the differences observed. We first wanted to test if antibiotic exposure explained the increased dispersion in COVID-19 cases. Comparing the distribution and dispersion of microbiomes from SARS-CoV-2 positive individuals with and without antibiotic exposure did not yield any significant differences (Fig. 3B, p = 0.577, PERMANOVA; p = 0.915, PERMDISP). We next tested the role of geography in microbiome composition. Both controls and COVID-19 cases were sampled from geographic regions around Uganda. Samples from individuals in the same district did not cluster with each other (Supplement Fig. 1E). Districts were classified into major cities (urban) or rural (all other areas) based on country data [39]. Using these criteria, gut microbiome beta diversity also did not differ significantly based on district urbanization (Fig. 3C, p = 0.127, PERMANOVA; p = 0.515, PERMDISP). Given that these variables are not significantly related to dispersion between microbiome samples, we conclude that COVID-19 cases are correlated with increased dispersion independent of the recorded metadata.
Taxa enriched in COVID-19 cases or controlsWe next explored whether specific taxa are enriched in the microbiomes of COVID-19 cases or controls. Analysis of microbiome composition with bias correction (ANCOM-BC) [27] identified genera that were significantly enriched in asymptomatic controls. Species significantly enriched in controls with a log2(fold change) greater than 1.5 include Lactobacillus, Clostridium sensu stricto 1, Haemophilus, Romboutsia, Agathobacter, and Akkermansia (Fig. 4A, Supplemental Fig. 2). Additional differential abundance testing using microbiome multivariable associations with linear models (MaAsLin2) [28] identified Turicibacter and Lachnospira as species that are also significantly enriched in controls (Fig. 4B, adjusted p-value < 0.05). Akkermansia and Romboutsia, in particular, have been shown to be associated with beneficial outcomes in the context of inflammatory conditions such as diabetes and ulcerative colitis [40,41,42].
Fig. 4
Genera differentially abundant between COVID-19 cases and controls. A The log2(fold change) of each genera is plotted versus the −log(adj p-value) as calculated by analysis of composition of microbiomes with bias correction (ANCOM-BC) (pink and blue dots represent species with an absolute log2(fold change) greater than 1.5 and an adjusted p-value less than 0.05). B Relative abundance for ANCOM-BC and MaAsLin2 selected taxa (padj < 0.05) (* taxa only selected by ANCOM-BC, **taxa only selected by MaAsLin2, *** taxa selected by both methods)
The gut microbiomes of COVID-19 cases were strikingly enriched for Eggerthella and Enterococcus (1.76-fold and 2.75-fold respectively, adjusted p-value < 0.05) (Fig. 4). Enterococcus species were completely absent from asymptomatic controls, whereas Enterococcus was found in 56.6% of COVID-19 cases. The range of Enterococcus relative abundance in the COVID-19 cases ranged from 0 to 85% (Fig. 5A). Eggerthella species were present in only 2% of asymptomatic individuals, whereas Eggerthella was found in 43.4% of COVID-19 cases. Eggerthella relative abundance in COVID-19 cases ranged from 0 to 4% (Fig. 5B). MaAsLin2 analysis additionally identified Lachnoclostridium as enriched in COVID-19 cases (Fig. 5C).
Fig. 5
Enterococcus species were highly abundant in COVID-19 cases. The relative abundance of (A) Enterococcus species (padj* < 0.05, Holm test), B Eggerthella species (padj* < 0.05, Holm test), and (C) Lachnoclostridium species (padj* < 0.05 MaAsLin2) in positive COVID-19 individual and asymptomatic individuals. PCoA identifying positive COVID-19 individuals with (D) Enterococcus (p < 0.01, PERMANOVA; p = 0.639, PERMDISP), E Eggerthella (p < 0.05, PERMANOVA; p = 0.821, PERMDISP), and F Lachnoclostridium (p = 0.095, PERMANOVA; p = 0.634, PERMDISP) present in their gut microbiome
We next tested if the presence of each species was linked to the heterogeneity in beta diversity observed above. We plotted the beta diversity PCoA and labeled the presence/absence of Enterococcus (Fig. 5D). The microbiomes of COVID-19 cases that had Enterococcus did not cluster together, but formed a distinct distribution to the microbiomes of COVID-19 cases with no Enterococcus (p < 0.01, PERMANOVA). Microbiomes with Enterococcus were quite dispersed. While this suggests that Enterococcus presence contributes to the broader dispersion seen in the microbiomes of COVID-19 cases, it was not sufficient to explain this increased dispersion. Enterococcus positive microbiomes were not significantly more dispersed than COVID-19 positive microbiomes without Enterococcus (p = 0.639, PERMDISP). Eggerthella positive COVID-19 cases also formed a statistically distinct distribution from positive COVID-19 cases without Eggerthella (Fig. 5E), while changes attributed to Lachnoclostridium did not reach significance by PERMANOVA (Fig. 5F).
Exploring the role of Enterococcus and Eggerthella species in COVID-19Antibiotic exposure has been previously shown to cause blooms in Enterococcus abundance in hospitalized patients with diarrhea in Vietnam and cancer in the United States [43, 44]. Available metadata on antibiotic use allowed for us to test this hypothesis in the context of COVID-19 and Uganda. Individuals positive for SARS-CoV-2 were compared based on whether or not they received antibiotics at the time of sample collection. The relative abundance was also not significantly different based on antibiotic exposure within COVID-19 cases (Fig. 6A, p = 0.242 Wilcoxon test) suggesting that an increased risk of Enterococcus bloom in COVID-19 cases is not due to increased antibiotic exposure alone (16.8% of COVID-19 cases without antibiotics contained Enterococcus vs. 13.9% of cases exposed to antibiotics, Fig. 6B). Reported antibiotic exposure also did not result in significant changes in alpha diversity among COVID-19 positive individuals (Supplemental Fig. 3 A, B). Antibiotic exposure based on sex and geography also did not result in significant changes in alpha and beta diversity among COVID-19 positive individuals (Supplemental Fig. 3 C–H). Interestingly, the vast majority of Enterococcus positive microbiomes were sampled from individuals at Mulago hospital and antibiotic exposure within that particular site is not correlated with the abundance of Enterococcus (Supplemental Fig. 4).
Fig. 6
The role of antibiotic exposure on Enterococcus species. A Enterococcus relative abundance in COVID-19 cases and controls based on antibiotic exposure status (ABX = antibiotic exposure, Unk = Unknown, NS not significant, Kruskal–Wallis). B The percent of individuals with Enterococcus detected at greater than 0.1% in their gut microbiome is shown for asymptomatic controls and COVID-19 positive individuals. The reads per million (RPM) of C Enterococcus faecium (p = 0.4, Wilcoxon test) and D Enterococcus faecalis (p = 0.8, Wilcoxon test) in positive COVID-19 individuals with and without antibiotic exposure
To determine the Enterococcus species contributing to these blooms, we performed shotgun metagenomic sequencing on five Enterococcus-containing samples. These samples were identified as Enterococcus-containing via the 16S rRNA amplicon sequencing. The metagenomes of the Enterococcus-containing samples were analyzed using the Chan Zuckerberg Infectious Disease (CZ ID) online platform [32]. These samples identified that the predominant species contributing to these blooms was E. faecium. E. faecium was identified in five of five sequenced samples (Fig. 6C). E. faecalis was also identified in all samples sequenced at a lower percentage (Fig. 6D). The Eggerthella species was identified as Eggerthella lenta, which was present in all metagenome sequenced samples (Supplemental Fig. 5). The antimicrobial resistance pipeline identified aminoglycoside, tetracycline, macrolide, streptogramin, lincosamide, and fluoroquinolone resistance reads associated with E. faecium (Supplement Table 3). Macrolide, fluoroquinolone, diaminopyrimidine, lincosamide, and pleuromutilin resistance reads were associated with E. faecalis (Supplement Table 3).
We next sought to understand the distribution of Enterococcus in individuals outside Uganda to compare to what we observed there. We hypothesized that if Enterococcus is linked to susceptibility to symptomatic COVID-19, we may observe more Enterococcus in populations with higher case fatality rates than Uganda, including the United States. We re-analyzed gut metagenome data to identify levels of Enterococcus species in six readily available studies from the United States which included healthy controls and patients with inflammatory bowel disease [33,34,35,36,37,38] (Supplemental Table 4). We found that E. faecium and E. faecalis were found at a low level in some healthy controls (less than 2500 reads per million, Supplemental Fig. 6A, B). Although this data is not directly comparable to our amplicon sequencing data, it provides evidence that baseline Enterococcus levels in the population may vary by geography. Additionally, antibiotic exposure in this cohort also did not influence Enterococcus abundance, supporting our finding that antibiotics did not play a role in Enterococcal blooms in our population (Supplemental Fig. 6A). In fact, in the US datasets there was a trend toward antibiotic exposure suppressing Enterococcus in healthy individuals. Enterococcus was more prevalent in individuals with inflammatory bowel disease, although again antibiotic history did not influence the abundance significantly (Supplemental Fig. 6, not significant, Wilcoxon test). Thus, Enterococcus presence, like COVID-19 disease severity, may be heavily influenced by underlying medical conditions and geography.
留言 (0)