
記住我
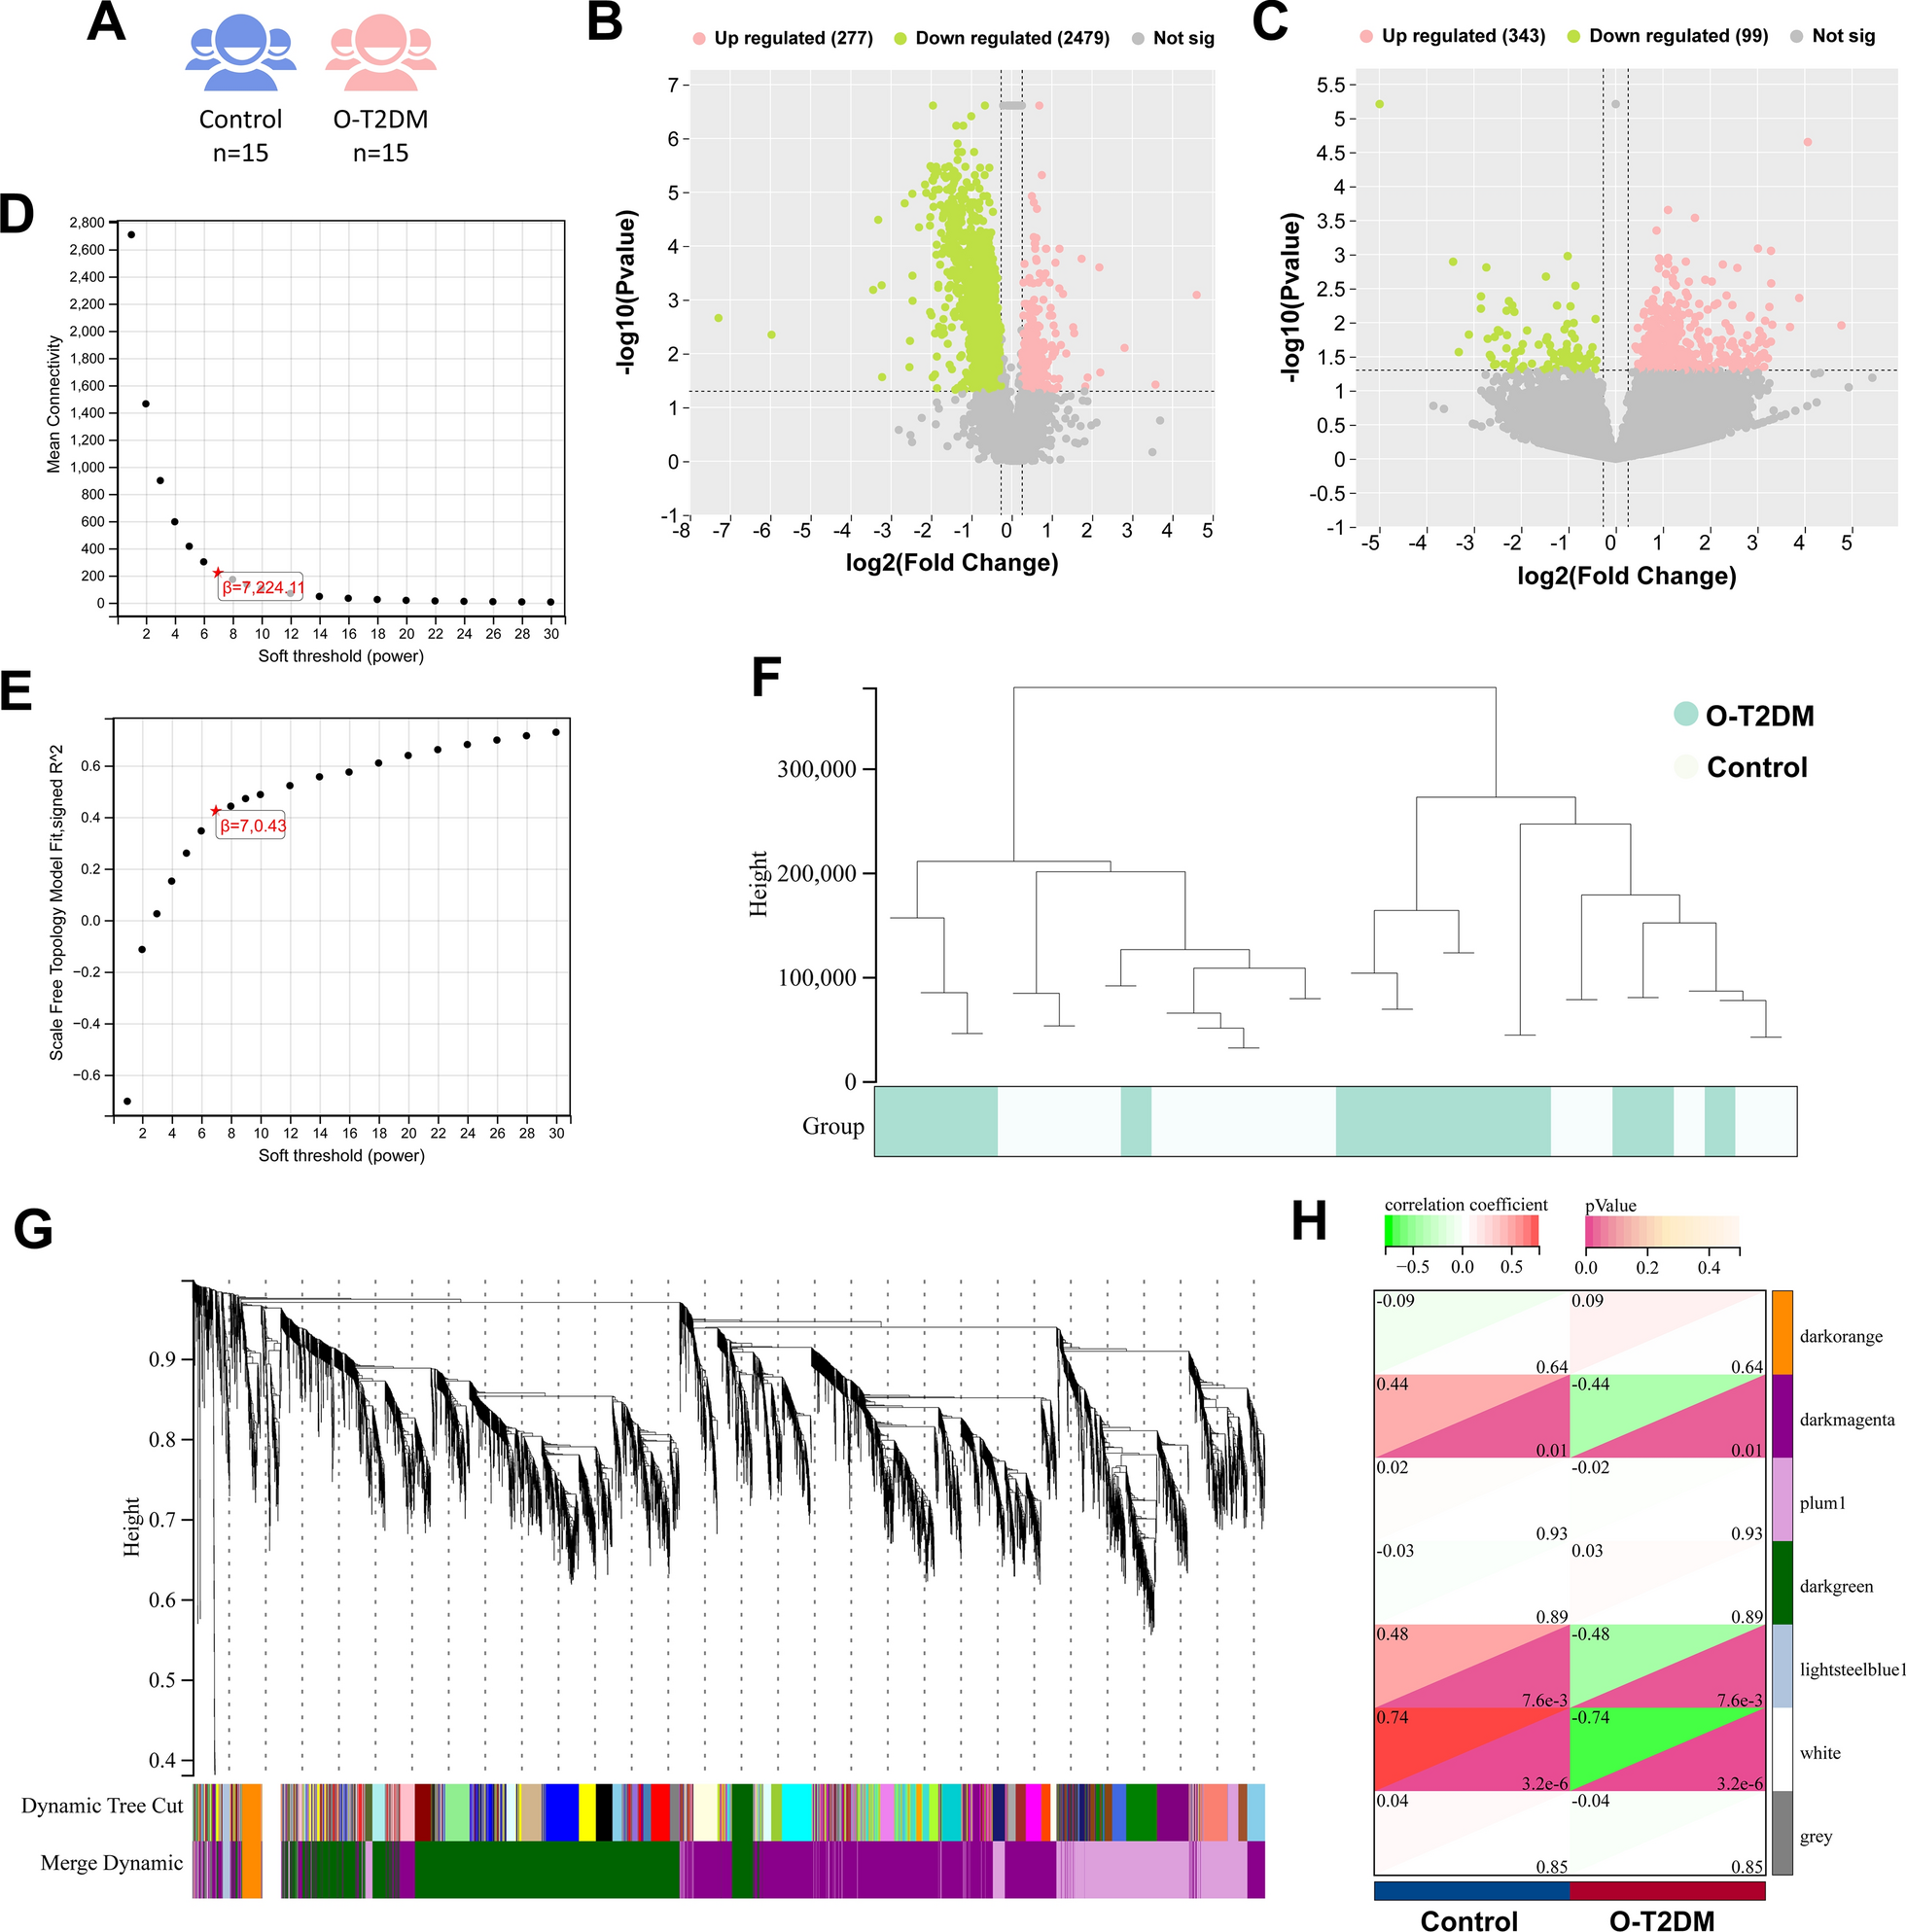
Firstly, KEGG map (https://www.genome.jp/kegg/) was used to select a pathway related to insulin resistance and type 2 DM. Secondly, Bioinformatics was performed to find potential candidate genes related to T2DM, insulin resistance and NOD signaling pathway from earlier microarray research available in public databases; National Center of Biotechnology Information GEO (https://www.ncbi.nlm.nih.gov/geo/, available May 2022) and p value ≤ 0.05 was considered statistically significant. As a result, GSE78721 and GSE104948 datasets were selected as it contained adequate sample size with T2DM and control samples (details in supplementary Tables 1).
Then, the microarray data was analyzed using the online database tool GEO2R (https://www.ncbi.nlm.nih.gov/geo/geo2r/, accessed in May 2022) to detect genes with differential expressions. The criteria for screening used in this study were FDR < 0.05 and adj p value < 0.05. Probes without identified gene symbols were removed, and all the differentially expressed genes (DEGs) were then displayed through volcano graphs for better visualization.
The selected molecular players were filtered according to their high-ranking score, a strong link to insulin resistance signaling, type 2 diabetes mellitus, and the NOD pathway, their expression in the tissue of interest, kidney, liver and adipose tissue. Based on these criteria, CHUK and NFKB1 genes were selected.
Thirdly, Gene ontology (GO) enrichment of CHUK and NFKB1 mRNAs was performed using Enrichr (http://amp.pharm.mssm.edu/Enrichr) with p < 0.05 set as the cutoff criterion that verified its correlation to positive regulation of interferon production and kappa beta phosphorylation.
Fourthly, Protein atlas database (https://www.proteinatlas.org/) was employed to confirm the expression of the selected molecular players in target tissues, kidney, liver, adipose tissue and blood. Then, STRING online library (https://string-db.org/) was employed to confirm the protein–protein network regarding the selected elements. TNF-a and LC3B were linked at high confidence.
Fifthly, we selected the epigenetic regulatory elements of the extracted genes through epigenetic libraries such as mirwalk (http://mirwalk.umm.uni-heidelberg.de/), DIANA tools (http://diana.imis.athena-innovation.gr/DianaTools/index.php) and non-code (http://www.noncode.org/) databases. We selected miR-611 which can interact with both mRNAs selected before (score > 0.9 at CDS binding sites), also, pathway enrichment analysis showed its relation to inflammation. Additional 2 GEO series verified the expression of miR-611 in mice (GSE151334 and GSE111864). Finally, RP4-605O3.4 was found to interact with the selected miR-611 and that was confirmed by The European Bioinformatics Institute’s Clustal Omega program based on their high complementarity rate. Therefore, we have constructed the regulatory panel as CHUK and NFKB1 that can interact with miR_611 and lnc-RP4-605O3.4 (Fig. 1) and supplementary material (Figures S1–10).
Fig. 1
Workflow of bioinformatics steps
ChemicalsStreptozotocin and sodium citrate buffer were purchased from Sigma Chemical Co (St. Louis, Mo, USA) and ZBiotics® was purchased from ZBiotics Co (Montgomery St, San Francisco, CA 94104, USA).
Animals50 Male Wistar rats of 140–185 g at the age of nearly two months were supplied by the Holding Company for Biological Products and Vaccines based in Giza, Egypt. They were let to adapt the laboratory conditions for one week with accessible water and food sources before diabetes induction. All animal protocols were conducted by the National Institutes of Health guide for the care and use of Laboratory Animals (8th edition, 2011) and were approved by the animal ethics committee for Ain-Shams University, Faculty of Medicine (Approval code: FWA 000017585).
Induction of type 2 diabetes mellitusType 2 diabetes models were induced by feeding rats a high fat diet (HFD) (22% fat, 48% carbohydrates and 20% protein) for 2 weeks [25], followed by two intraperitoneal (i.p.) administration of low doses streptozotocin (STZ) with one week apart to cause pancreatic damage by DNA alkylation [26]. STZ was at a dosage of 30 mg/kg and was dissolved in citrate buffer of pH 4.5 in a volume of 1 mL/kg [21]. Instead of STZ, normal control models were treated by blank; 1 mL/kg sodium citrate buffer. After one week of the last STZ injection, collection of blood samples was carried out from tail veins, and then blood glucose was estimated with a glucometer (Accu-check, Roche Diagnostics, Risch-Rotkreuz, Switzerland). When non-fasting blood glucose levels were ≥ 200 mg/dl (11.1 mmol/ L), rats were considered diabetic [27]. The rats were allowed to continue to feed on their respective diets until the end of the study (Fig. 2).
Fig. 2
Workflow chart showing the experimental design of animal groups. HFD High Fat Diet, STZ Streptozotocin
Experimental designThe animals under study were equally divided into 5 groups as follows; control group (n = 6): received regular chow diet (5% fat, 53% carbohydrates and 23% protein), STZ/HFD induced diabetic control group (n = 6): Each rat received HFD and intraperitoneal STZ with DMSO to facilitate its effect, quality group (n = 6) in which rats received only B. subtilis as a standard to ZBiotics® effect. B. subtilis strains were grown at a shaker incubator; 30 °C, 220 rpm overnight in Lysogeny Broth (LB) medium with or without 5 μg/ml chloramphenicol. Overnight bacterial culture was diluted 10 times followed by 37 °C/ 220 rpm culturing. Evaluation of colony forming units (CFU) was assessed with spectrophotometric readings at OD600; target reading: between 0.6 and 0.8. For in vivo studies, bacteria were stored in formulation buffer (2.28 g/L KH2PO4, 14.5 g/L K2HPO4, 15% glycerol, pH 7.5) at 1011 CFU/ml at − 80 °C, equivalent CFUs to ZBiotics® were administrated. Other two Diabetic + ZBiotics® treated groups were designed (n = 6 per each dose group): 4 weeks after the last STZ injection, ZBiotics® was administrated for 3 weeks at two doses: 0.5 ml/kg and 1 ml/kg. For the calculation of dosages, we performed a bacterial count assessment of ZBiotics® using the standard plate count technique. This involved quantifying colonies to determine colony-forming units (CFU). Following this, ZBiotics® dosage was determined based on prior research advocating a dosage of 10^9 CFU/kg, considered optimal for most probiotic strains. Consequently, in our current study, two dosages were administered: approximately 1 ml/kg (equivalent to 20 mg Zbiotic/mL) and 0.5 ml/kg (equivalent to 10 mg Zbiotic/0.5 mL). ZBiotics® was administered orally through gastric gavage [19]. When the experiment was performed, blood samples were collected under ether anesthesia from retro-orbital vein. Then, rats were exterminated by cervical dislocation. Liver, kidney as well as adipose tissues were collected from all groups and fixed in 10% formalin for histopathological assessment (Fig. 2).
Sampling and biochemical analysisBlood samples were collected from rats’ optical vein before extermination. Then, they were centrifugated at 2000×g for 10 min at 4 °C and sera were collected. Commercial ELISAs kits were utilized for the estimation of cholesterol, triglycerides, HDL, LDL, urea nitrogen, serum creatinine, fasting blood sugar, CK-MB and troponin according to the manufacturers’ guidelines (RayBiotech, USA). Urine samples were collected the day before the treatment end. Urine albumin and creatinine levels were estimated utilizing colorimetric kits (RayBiotech, USA) as regards the supplier instructions.
Total RNA extraction from liver, kidney and adipose tissue samplesTotal RNA was isolated from the liver, kidney and adipose tissue samples utilizing the miRNeasy kit (Qiagen, Hilden, Germany). Using the DeNovix DS-11 microvolume spectrophotometer (Wilmington, USA), RNA purity and concentration were determined; the sample was read at 260 nm for RNA detection and at 280 nm for protein detection using the spectrophotometer. Based on 40 µg RNA/ ml is equivalent to 1 absorbance, the concentration of RNA in a sample (μg/ml) = sample absorbance at 260 nm × 40/1 × dilution factor. Consequently, the concentration of RNA in a sample is calculated by cross multiplication considering the dilution factor. The samples were considered with high RNA quality when the RNA: Protein ratio (260:280 ratios) was more than 1.8. Then, all RNA samples were stored at – 80 °C until PCR experiments. Real-time two-step RT-PCR was carried out on the extracted RNA by miRCURY LNA RT kit (Cat no. 339340; Qiagen, Hilden, Germany).
Quantitative real-time polymerase chain reaction (qPCR)The relative expression of NFKBI and CHUK mRNAs was measured by means of QuantiTect SYBR Green PCR Kit (Cat no. 204143; Qiagen, Hilden, Germany) with specific primers for Rn-CHUK_2_SG QuantiTect Primer Assay (NM_001107588)(Gene Globe ID: QT00382494) and RN_NFKB1_2_SG QuantiTect Primer Assay (NM_001276711)(Gene Globe ID: QT01577975). Relative miRNA expression levels for miR_611 were analyzed by miRCURY SYBR Green PCR Kit (Cat no. 339320; Qiagen, Hilden, Germany). Relative expression levels for lnc-RP4-605O3.4 were analyzed by QuantiNova Probe PCR Kit (Cat. no. 208252; Qiagen, Hilden, Germany) and QuantiNova LNA Probe PCR Assay for RP4-605O3.4 (ENST00000548468). GADPH was utilized as an internal control for the chosen mRNAs and lncRNA, and U6 was utilized as housekeeping genes for miRNA experiments. All samples were analyzed with the Applied Biosystems Tm 7500 Real-Time PCR system (Foster City, California, United States). Applied Biosystems 7500 software v2.3 was utilized for the estimation of the threshold cycle (Ct). The Ct values over 35 were regarded as negative. The amplicons’ specificities for the SYBR Green-based PCR amplification were confirmed by melting curve analysis. In this study, appropriate standardization strategies were carried out to recognize any experimental error introduced at any stage during the extraction and processing of the RNA according to MIQE guidelines, clarified in Supplementary materials, Table (S1).
Histopathological examinationLiver, kidney and adipose tissue samples were dissected, fixed in 10% neutral buffered formalin for 72 h. Samples were processed in serial grades of ethanol, cleared in Xylene, and then embedded in Paraplast tissue embedding media. 5μ-thick tissue sections were cut by rotatory microtome and mounted on glass slides for the demonstration of hepatic lobules. Tissue sections were stained by Hematoxylin and Eosin as a standard stain for general microscopic examination by experienced histologist in a blinded manner. All standard procedures for samples fixation and staining were carried out according to Culling, C.F.A. 2013 [28].
Immunohistochemistry assessment of LC3B and TNF-alpha5 micron-thick paraffin embedded tissue sections were prepared for immune-histochemical assessment according to the manufacturer’s protocol. Deparaffinized retrieved tissue sections were treated by 0.3% H2O2 for 20 min. Liver and kidney samples were incubated with Anti TNF alpha (NBP1-19532—Novus Biologicals—1:100) and Anti LC3B (NB100-2220—Novus Biologicals—1:100) overnight at 4 °C. Tissue sections were washed out by PBS, followed by incubation with secondary antibody HRP Envision kit (DAKO) for 20 min. Then, washed out and incubated with diaminobenzidine (DAB) for 15 min. After that, they were washed by PBS, counter-stained with hematoxylin, dehydrated and cleared in xylene, then cover slipped for microscopic examination. According to Elsayed, 2022, at least 6 non-overlapping fields were randomly selected and scanned from tissue section of each renal sample as well as hepatic tissue samples for the determination of area percentage of immunohistochemical expression levels of TNF alpha and LC3B in immunohistochemically stained sections [29].
Morphometric analysis of adipocytesFor adipocytes’ analysis, at least 6 non-overlapping fields were randomly selected and scanned from each tissue section for the determination of cell mean diameters. All light microscopic examination and data were obtained by using Leica Application module for histological analysis attached to Full HD microscopic imaging system (Leica Microsystems GmbH, Germany).
Data analysis and statisticsThe sample size was obtained utilizing GraphPadStatMate, software program version 1.01 (1998) (Inc., CA, USA). It was calculated for each variable, and the largest one was taken. The estimated sample size for each group was 6 rats. Results values were described as mean ± SD. The statistical analysis was done by means of GraphPad Prism software, version 10.2.1 (2024) (Inc., CA, USA). The statistical difference of the groups was calculated by means of analysis of variance (ANOVA), which was accompanied by post hoc “Turkey’s Multiple Comparison Test” to compare among more than two groups. Statistically significant were the p values (< 0.05). Using 2-DCt method, fold change in expression by RT-PCR was determined, where delta Ct = Ct gene of interest- Ct endogenous control. For statistical analyses as well as representation, 2-DCt values were log-transformed.
留言 (0)