This systematic review was conducted in accordance with the guidelines set by the Preferred Reporting Items for Systematic Reviews and Meta-Analyses (PRISMA) [10] and registered on PROSPERO, registration number CRD42024603115. The review aimed to assess the causal relationship between DM and TB from studies that employed MR. The approach involved a comprehensive search, rigorous inclusion and exclusion criteria, data extraction, and quality assessment.
Search strategy
A comprehensive literature search was conducted in PubMed, Embase, Google Scholar, and Web of Science. The search strategy was developed using a combination of keywords related to diabetes, tuberculosis, and Mendelian randomization. The following search terms were used: “Diabetes mellitus” OR “type 1 diabetes” OR “type 2 diabetes”, “Tuberculosis” OR “TB”, “Mendelian randomization” OR “causal inference” OR “genetic instruments”. Boolean term “AND” was used to narrow the search. The search was conducted without restrictions on publication date to include studies up to October 08, 2024. Only studies published in English were considered.
Inclusion criteria
Study Design: Studies that used Mendelian randomization to assess the causal relationship between diabetes and tuberculosis.
Population: Studies investigating human populations, including both type 1 and or type 2 diabetes.
Outcome of Interest: Studies exploring tuberculosis in relation to genetic liability to diabetes.
MR Methodology: Studies utilizing established MR methods, including two-sample MR, inverse-variance weighted (IVW), MR-Egger, or weighted median approaches.
Published in Peer-Reviewed Journals: Only full-text articles published in peer-reviewed journals were included.
Exclusion criteria
Non-Mendelian Randomization Studies: Studies that did not utilize MR methodology or focused on observational or clinical data without causal inference using genetic instruments.
Animal Studies: Studies conducted in non-human populations.
Language: Studies not published in English.
Reviews, Editorials, and Commentaries: Non-original research articles, such as narrative reviews, editorials, or commentaries, were excluded.
Lack of Full-Text Availability: Studies that were not available in full text or lacked sufficient data for extraction.
Study selection process
Two independent reviewers (IP and RR) conducted the literature search and screened the titles and abstracts of identified studies. Discrepancies between the reviewers were resolved by discussion, and a third reviewer was consulted if necessary.
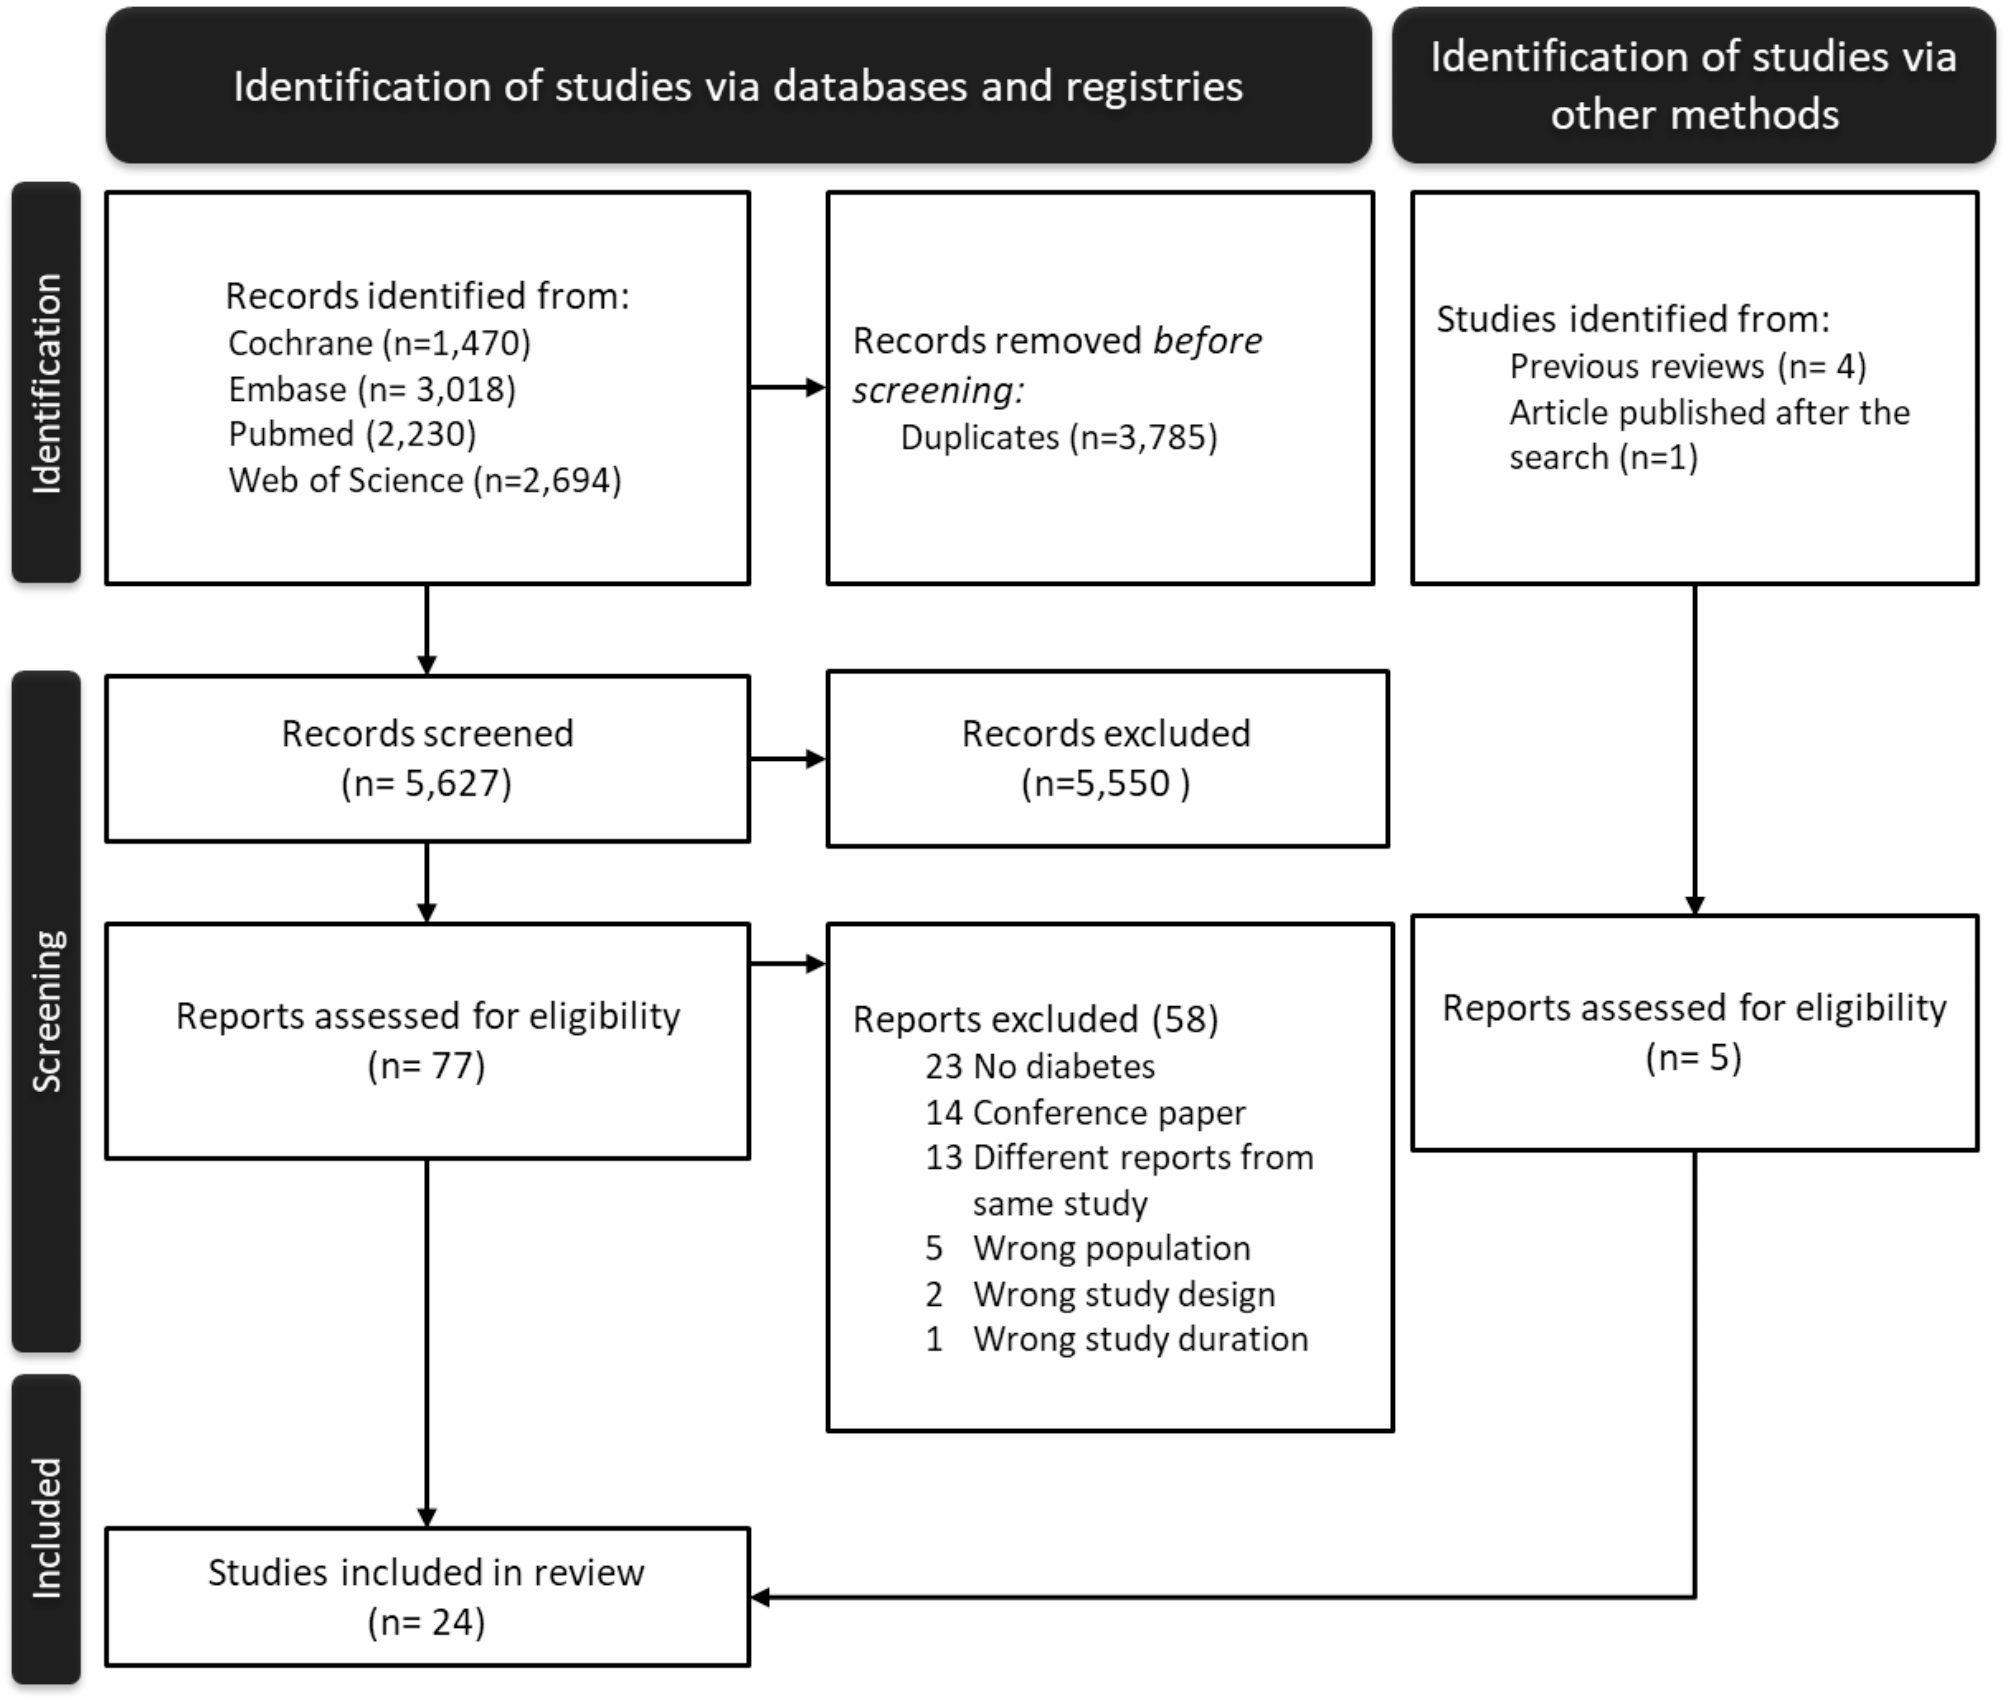
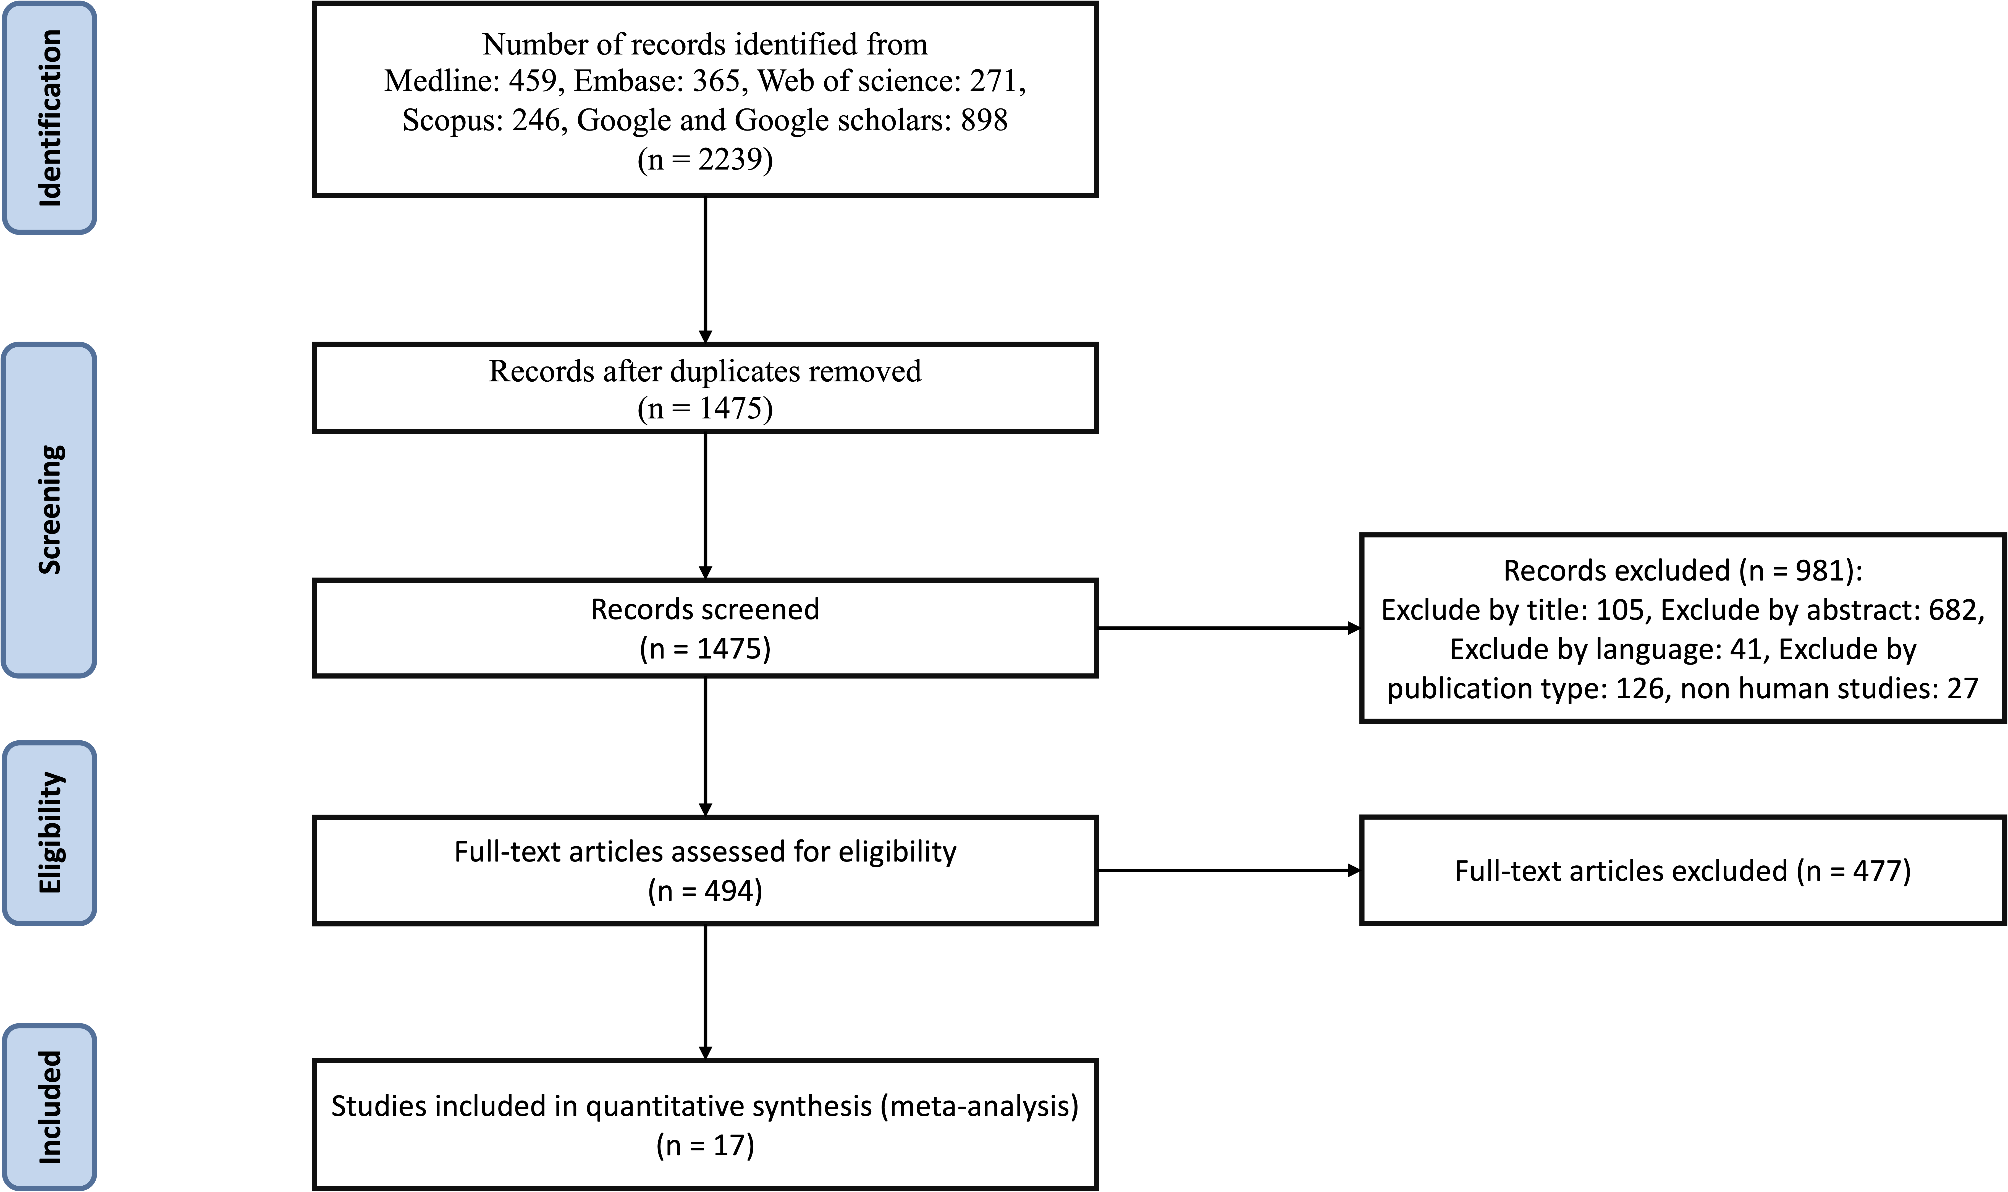
The screening process was conducted in two phases: Articles were initially screened based on their titles and abstracts to determine potential eligibility then full texts of potentially eligible studies were retrieved and assessed against the inclusion and exclusion criteria. Studies meeting the criteria were included for data extraction. The search and selection process is illustrated in a PRISMA flow diagram (Fig. 1).
Quality assessment
For quality assessment, information was extracted based on a template developed from the Strengthening the Reporting of Observational Studies in Epidemiology using Mendelian Randomization (STROBE-MR) guidelines [11]. Table 1. The STROBE-MR checklist is structured into six sections: Title and Abstract, Introduction, Methods, Results, Discussion, and Other Information. It includes 20 core items and 30 sub-items. The checklist applies to both one-sample and two-sample Mendelian randomization (MR) studies, whether they explore one or several exposures and outcomes. Additionally, it addresses MR studies that follow a genome-wide association study and are presented within the same publication. It encourages authors to explain why MR is appropriate for their research question and to specify their causal hypotheses in advance.
Table 1 Quality assessment using STROBE-MR guidelinesData extraction
Data from the included studies were extracted using a standardized data extraction form. The following key information was gathered from each study: Study, Ethnicity of the study population, Data source specifying the database from which genetic data were obtained; Genetic Instruments, detailing the specific SNPs or genetic variants used to proxy diabetes; Exposure, identifying whether the study focused on type 1 diabetes, type 2 diabetes; Sample Size, including the total number of cases and controls for both diabetes and tuberculosis; Specified Methods, outlining the specific MR techniques used in each study, such as two-sample MR, inverse-variance weighted (IVW) methods, MR-Egger, weighted median, and MR-PRESSO; and Effect Estimates of Inverse Variant Weighted, expressed as odds ratios (OR) with confidence intervals (CI) and associated p-values, capturing the causal relationship between diabetes and TB. The Conclusions section summarized each study’s overall findings regarding the causal link between diabetes and tuberculosis, including any identified pleiotropy or need for further investigation. (Table 2).
Table 2 Summary of included mendelian randomization studiesStatistical analysis
Meta-analysis was conducted for studies that reported T2DM to pool the causal effect estimates from the included studies using the inverse-variance weighted method. A random-effects model was applied to synthesize the causal effect estimates from the included Mendelian randomization studies. Heterogeneity among studies was quantified using the Q statistic, τ2, and I² values. The Q statistic tested whether observed variations in effect estimates were consistent with random sampling error, with significant values indicating the presence of heterogeneity. τ2, representing the between-study variance, was estimated using the restricted maximum-likelihood method, which minimizes bias in variance estimation. I² quantified the proportion of total variability attributable to heterogeneity, with values categorized to indicate low (25%), moderate (50%), or high (75%) heterogeneity. Confidence intervals for the pooled estimates were calculated using the Q-profile method, ensuring accurate interval estimation under the random-effects model. A forest plot was generated to visually represent the individual and pooled effect estimates.

留言 (0)