
記住我
Neuropeptide galanin is an important member of the so-called galaninergic system. Although 4 decades have passed since its discovery (Tatemoto et al., 1983), there are still numerous biological processes where the role of galanin is not yet fully understood (Jiang and Zheng, 2022; Zhu et al., 2022). The described pleiotropic effects of galanin as a neurotransmitter include its involvement in the regulation of sleep and arousal processes, behavioral processes, anxiety, learning and memory, pain and nociception, and other processes. The galaninergic system has also been found to play an important role in many peripheral organ functions, specifically in the heart and cardiovascular system, pancreas, and gastrointestinal system, as well as in bone, connective tissue, and skin (Lang et al., 2015; Šípková et al., 2017a). The diverse effects of galanin are evident not only in typical physiological conditions but also in pathological contexts (Gopalakrishnan et al., 2021).
The pleiotropy and complexity of galanin-mediated signalization are based on the existence of three different G-protein-coupled receptors (GPCRs), namely, GalR1, GalR2, and GalR3, which transduce the biological signal through different pathways (Jiang and Zheng, 2022). In addition, new ligands with partial homology to the galanin molecule were discovered over the years: GALP (galanin-like peptide) and alarin. According to the current knowledge, only GALP is capable of activating galanin receptors, namely, GalR2/GalR3, while alarin is not, despite their partial homology. Specific receptors for alarin are not known (Fang et al., 2020; Abebe et al., 2022). The newest member of the galaninergic system is spexin, a small peptide with pleiotropic functions that can activate human GalR2 and GalR3 receptors (Behrooz et al., 2020).
There are multiple studies describing the important role of the galaninergic system in metabolism, food intake, and obesity. The hypothalamic activity of galanin through GalR1 stimulation leads to increased fat intake. Moreover, there is a capability of stimulating positive feedback, which can lead to excessive fat intake and obesity (Marcos and Coveñas, 2021). This dysregulation may be followed by glucose intolerance, leading to type 2 diabetes mellitus (T2DM) and metabolic syndrome (Fang et al., 2012). Similarly, fat intake and feeding behavior can also be modified by the activity of GALP (Takenoya et al., 2018). Finally, the role in regulating food intake, satiety status, and, subsequently, obesity risk was confirmed for spexin as well (Behrooz et al., 2020). Spexin was also shown to mitigate high-fat diet (HFD)-induced murine hepatic steatosis both in vivo and in vitro (Jasmine et al., 2016). The complex role of the galanin family peptides and their receptors is also modified by other regulatory pathways and external factors, like acute and chronic stress (Sciolino et al., 2015; Šípková et al., 2017b). The inter-species differences also should not be neglected as the results of experiments in various animal models may not provide consistent results (Kuramochi et al., 2006; Hirako et al., 2017), raising the question of extrapolation of these data to humans.
Multiple studies have confirmed the presence of galanin receptors in the hearts of different vertebrates, including laboratory mice, rats, and guinea pigs. All the types of galanin receptors were discovered in the heart tissue quite early (Wang et al., 1997a; Wang et al., 1997b), but the exact role of galaninergic signalization in the heart is still not fully understood. In guinea pigs, galanin signalization was involved in positive inotropic action and a prolonged effective refractory period (Kocic, 1998). Galaninergic signalization may also be involved in the pathophysiological response to myocardial injury; for example, the myocardial galanin content was increased after cardiac ischemia and reperfusion in rats (Ewert et al., 2008). This phenomenon could be theoretically used for the treatment of cardiac muscle ischemic injury in the future (Pisarenko et al., 2017).
Celastrol, 3-hydroxy-9β,13α-dimethyl-2-oxo-24,25,26-trinoroleana-1(10),3,5,7-tetraen-29-oic acid (Figure 1), is a pentacyclic triterpenoid (Cascão et al., 2017). It was isolated from the root of Tripterygium wilfordii, which is a plant widely used in traditional Chinese medicine with reported anti-inflammatory and anticancer effects (Lee et al., 2006). When tested as a potential therapeutic agent, it was found that celastrol is a potent leptin sensitizer and anti-obesity substance in mice (Liu et al., 2015; Ye et al., 2024). Wang et al. stated that celastrol promoted white adipose tissue browning and also protected against HFD-induced obesity by the activation of the hypothalamus–sympathetic axis (Wang et al., 2021). Kyriakou et al. found that celastrol-induced weight loss is mediated by the inhibition of leptin-negative regulator protein in the hypothalamus (Kyriakou et al., 2018). Another effect was mentioned by Abu Bakar et al., who found that celastrol interferes with mitochondrial metabolism and increases pyruvate dehydrogenase complex activity while down-regulating pyruvate dehydrogenase kinase 4 expression (Abu Bakar et al., 2022). Moreover, Fang et al. suggested that celastrol leads to weight loss by inhibiting the expression of galanin and GalR1 and GalR3 receptors in the hypothalamus of mice fed on HFD (Fang et al., 2019). In the aforementioned study (Fang et al., 2019), celastrol also led to a decrease in the plasma levels of GALP, indicating that the effect of celastrol on the galaninergic system is quite complex. Finally, celastrol has been shown to have hepatoprotective properties for liver diseases, including metabolic dysfunction-associated fatty liver disease and steatohepatitis (MASLD/MASH) (Li M. et al., 2022). The exact molecular mechanisms that are responsible for these effects remain unclear. Specifically, there are no data on the effect of celastrol on the heart and liver galaninergic system. Several authors have mentioned the possibility of using galanin or the GALP agonist/antagonist in the therapy of obesity and MASH (He et al., 2023). However, the complexity of the galaninergic system is still not fully understood, especially under specific pre-existing comorbidities. Further research is needed for the potential clinical use of galanin and celastrol in the pharmacological treatment of obesity and its related metabolic and cardiovascular diseases in humans.
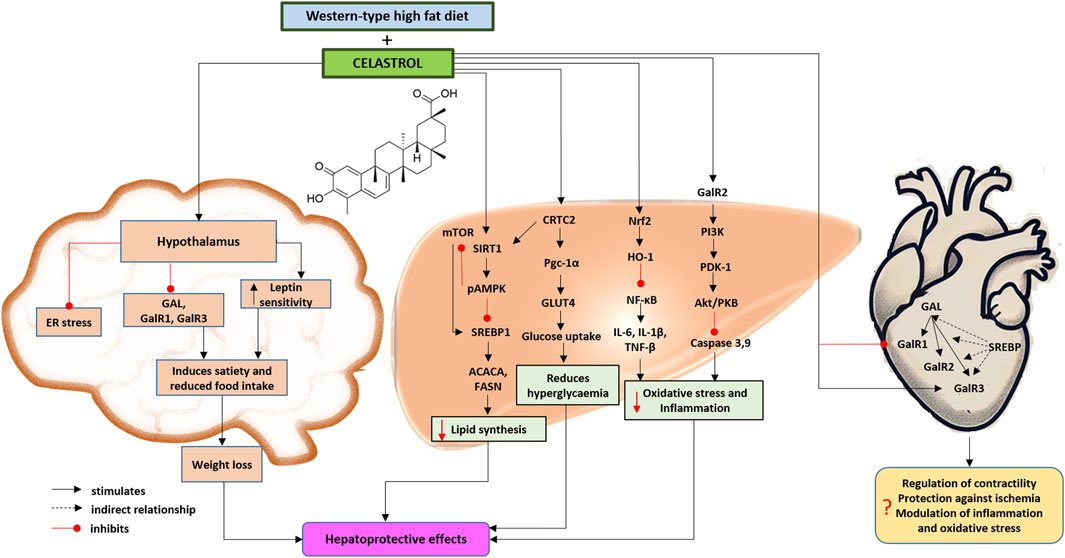
Figure 1. Proposed effects of celastrol on the brain, the heart and liver galaninergic system in a mouse model of Western-type diet-induced obesity and metabolic dysfunction-associated steatotic liver disease and steatohepatitis based on the presented results and herein discussed literature (Chen et al., 2015; Zhang et al., 2016; Fang et al., 2019; Palkeeva et al., 2019; Martinelli et al., 2021; Boal et al., 2022; Li M. et al., 2022; Serebryakova et al., 2023; She et al., 2023). Chemical structural formula of celastrol was drawn by using ChemDraw Professional Software (version 23.1.1.3, 64-bit). The heart was painted by OpenAI (ChatGPT 4o, 2024). Abbreviations: ACACA, acetyl-coenzyme A carboxylase alpha; CRTC2, CREB (cAMP response element-binding protein)-regulated transcription coactivator 2; ER, endoplasmic reticulum; FASN, fatty acid synthase; GAL, galanin; GalR1/2/3, galanin receptor 1/2/3; HO-1, heme oxygenase 1; GLUT4, glucose transporter-4; IL-1β, interleukin 1 beta; IL-6, interleukin 6; mTOR, mechanistic target of rapamycin kinase; NF-κB, nuclear factor kappa B; Nrf2, also Nfe2l2, nuclear factor, erythroid derived 2, like 2; pAMPK, phosphorylated adenosine monophosphate-activated protein kinase; PDK-1, phosphoinositide-dependent protein-kinase 1; PKB, protein kinase B; Pgc-1α, peroxisome proliferative activated receptor, gamma, coactivator 1 alpha; PI3K, phosphatidylinositol 3-phosphate; SIRT1, sirtuin 1; SREBP1, sterol regulatory element-binding protein 1; TNF-α, tumor necrosis factor alpha.
Therefore, the main goal of this study was to evaluate the effect of celastrol treatment on the heart and liver galaninergic systems in the mouse model of Western-type diet-induced obesity and MASLD/MASH (Figure 1).
2 Materials and methods2.1 MaterialsUnless otherwise stated, all the high-quality standard chemicals were purchased from Sigma-Aldrich (Merck, Germany) or P-Lab (Czech Republic).
2.2 Declaration on experimental animalsAll experimental animals were kept under conventional conditions with free access to water and granular food, regulated room temperature, and a 12-hour light regime in an accredited facility of the Institute of Pharmacology and the Center for Experimental Biomodels (CEB) of the First Faculty of Medicine, Charles University, Prague. The work with experimental animals was conducted following the Animal Protection Law of the Czech Republic (501/2020) and the Directive 2010/63/EU of the European Parliament and the Council. It was approved by the Expert Commission for Work with Experimental Animals of the First Faculty of Medicine, Charles University, and the Ministry of Education and Sports of the Czech Republic under the project No. MSMT - 11956/2021-4.
The male mice from inbred strain C57BL/6J (CEB, Prague, Czech Republic) aged at least 5–6 weeks were used for in vivo experiments. They were allowed to acclimatize for 1 week before feeding them with a defined diet. All the animals had unlimited access to a specific diet and drinking water. Due to the mutual aggression of the male mice and for the purpose of monitoring the food and fluid intake, the mice were housed individually in separate cages throughout the experiment.
2.3 Induction of obesity and metabolic dysfunction-associated fatty liver disease/steatohepatitis in mice and their treatmentsA special atherogenic Western-type high-fat diet (WD) in the form of 10-mm pellets (4,575 kcal/kg) containing 1.25% cholesterol (E15723-34, Ssniff Spezialdiäten, Germany, through Anlab, Czech Republic) was used for the induction of obesity and MASLD/MASH, as described previously (Arora et al., 2023). In addition, the mice received fructose (23.1 g/L = 86.62 kcal/L) and sucrose (18.9 g/L = 74.47 kcal/L), FG, in drinking water. The negative control group received a pelleted standard diet (STD; 3,226 kcal/kg; Altromin 1324, from Velaz, Lysolaje, Czech Republic). The access to food was unrestricted in all the studied groups. After the induction period for 12 or 16 weeks, the in vivo experiments were performed in two independent sets, namely, set 1 and set 2, representing the early stage and late stage of MASH, respectively (Table 1). The mice on WD/FG of each set were randomly divided into two groups: the positive control group (WD) and the celastrol treatment group (WD+CEL). Mice were then kept on the established diet and concurrently treated intraperitoneally on each second day with either the vehicle (DMSO, 1 mL/kg) or CEL (Tripterin, 20 mg, # HY-13067, MedChemExpress, United States, through Scintila, Czech Republic) at the dose of 200 μg/ml/kg for 4 additional weeks (Table 1).

Table 1. Induction of MASLD/MASH and division of mice into the experimental groups.
This study was preceded by a pilot study aiming to identify the MASLD/MASH development and the gene expression of the galanin family system members (galanin, galanin-like peptide, galanin receptor 1, galanin receptor 2, and galanin receptor 3) in mouse heart ventricles depending on the duration of the WD/FG feeding for 12–21 weeks. In this pilot study, we found that, under the given conditions, MASLD in mice begins to transit into MASH at week 12 on a Western diet and that by the end of week 16, MASH is already fully developed (data not shown). Therefore, we determined that the 4-week administration of CEL from week 12 could prevent the progression of MASLD to MASH (i.e., the transition of MASLD to MASH representing the early stage of MASH) and treatment from week 16 rather than the treatment of already-advanced diet-induced MASH (i.e., the late stage of MASH).
Although there is extensive research on the functions of sterol regulatory element-binding proteins (SREBPs) and their impact on lipid metabolism, the direct effect of SREBPs on galanin and galanin receptors is not well-documented in the available literature. Therefore, we evaluated fatostatin (FAT) for comparative analysis to reveal the role of SREBPs in the galaninergic system. Unlike CEL, FAT primarily affects fat metabolism and reduces adipose tissue and hepatic fat accumulation by inhibiting the activation of SREBP1/2 without any direct impact on appetite or food intake (Kamisuki et al., 2009; Zhao et al., 2022). For these purposes, we treated additional mice (n = 8) on WD/FG diet with FAT (an intraperitoneal dose of 10 mg/kg, dissolved in DMSO) each second day during weeks 12–16 (corresponding to set 1 of in vivo experiments).
2.4 Oral glucose tolerance testAn oral glucose tolerance test (OGTT) was performed 36 h before mouse euthanasia to measure the glucose concentration in the blood of experimental mice, as we described previously (Arora et al., 2023) with minor modifications. OGTTs were conducted on mice that had been fasted for 8 h (Andrikopoulos et al., 2008). In relation to oral glucose application (2 g/kg of body weight), blood samples were collected from the tail vein at 0, 30, 60, and 120 min to measure blood glucose levels using the Accu-Chek® Instant glucometer (Czech Dia, Roche). The area under the curve (AUC) of blood glucose was then calculated using the trapezoidal method (AUC = 1/4 * fasting glycemia + 1/2 * 30-min glycemia + 3/4 * 60-min glycemia + 1/2 * 120-min glycemia) (Li L. et al., 2021).
2.5 Blood, heart, liver, and fat samplingThe animals were fasted 12 h before terminal sampling. Initially, mice were anesthetized by intraperitoneal application of a ketamine (100 mg/kg) and xylazine (5 mg/kg) mixture (Bioveta, Czech Republic). Blood was terminally withdrawn by retro-orbital puncture using heparinized glass capillaries. Blood samples were left for 30 min at room temperature to clot and then centrifuged at 4,000 rpm for 10 min at 4°C. Serum aliquots were stored at −20°C until biochemical measurements. The mice were further dissected to extract the hearts, livers, and intra-abdominal and epididymal fat, which were washed in cold phosphate-buffered saline (PBS), dried on sterile gauze, and weighed. If necessary, the heart ventricles and individual liver lobes were separated to be utilized for respective analyses, as described below.
2.6 Biochemical analysisDetermination of serum concentrations of lipids (total cholesterol and triglycerides), glucose, albumin, liver enzymes (ALT, alanine transaminase; AST, aspartate transaminase; ALP, alkaline phosphatase), and nitrogen metabolites (urea and creatinine) was performed using the customized commercial kits in the routine Central laboratory of the Institute of Medical Biochemistry and Laboratory Diagnostics of the General University Hospital in Prague. The triglyceride content was estimated in liver caudate lobes exactly by following the instructions in the Triglyceride Quantification Colorimetric/Fluorometric Kit manual (# MAK266-1KT, Sigma-Aldrich, through Merck, Germany) and expressed as micrograms per µg of lysate protein, as measured using the Pierce™ BCA Protein Assay Kit (Thermo Fisher Scientific™).
2.7 Determination of liver oxidative stress parametersFirst, a liver left lateral lobe was homogenized (10% w/v) in the cooled lysis buffer (0.2 M Tris-HCl, pH 7.4, 0.002 M EDTA-Na2, and 0.025 M sucrose) and centrifuged at 4,000 rpm for 15 min at 4°C. Then, the supernatant was used for the analysis of oxidative stress markers. To determine the severity of liver oxidative stress caused by the metabolic disease, total lipid peroxidation was estimated by evaluating conjugated dienes, thiobarbituric acid reactive substances (TBARS), and nitrites, as previously described (Farghali et al., 2009; Arora et al., 2023). The total amount of protein in the liver homogenates was determined using the Bio-Rad protein assay (Bio-Rad, Prague, Czech Republic).
2.8 Quantitative RT-PCR for gene expressionTwo different qRT-PCR methods were used depending on the tissue collected: heart ventricles or liver lobes. RNA from heart ventricles (right and left together) was isolated using the QIAzol Lysis Reagent (QIAGEN, CA, United States). Extracted RNA was purified using the RNeasy Plus Mini Kit, as per the manufacturer’s protocol. Quantitative and qualitative analyses of RNA for quality determination were performed using the Agilent 2100 Bioanalyzer system (Agilent, CA, United States). The RNA integrity number (RIN) was used as an integrity parameter. Only samples showing RIN above 7.5 were used for further analysis (Schroeder et al., 2006). Total RNA (1 µg) was reverse-transcribed with oligo-dT primers using SuperScript IV (Invitrogen, Carlsbad, CA, United States). For validation, the following sets of TaqMan probes (Thermo Fisher Scientific; Waltham, MA, United States) were used: galanin (Gal, TaqMan Assay Mm00439056_m1), galanin-like peptide (Galp, TaqMan Assay Mm00626135_m1), galanin receptor 1 (Galr1, Mm00433515_m1), galanin receptor 2 (Galr2, Mm00726392_s1), and galanin receptor 3 (Galr3, Mm00443617_m1). The qRT-PCR reaction was performed in triplicate with TaqMan Gene Expression Master Mix (Applied Biosystems), according to the manufacturer’s protocol (Invitrogen, Carlsbad, CA, United States) using the Applied Biosystems 7900HT Real-Time PCR System. Cycle threshold (Ct) values were normalized using glyceraldehyde-3-phosphate dehydrogenase (Gapdh) (TaqMan chemistry, Applied Biosystems) as a standard.
Isolated liver left median lobes were stored in the RNAlater™ stabilization solution and maintained at −20°C for further qRT-PCR analysis. TRI reagent (Sigma-Aldrich, Prague, Czech Republic) was used to homogenize livers that were then treated consequently with chloroform, ice-cold isopropanol, and ice-cold 75% ethanol and centrifuged to obtain RNA pellets (Arora et al., 2023). Concentrations of extracted RNA were measured using a NanoReady Micro UV-Vis Spectrophotometer (LifeReal) and were reverse transcribed using a LunaScript RT SuperMix (New England Biolabs), following the manufacturer’s protocol. Furthermore, cDNA was subjected to quantitative PCR using the CFX Connect™ Real-Time PCR Detection System (Bio-Rad), following the Luna Universal qPCR Master Mix (New England Biolabs) protocol, along with the primers listed in Table 2. The data were analyzed using CFX Maestro™ software (Bio-Rad Laboratories). Relative quantification was performed using Livak’s–Schmittgen’s ∆∆Ct method (Livak and Schmittgen, 2001).

Table 2. List of the primers used for the qRT-PCR analysis of liver expression of selected genes.
2.9 Western blotAs described previously (Arora et al., 2023), the liver samples were homogenized and lysed in RIPA lysis buffer with added protease and phosphatase inhibitors. Equal amounts of lysate protein, specifically 30 μg, as determined by the Pierce™ BCA Protein Assay Kit (Thermo Scientific™), and PageRuler Prestained Protein Ladder (# 26616, Thermo Fisher Scientific, Czech Republic) were subjected to Mini-PROTEAN®TGX Stain-free™ 4%–20% precast gels (# 456-1093, Bio-Rad, Czech Republic) and then transferred electrophoretically onto a methanol-activated Wet Immobilon E (0.45 µm) nitrocellulose membrane. The membranes were blocked by incubating with Tris-buffered saline containing 5% bovine serum albumin (BSA) and 0.1% sodium azide for 30 min at room temperature. Subsequently, the membranes were incubated with primary antibodies overnight at 4°C. The primary antibodies comprised the rabbit anti-SREBP1 polyclonal antibody (1:1,000 dilution, # PA1-337, Invitrogen, through Thermo Fisher Scientific, Czech Republic), rabbit anti-GalR2 polyclonal antibody (1: 400 dilution, # bs-11527R, Bioss Antibodies, through iBioTech, Czech Republic), rabbit anti-HRPT1 monoclonal antibody (1: 1,000 dilution, # A8783, ABclonal Technology), and rabbit anti-beta2-microglobulin monoclonal antibody (1: 1,000 dilution, # 59035, Cell Signaling Technology™). On the next day, the membranes were washed in TBST buffer and incubated with goat anti-rabbit polyclonal IgG and horseradish peroxidase-conjugated antibody (1: 5,000-1: 15,000 dilutions, # ADI-SAB-300-J, Enzo® Life Sciences, through iBioTech, Czech Republic) in 5% non-fat milk blocking solution at room temperature for 1 h. The protein bands on the membranes were visualized via SuperSignal® West Pico Chemiluminescent Substrate (Thermo Scientific™ through GeneTiCA s.r.o., Prague, Czech Republic) by using the ChemiDoc™ MP imaging system (Bio-Rad, Czech Republic). The band intensities of SREBP1 and GalR2 were quantified using ImageJ software (National Institutes of Health, Bethesda, MD, United States) and normalized to the respective house-keeping protein (HRPT1 and β2-microglobulin) and, subsequently, to the corresponding negative control group.
2.10 HistologyThe heart and liver tissues were fixed in 4% paraformaldehyde and then embedded in paraffin, cut into 7–8-µm-thick sections, and stained with hematoxylin–eosin (HE) or Sirius red. Liver samples of the right median lobe were scored for MASLD and fibrosis. MASLD was scored according to the grading system specifically established by Liang et al. for rodent MASLD models using samples stained with HE (Liang et al., 2014). In brief, steatosis was determined by analyzing hepatocellular vesicular steatosis, namely, macrovesicular steatosis, microvesicular steatosis, and hepatocellular hypertrophy (each scored 0–3). Macrovesicular and microvesicular steatosis were evaluated separately, according to its severity, based on the percentage of total area affected. Hepatocellular hypertrophy, which is defined as the enlargement of cells to more than 1.5 times the normal diameter of hepatocyte, was also assessed based on the percentage of total area affected as well. Inflammation was assessed by counting the number of inflammatory foci present per field, with a focus being a cluster of five inflammatory cells. Five different fields were counted, and their average was then rated into the four categories (score 0, 1, 2, and 3) (Liang et al., 2014). Two key features of MASH, steatosis (score 0–9) and inflammation (score 0–3), were used to calculate the total MASLD score (ranging from 0 to 12 score). If the total steatosis score was 0, MASLD was not diagnosed, regardless of inflammation. MASLD was diagnosed if steatosis was present. Finally, MASH was diagnosed if both steatosis and any inflammation were observed (Liang et al., 2014). Liver fibrosis was identified using 8-µm slides stained with Sirius red (SR) dye and scored according to Kleiner et al. (2005). This liver fibrosis classification system recognizes five stages, namely, stage 0 (no fibrosis), stages 1A/numerically 1, 1B/1.33, and 1C/1.67 (representing mild and moderate perisinusoidal fibrosis and portal/periportal fibrosis, respectively); stage 2 (both perisinusoidal and portal/periportal fibrosis); stage 3 (bridging fibrosis); and stage 4 (cirrhosis). Liver tissue sections were analyzed using a Leica DMLB microscope equipped with a Leica MC170 HD camera. One representative HE-stained section was scored for steatosis and inflammation (Liang et al., 2014), and one representative SR-stained section was scored for fibrosis in each specimen (Kleiner et al., 2005). To exclude differences in individual subjective scoring, all liver samples were scored by the same trained “blinded” histologist throughout the study (Arora et al., 2023).
Some samples of the heart were immediately fixed in 4% paraformaldehyde, cryoprotected with sucrose, embedded into the optimal cutting temperature compound, frozen at −20°C, and stored until further use. For the indirect immunofluorescence method, 7-µm-thick cryosections were used. After thawing and washing in PBS, non-specific antibody-binding sites were blocked with 5% goat serum in PBS. In a pilot study, we used three different primary antibodies: polyclonal rabbit anti-GalR1 (#AGR-011), anti-GalR2 (#AGR-012), and anti-GalR3 (extracellular) (#AGR-013) (all from Alomone Labs, Israel), to screen for positivity in mouse hearts. Interestingly, immunoreactivity was detected only for GalR1. Therefore, other sections were incubated only with polyclonal rabbit anti-GalR1 antibody (Cat. No. LS-C831302, LS Bio, through EXBIO Prague, Czech Republic) diluted 1: 1,000 in PBS + 1.5% normal goat serum overnight at 4°C. For visualization, a secondary goat anti-rabbit IgG biotin antibody (Agilent) diluted 1:400 in the PBS + 5% normal goat serum was applied to sections for 30 min at room temperature. Visualization was carried out using the avidin-biotinylated peroxidase complex (VECTASTAIN ABC Elite Kit, Vector Laboratories) and finally DAB (Agilent) as a substrate.
2.11 Determination of TNF-αTNF-α was estimated using customized ELISA kits, as described in the Supplementary Material.
2.12 In vitro MASLD modelThe palmitic acid (PA)-induced primary hepatocyte lipotoxicity model, as we introduced previously (Arora et al., 2023), is described in detail in the Supplementary Material.
2.13 Statistical analysisNormal distribution of the data was checked using the Shapiro–Wilk test. To compare the differences between groups, one-way or two-way ANOVA with the post hoc Bonferroni test, whenever appropriate, was used. To compare histopathological scores between the STD, WD, and WD+CEL groups, the Kruskal–Wallis test with the post hoc Dunn test was used. Student’s t-test with adjusted p-values was used for pair-wise comparisons. The results of the variables’ data are expressed as the mean with a respective standard deviation (SD). Unless otherwise indicated in the legend of a specific figure, the numbers (n) of all values scored correspond to the number of mice in each group, exactly as presented in Table 1. The differences were considered statistically significant if p < 0.05. In the graphs and the result section of in vivo experiments, there are significant differences only between negative (STD) and positive (WD) controls and between positive controls (WD) and CEL treatments (CEL+WD) presented. Statistical analyses and data visualization were performed using GraphPad Prism version 8.0.0 for Windows (GraphPad Software, San Diego, California, United States).
3 Results3.1 The effect of celastrol treatment on mouse's body, fat and liver weight, and food intakeWe successfully adopted WD/FG-induced obesity and MASLD/MASH in C57BL6J male mice (Arora et al., 2023), as evidenced by the progressive increase in body weights (Supplementary Figure S1), liver weight, and fat-to-body weight ratio in the positive control groups of both sets of experiments (Figure 2). CEL treatment (i.e., CEL + WD group) significantly decreased mouse body weights after 1 week of treatment when compared to the body weights of the positive control (i.e., WD group) in both sets of experiments. This weight loss persisted until the end of the experiment (Figures 2A, B). CEL significantly reduced food consumption and energy intake compared to positive controls, which was more pronounced during the first 2 weeks of the treatment (Supplementary Figures S2; Figures 2C, D, respectively). CEL significantly decreased the liver weight in both sets of experiments (Figure 2E). The absolute amount of white intra-abdominal plus epididymal fat tissue and fat-to-body weight ratios was also significantly decreased by CEL throughout the study (Figure 2F). As the absolute heart weights were not modified throughout the groups and sets, the heart-to-body weight ratio was significantly decreased in both positive controls and completely restored by CEL during set 1 (Figure 2G).
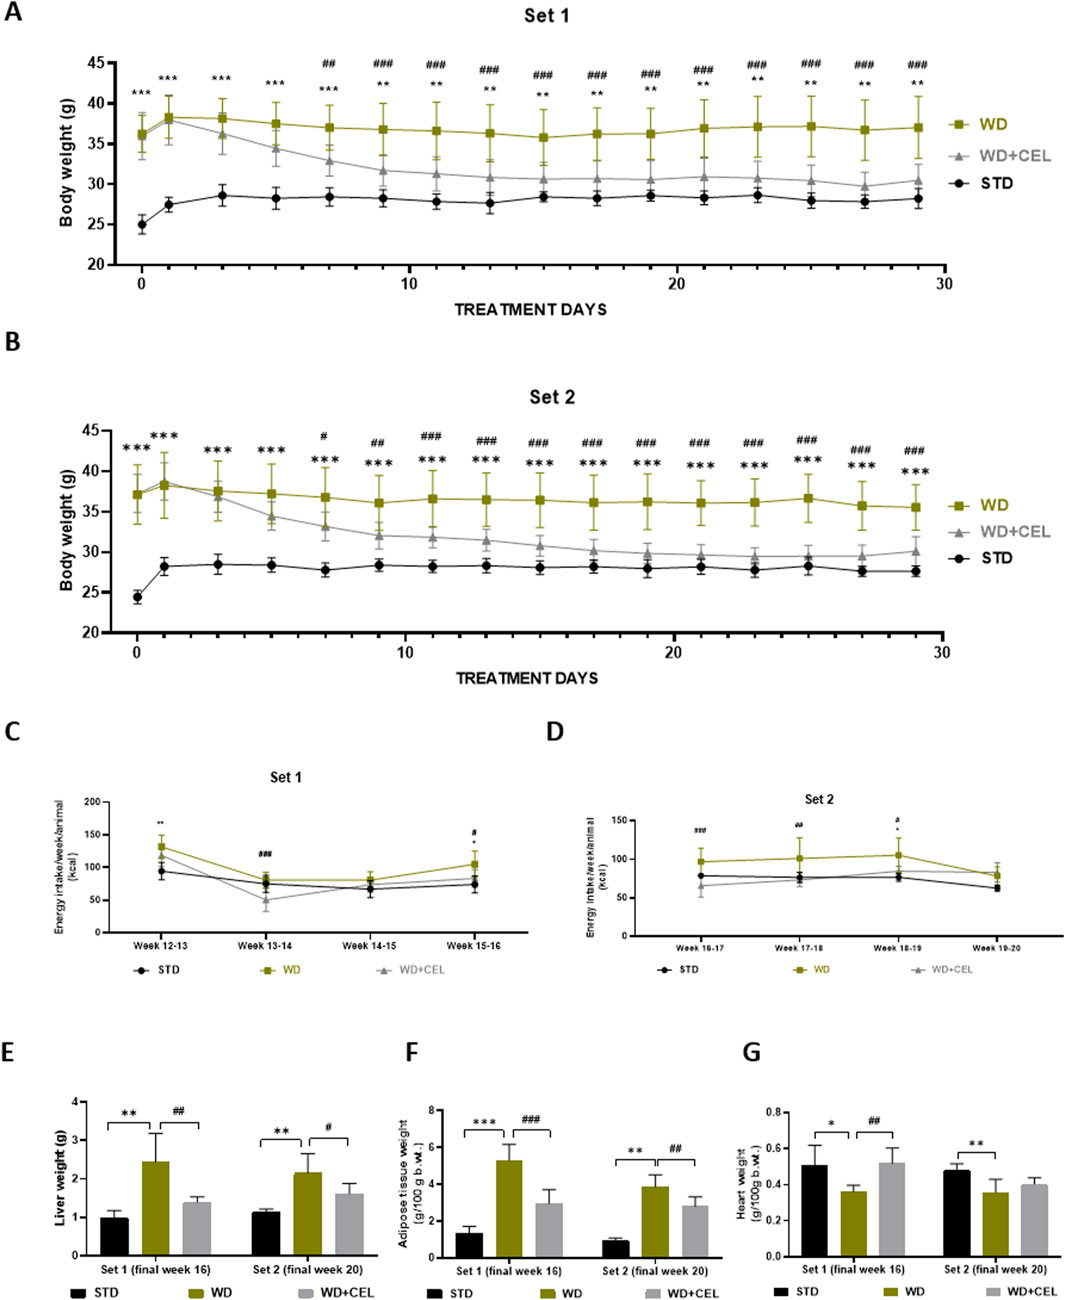
Figure 2. Effect of 4-week celastrol (CEL) treatment on mouse body and liver weight, energy consumption, and adipose tissue-to-body and heart-to-body weight ratios in each set of in vivo experiments. (A) Each second-day body weights of the experimental set 1 mice during weeks 12–16 (note that the first measurement was taken after 12-h fasting). (B) Each second-day body weights of the experimental set 2 mice during weeks 16–20 (note that the first mouse weighing was done after 12-h fasting). (C) Final weekly energy consumption per mice of set 1 (measured during weeks 12–16). (D) Final weekly energy consumption per mouse of set 2 (measured during weeks 16–20). (E) Liver weight. (F) Ratio of abdominal plus epididymal fat weight to total body weight. (G) Heart-to-body weight ratio. Data are expressed as means ± SD (n = 3 for negative controls, n = 7–8 for positive controls and CEL treatment), where **p < 0.01, ***p < 0.001, and ****p < 0.001 when comparing respective positive control (WD group) against negative control (STD group) and #p < 0.05, ##p < 0.01, ###p < 0.001, and ####p < 0.001 when comparing CEL treatment (WD+CEL group) against positive control, as assessed by one-way (E–H) or two-way (A–D) ANOVA with the post hoc Bonferroni test.
3.2 The effect of celastrol treatment on mouse glycemia and serum liver and kidney biochemistry markersAt the end of experimental set 1 (i.e., week 16), mice fed WD/FG showed an elevated overall OGTT curve, as evidenced by the significantly increased glycemic AUC that was substantially reduced by CEL (Figures 3A, C). The same significance was also detected for 12-hour fasting glucose levels (Figure 3D). At the end of experimental set 2 (i.e., week 20), only 12-hour fasting glycemia was remarkably elevated in positive controls (Figures 3B, D).
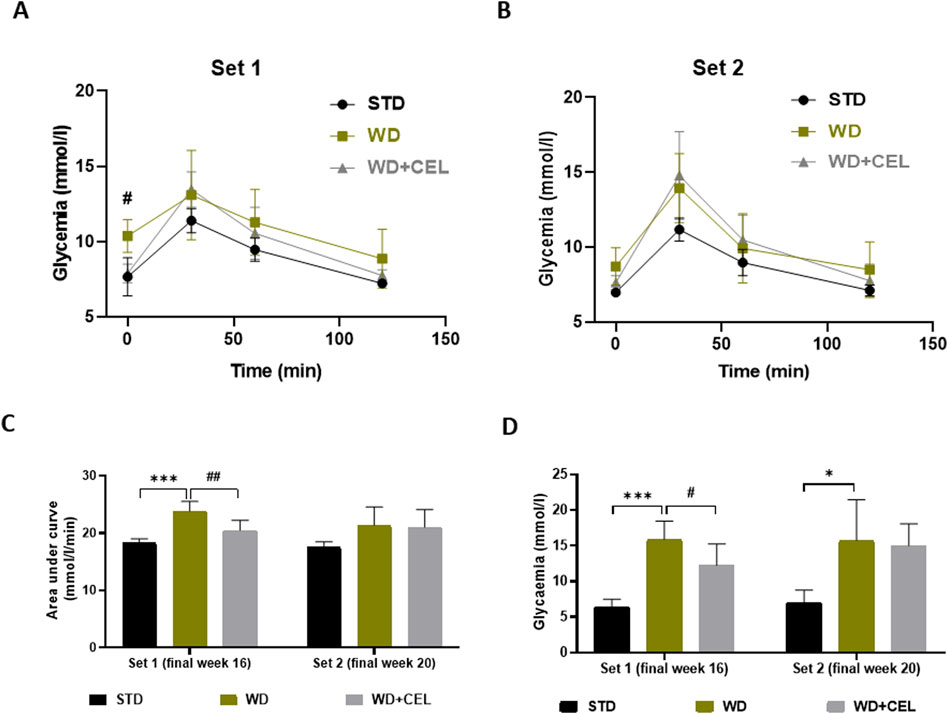
Figure 3. Effect of celastrol (CEL) on serum glucose levels in each experimental set of WD/FG-induced obesity and MASLD/MASH in mice. (A) Oral glucose tolerance test (OGTT) glucose levels at week 16 of set 1. (B) OGTT glucose levels at week 20 of set 2. (C) Area under the curve of OGTT glycemia calculated using the trapezoidal rule. (D) Terminal 12-h fasting serum glucose levels. Data are expressed as means ± SD (n = 3 and 7–8/group as noted in Table 1), where *p < 0.05, **p < 0.01, and ***p < 0.001 compared to the respective positive control (WD group) against negative control (STD group) and #p < 0.05 and ##p < 0.01 compared to CEL treatment (WD+CEL group) against positive control, as assessed by one-way (C, D) or two-way (A, B) ANOVA with the post hoc Bonferroni test.
CEL treatment significantly reduced or displayed a tendency to drop (not statistically significant, n.s.) all liver enzyme activities at week 16 or week 20 (Figures 4A–C). Serum albumin comprises an essential endogenous protein synthesized by the liver. Moreover, the decrease in the serum albumin concentration is suggested to be an essential clinical predictor for MASLD-associated hepatic damage (Kawaguchi, K. et al., 2021). In our study, WD/FG-induction displayed a progressive significant decrease in serum albumin levels, which were highly significantly further decreased by the CEL treatment (Figure 4D). Additional decline could be caused by the very high affinity of CEL to serum albumin, which can interfere with the colorimetric assay method (especially with using bromocresol green, as in our case) to estimate the albumin concentration (Zhang et al., 2009; Fan et al., 2022). A significant reduction of serum urea was also seen in all positive controls against negative controls, probably due to decreased liver synthesis (Arora et al., 2023). Serum creatinine levels decreased with time (e.g., animal age) but were not affected by WD/FG. The CEL treatment did not produce any further alterations in serum urea and creatinine levels at any time point, indicating its safety for the kidney (Figures 4E, F).
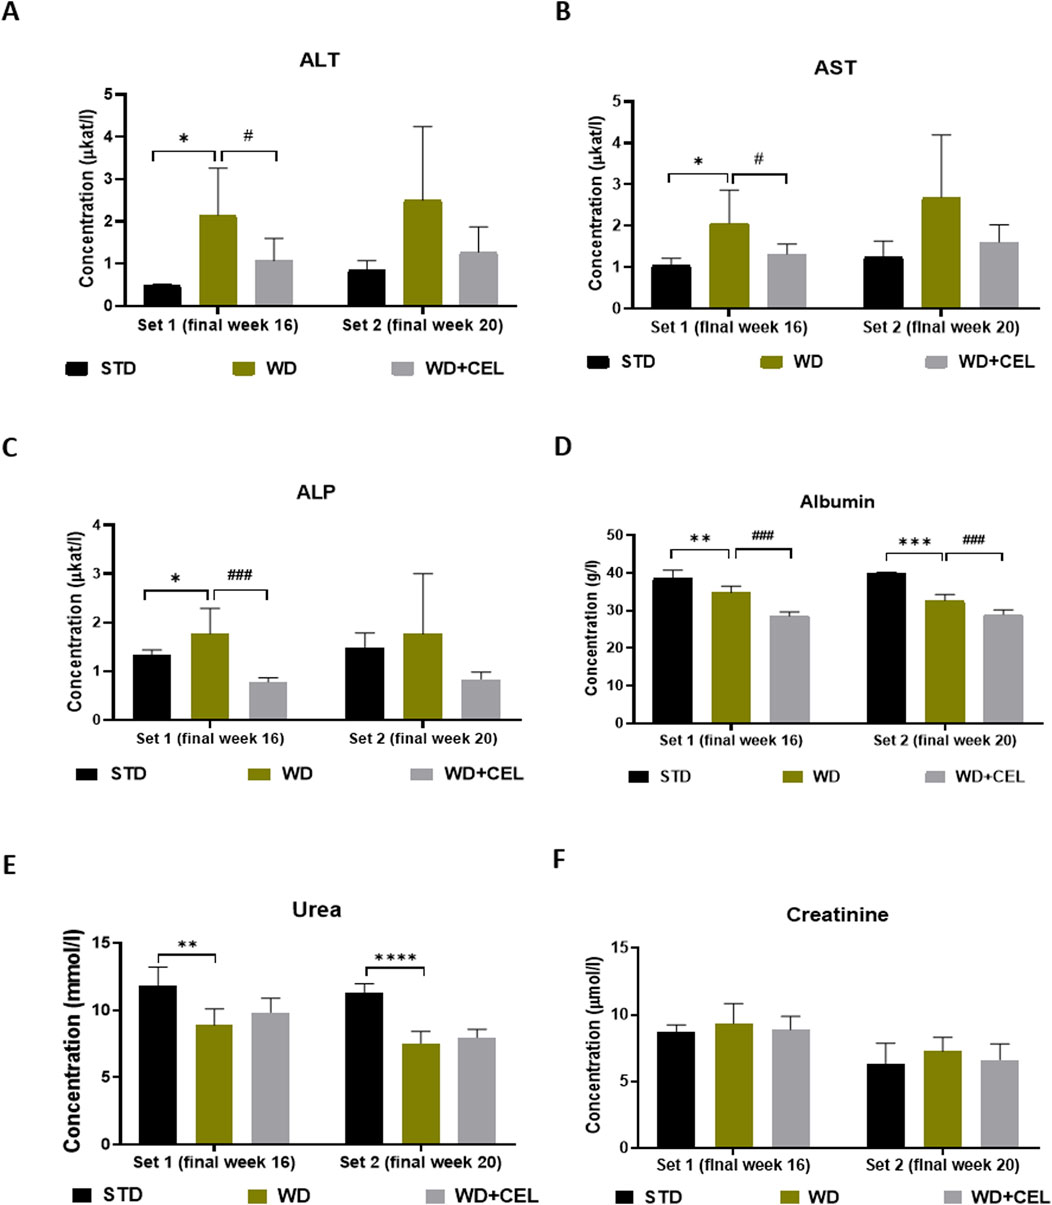
Figure 4. Effect of celastrol (CEL) treatment on biochemical serum markers of liver and kidney functions in each experimental set of WD/FG-induced obesity and MASLD/MASH mouse model. (A) serum ALT, (B) serum AST, and (C) serum ALP catalytic activity concentrations, (C) serum ALP levels, (D) serum albumin levels, (E) serum urea levels, and (F) serum creatinine levels. Data are expressed as means + SD (n = 3 and 7–8/group, as noted in Table 1), where *p < 0.05, **p < 0.01, ***p < 0.001, and ****p < 0.001 compared to the positive control (WD group) against the respective negative control (STD group) and ###p < 0.001 compared to CEL treatment (WD+CEL group) against the positive control, as assessed by one-way ANOVA with the post hoc Bonferroni test.
3.3 The effect of celastrol treatment on serum lipids, liver triglyceride content, oxidative stress markers, and TNF-alphaIn both sets of in vivo experiments, the atherogenic WD/FG diet significantly enhanced the concentrations of serum total cholesterol when compared to negative controls. CEL treatment decreased this serum lipid marker significantly only at the end of set 1 (Figure 5A). Although serum triglyceride levels were not affected by either WD/FG or WD/FG + CEL (Figure 5B), the liver TG content was highly significantly increased in positive controls and, conversely, remarkably (p < 0.05) reduced after CEL treatment in both sets (Figure 5C).
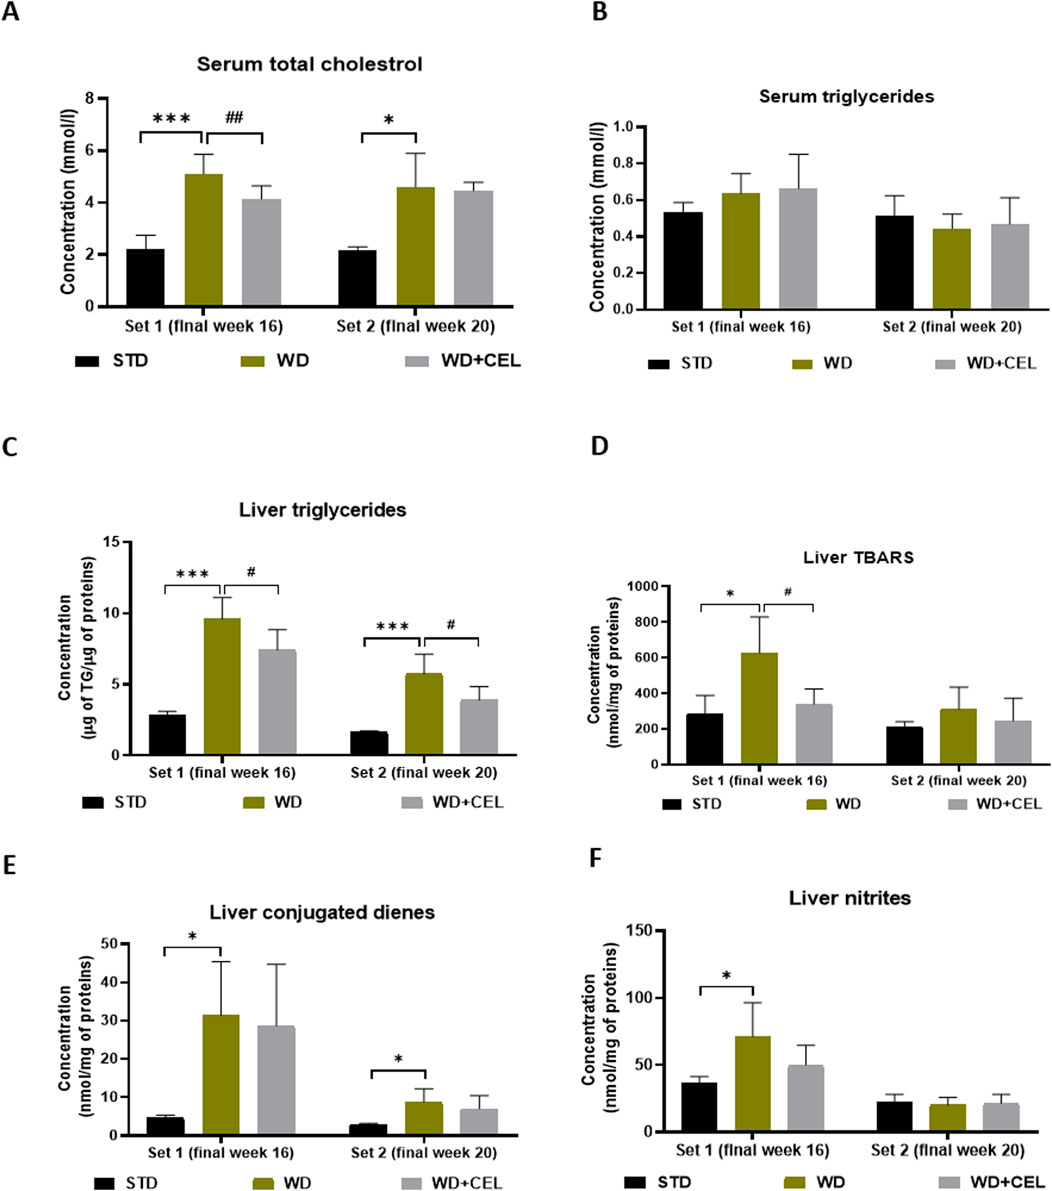
Figure 5. Effect of celastrol (CEL) treatment on concentrations of mouse serum total cholesterol (A), serum triglycerides (B), liver triglyceride (TG) content (C), liver TBARS (D), liver conjugated dienes (E), and liver nitrites (F) in both sets of the in vivo experiment. Data are expressed as means + SD (n = 3 and 7–8/group, as noted in Table 1), *p < 0.05 and ***p < 0.001 compared to the respective positive control (WD group) against the negative control (STD group) and #p < 0.05 and ##p < 0.01 compared to CEL treatment (WD + CEL group) against the positive control, as assessed by one-way ANOVA with the post hoc Bonferroni test.
Animals in the positive control (i.e., WD) group displayed significantly enhanced concentrations of liver TBARS, conjugated dienes, nitrites, and TNF-α at the end of week 16 (i.e., set 1) when CEL treatment was able to significantly reduce only TBARS. At the end of week 20 (i.e., set 2), WD/FG alone significantly increased only the conjugated diene content in the liver, while CEL had no additional effect on any of the liver oxidative stress markers and TNF-α (Figures 5D–F; Supplementary Figure S3, respectively).
3.4 The effect of celastrol treatment on the liver morphology of diet-induced MASLD/MASHMacroscopically, there was a noticeable difference between the negative and positive control livers, which were hypertrophied and much lighter due to fat accumulation (Supplementary Figure S4). The positive controls displayed highly significantly elevated total steatosis, inflammation, MASLD activity, and fibrosis scores in mouse livers of both sets, confirming MASH. However, the overall fibrosis caused in mouse fed on WD/FG was low and reached only that of stage 1B in average (i.e., 1.67), representing moderate perisinusoidal fibrosis at the microscopic level. At the end of week 16, CEL significantly reduced liver steatosis, inflammation, and the total MASLD activity score and ameliorated liver morphology. CEL treatment displayed a similar pattern of slight reduction (n.s.) in all histological scores and overall liver morphology at the end of week 20 (Figure 6), when the liver became harder with the disorganization of typical microarchitecture, prevailing macrovesicular steatosis and increasing the number of fibroblast-like cells. Moreover, the development of liver tumors was noted in one positive control case of set 2 (Supplementary Figure S4).
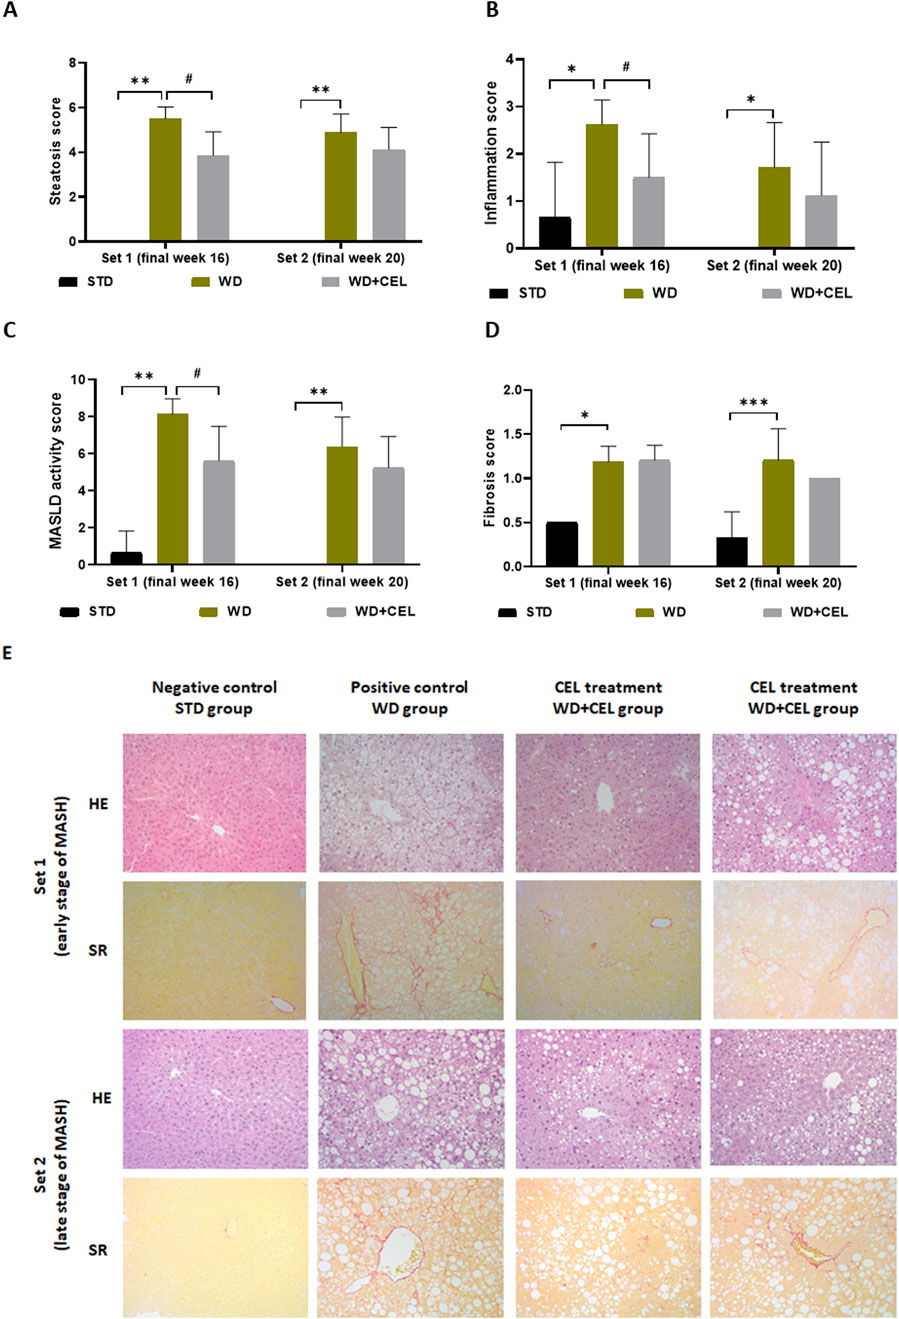
Figure 6. Impact of celastrol treatment on mouse MASLD/MASH histopathological scoring and staging of the experimental set 1 and set 2 (representing the end of weeks 16 and 20, respectively), including (A) total cell macrovesicular, microvesicular, and hypertrophy liver steatosis score, (B) total liver inflammation score, (C) MASLD activity score, and (D) liver fibrosis score. The data are expressed as the means + SD, where *p < 0.05, ***p < 0.01, and **p < 0.01 when comparing the positive control (WD group, n = 7–8) to the respective negative control (STD group, n = 3) and #p < 0.05 when comparing CEL treatment (WD+CEL, n = 8) to the positive control, as assessed by the Kruskal–Wallis test with post hoc Dunn’s multiple comparison test. Note: some data are missing for negative controls as the scoring values were zero for all three samples. Similarly, some SDs are missing as the data were completely equal for all livers in the respective group, that is, the SDs were zero. (E) Example images of liver sections used for histopathological evaluation after staining with hematoxylin–eosin (HE) or Sirius red (SR) at a magnification of ×200.
3.5 The effect of celastrol treatment on MASLD/MASH-related liver gene expression in diet-induced obesity of miceSome genes illustrated variation during the progression from steatosis to hepatitis at different time points, while other genes indicated the same pattern in both sets. The expression of the gene Ppargc1a, which encodes a transcriptional coactivator PGC-1α affecting energy metabolism, was downregulated by WD/FG at both sets; however, it was significant only at the end of week 16. On the other hand, CEL significantly upregulated Ppargc1a gene expression only at the end of week 20 (Figure 7A). Similar trends of the atherogenic diet and CEL were observed for the Crtc2 gene-encoding CRTC2 protein, which is also involved in glucose metabolism, lipogenesis, and other various cell processes (Figure 7B). As CRTC2 can regulate mTOR signaling pathway transduction (Zheng et al., 2023), we also screened for Mtor gene expression. Similar to Crtc2 at week 16, Mtor gene expression was significantly downregulated by WD/FG. On the other hand, it was significantly upregulated by WD/FG at week 20, which was not affected by CEL (Figure 7C).
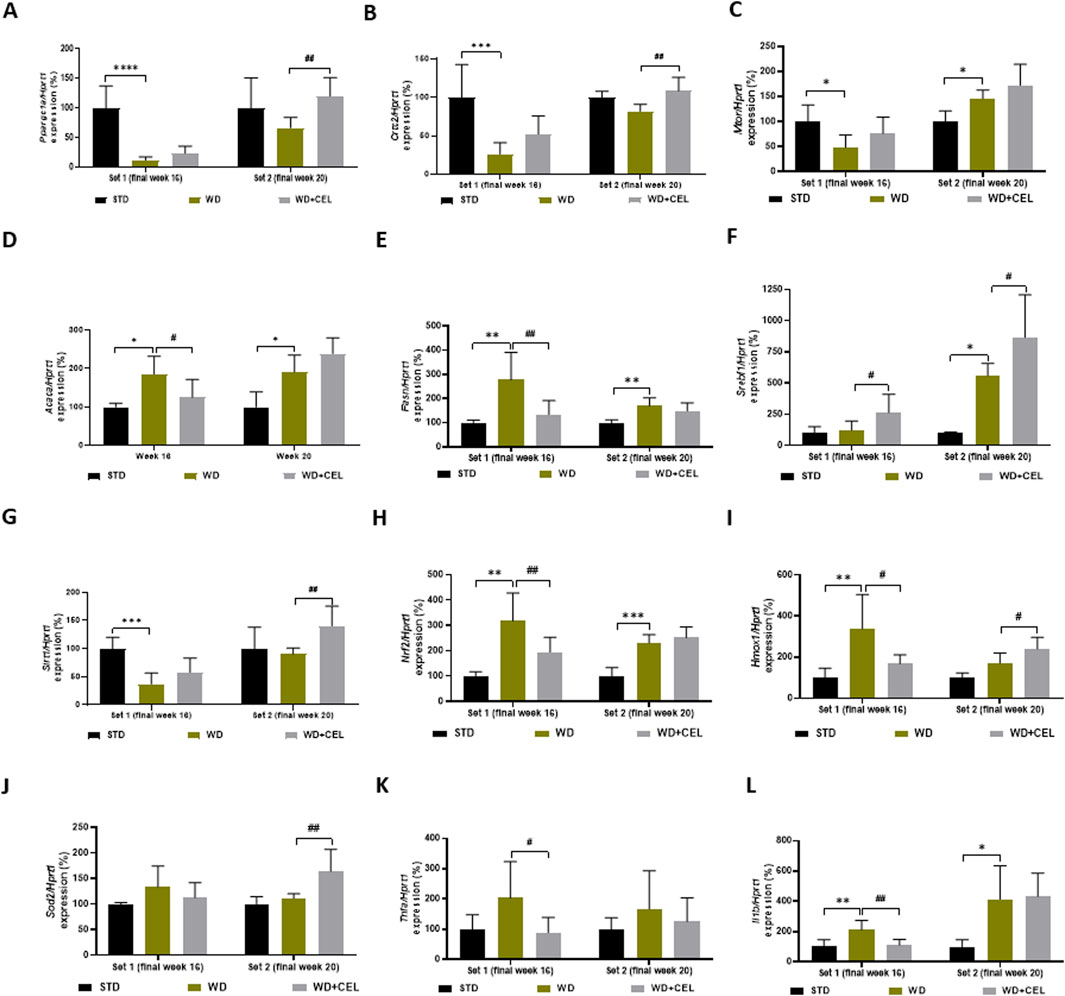
Figure 7. Effect of celastrol treatment on liver expression of selected genes evaluated in each experimental set of WD/FG-induced obesity and the MASLD/MASH mouse model, where (A) Ppargc1a (peroxisome proliferative activated receptor gamma, coactivator 1 alpha), (B) Crtc2 (CREB, cAMP response element-binding protein, regulated transcription coactivator 2), (C) Mtor (mechanistic target of rapamycin kinase), (D) Acaca (acetyl-coenzyme A carboxylase alpha), (E) Fasn (fatty acid synthase), (F) Srebf1 (sterol regulatory element-binding transcription factor 1), (G) Sirt1 (sirtuin 1), (H) Nrf2 (also Nfe2l2, nuclear factor, erythroid derived 2, like 2), (I) Hmox1 (heme oxygenase 1), (J) Sod2 (superoxide dismutase 2, mitochondrial), (K) Tnfa (tumor necrosis factor alpha), and (L) Il1b (interleukin 1 beta) represent specific gene expressions. Data are expressed as means + SD (in percentage of average negative control ∆∆Ct value calculated against the expression of housekeeping gene Hprt1, hypoxanthine phosphoribosyltransferase 1), where *p < 0.05, **p < 0.01, ***p < 0.001, and ****p < 0.0001 compared to the respective positive control (WD group, n = 6–8) against the negative control (STD group, n = 3) and #p < 0.05 and ##p < 0.01 when comparing CEL treatment (WD + CEL, n = 7–8) against the positive control, as assessed by one-way ANOVA.
Gene expression levels of Acaca and Fasn that code for important lipogenic enzymes promoting de novo lipogenesis and adipogenesis were induced in mouse livers of positive controls of both sets. However, CEL-treatment normalized Acaca and Fasn mRNA levels only at the end of week 16. At week 20, CEL further enhanced upregulated Acaca gene expression (Figures 7D, E). Surprisingly, unlike Acaca and Fasn, the expression of the Srebf1 gene was significantly increased only in set 2, and CEL significantly increased its expression in both experimental sets (Figure 7F).
Expression of genes involved in cell survival, senescence, and/or oxidative status (i.e., decreasing oxidative stress), such as Sirt1, Nrf2, Hmox, and Sod2, produced highly variable results. For example, Sirt1 was significantly downregulated by an atherogenic diet at week 16 and remarkably upregulated by CEL at week 20 (Figure 7G). Although Sirt1 should play a key role in activating the Nrf2/ARE (antioxidant response element) signaling pathway and protecting against oxidative stress (Zhuang et al., 2021), the Nrf2 gene was highly significantly upregulated by WD/FG throughout the experiment; however, CEL decreased its mRNA levels remarkably only during set 1 (Figure 7H). Nrf2, a crucial transcription factor, plays a pivotal role in determining the liver’s antioxidant capacity and detoxification status (Shin et al., 2013). Nrf2, among others, coordinates gene expression of Hmox1, which was affected in the same way as Nrf2 only at the end of week 16. Later on, Hmox1 mRNA was further increased by CEL (Figure 7I). Only at the end of week 20, CEL also very significantly increased the otherwise unaffected expression of the Sod2 gene, which codes the critical antioxidant enzyme SOD-2 (Figure 7J).
For the evaluation of the inflammatory pathway, we assessed the liver expression of genes coding TNF-α and IL-1β cytokines. In contrast to liver TNF-α protein levels (Supplementary Figure S3), Tnfa mRNA levels were not affected by WD/FG; however, it was significantly downregulated by CEL only at week 16 (Figure 7K). Gene expression of Il1b was significantly upregulated by the atherogenic diet during both sets, and CEL treatment significantly reversed it only at the end of set 1 (Figure 7L).
3.6 The effect of celastrol treatment on the gene expression of galaninergic system members in the liver and heart ventricle tissues of Western diet-induced obese miceWe realized that the quantitative gene expression of the members of the galanin family in mouse heart ventricles was the strongest for Galr2, followed, in a descending manner, by Gal, Galr1, and Galr3. Galp gene expression was very low and under or at the limit of detectability in all heart ventricle samples; therefore, it was not possible to meaningfully analyze this. In mouse liver tissue, only Galr2 gene expression could be quantitatively evaluated because the expression of other genes (i.e., Gal, Galr1, and Galr3) was very low.
As for specific qRT-PCR results in mouse heart ventricles, there was a highly detectable expression of the Gal gene increasing with age in negative controls, which was further significantly upregulated by the Western-type diet, with the peak expression at weeks 16–19 (Figure 8A). CEL had no additional effect, while FAT significantly downregulated Gal expression (Figure 8B). The expression of the Galr1 gene was lower than that of Gal; however, it exerted a similar pattern (Figure 8C). CEL and FAT addition to WG/FG highly significantly decreased the Galr1 gene expression, which was slightly increased (n.s.) or significantly upregulated by the Western-type diet at the end of weeks 16 and 20, respectively (Figure 8D). In the heart ventricles, there was very high expression of the Galr2 gene, which was relatively stable, concerning the mouse age and significantly upregulated by WD/FG, with the peak expression at weeks 16–20. CEL had no additional effect on this, while FAT significantly downregulated enhanced Galr2 mRNA levels at the end of week 16 (Figures 8E, F). Interestingly, Galr2 gene expression in the mouse liver of set 1 was affected in a completely different manner: it was significantly downregulated by WD/FG, highly significantly increased by CEL, and unchanged by FAT when compared to that in positive controls (Figure 8G). Finally, there was a very low expression of the Galr3 gene, generally in the heart, which was nearly undetectable until week 15, with a peak at week 19 and a remarkable drop at week 21 in both the negative and positive controls. At the end of week 16, Galr3 mRNA levels were borderline detectable and significantly enhanced by WD/FG in heart ventricles, which remained unaffected by CEL; however, they were significantly downregulated by FAT treatment. At the end of week 20, GalrR3 gene expression was significantly upregulated by the addition of CEL to the Western-type diet, of which Galr3 mRNA levels were the same as for the negative control group (Figure 8H).
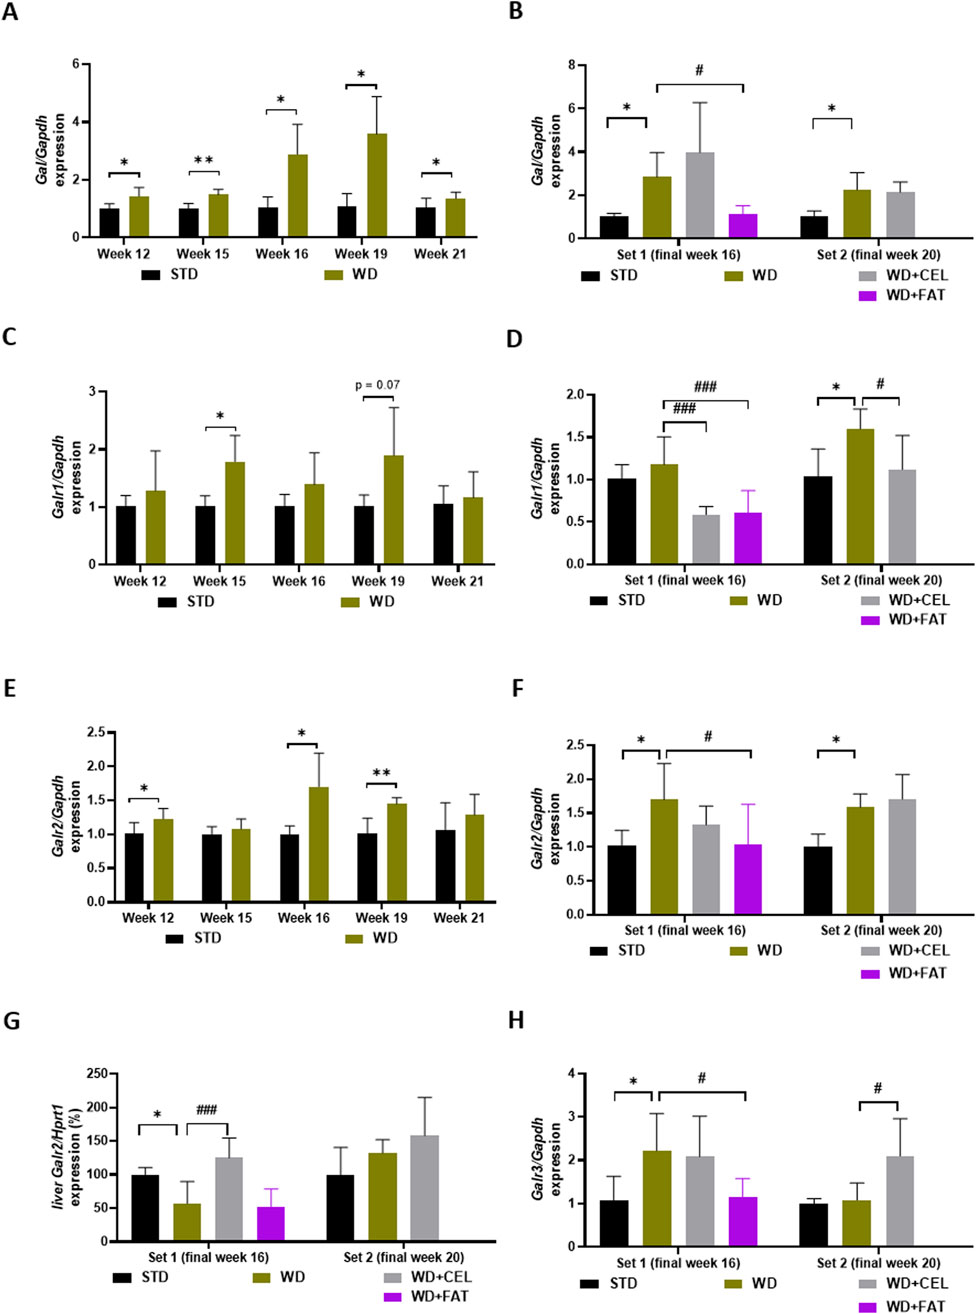
Figure 8. Effect of celastrol (CEL) and fatostatin (FAT) treatment on gene expression of members of the galanin system in mouse heart ventricles (A–F, H) and livers (G) in WD/FG-induced obesity and MASLD/MASH model, where (A, B) Gal (galanin gene), (C, D) Galr1 (galanin receptor 1 gene), (E–G) Galr2 (galanin receptor 2 gene), and (H) Galr3 (galanin receptor 3 gene) represent the specific gene expression of the ex
留言 (0)