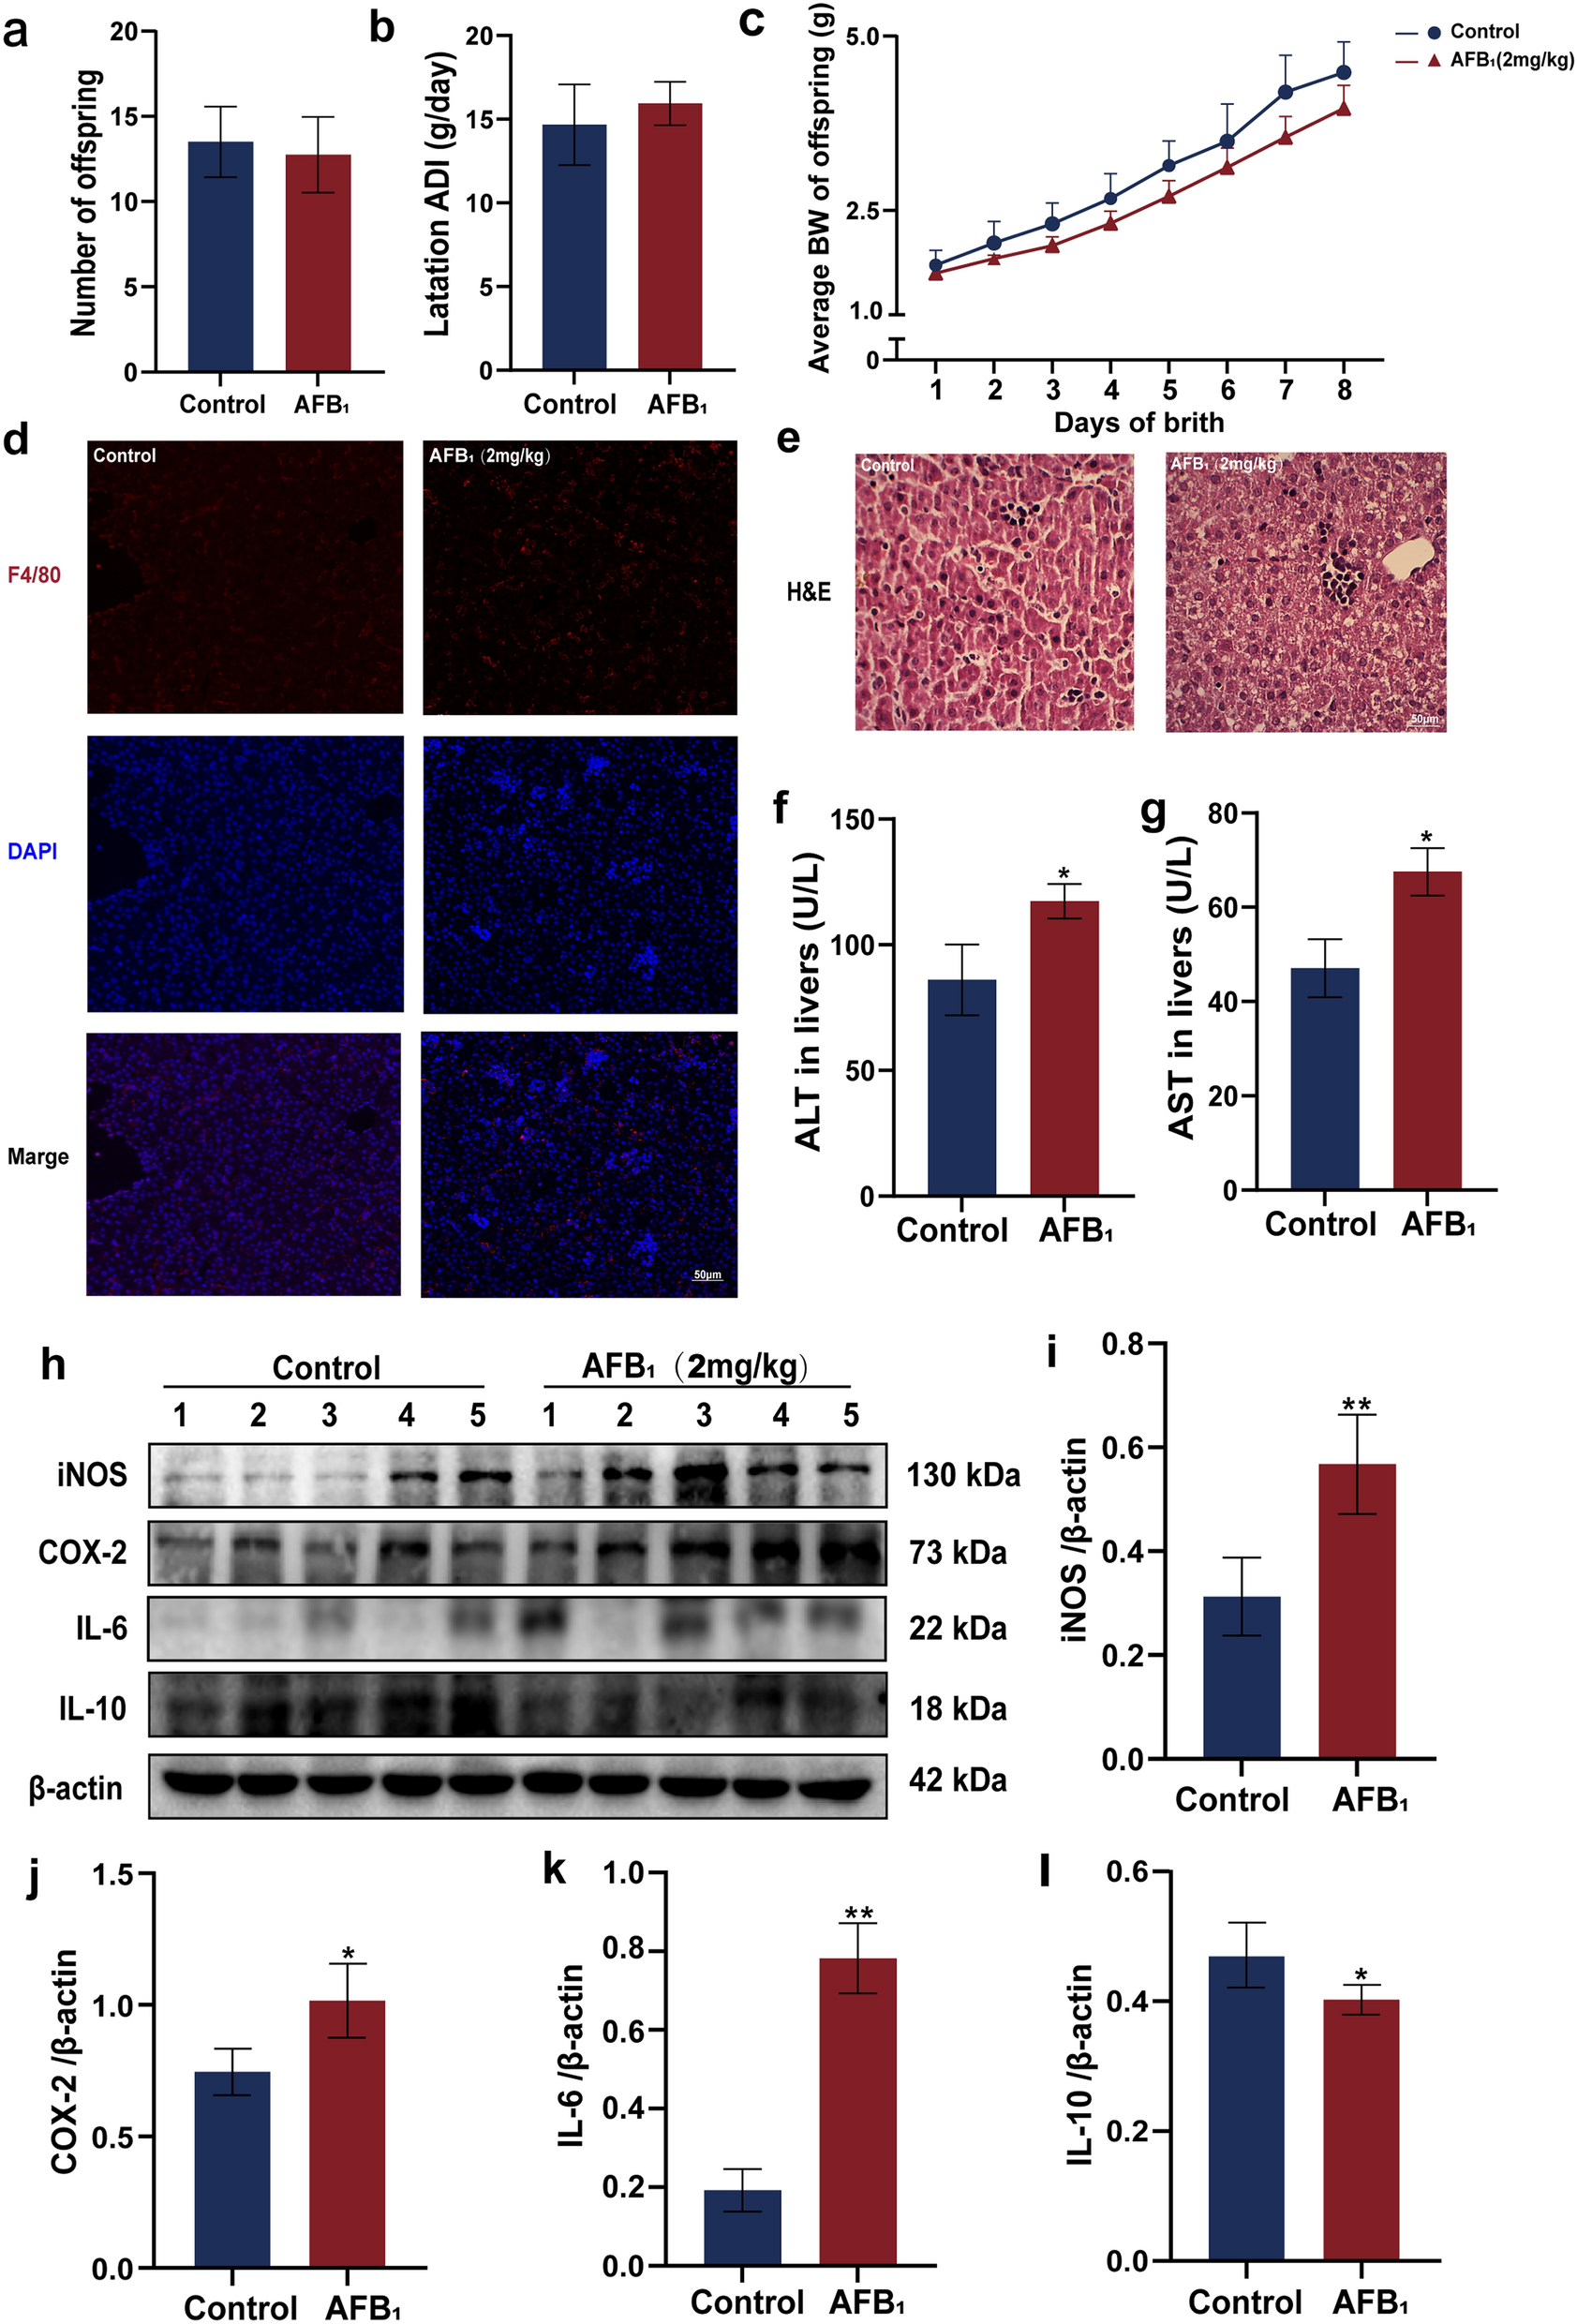
Animals and synchronization
Cryptochrome (Cry) 1/2 heterozygous mice in C57BL/6 J background were generously provided by Aziz Sancar (University of North Carolina, Chapel Hill, North Carolina, USA) and used to obtain Cryptochrome double-knockout (Cry1−/−Cry2−/−, DKO) male mice. The animals were kept in Koc University Research Center for Translational Medicine (KUTTAM) and genotyping was done to determine the knockouts. Wild type male littermates were used as control.
Animals (12–16 weeks old) were housed under 12 h of light- 12 h of dark cycle (LD 12:12) and synchronized for 3 weeks before the beginning of experiments. The mice were kept in constant darkness (DD) throughout the experiments, starting 3 days before the drug administration. All mice received a standard diet and food and water were provided ad libitum. Dim red light (7 lx) was used for experimental procedures during the dark phase.
Experimental design
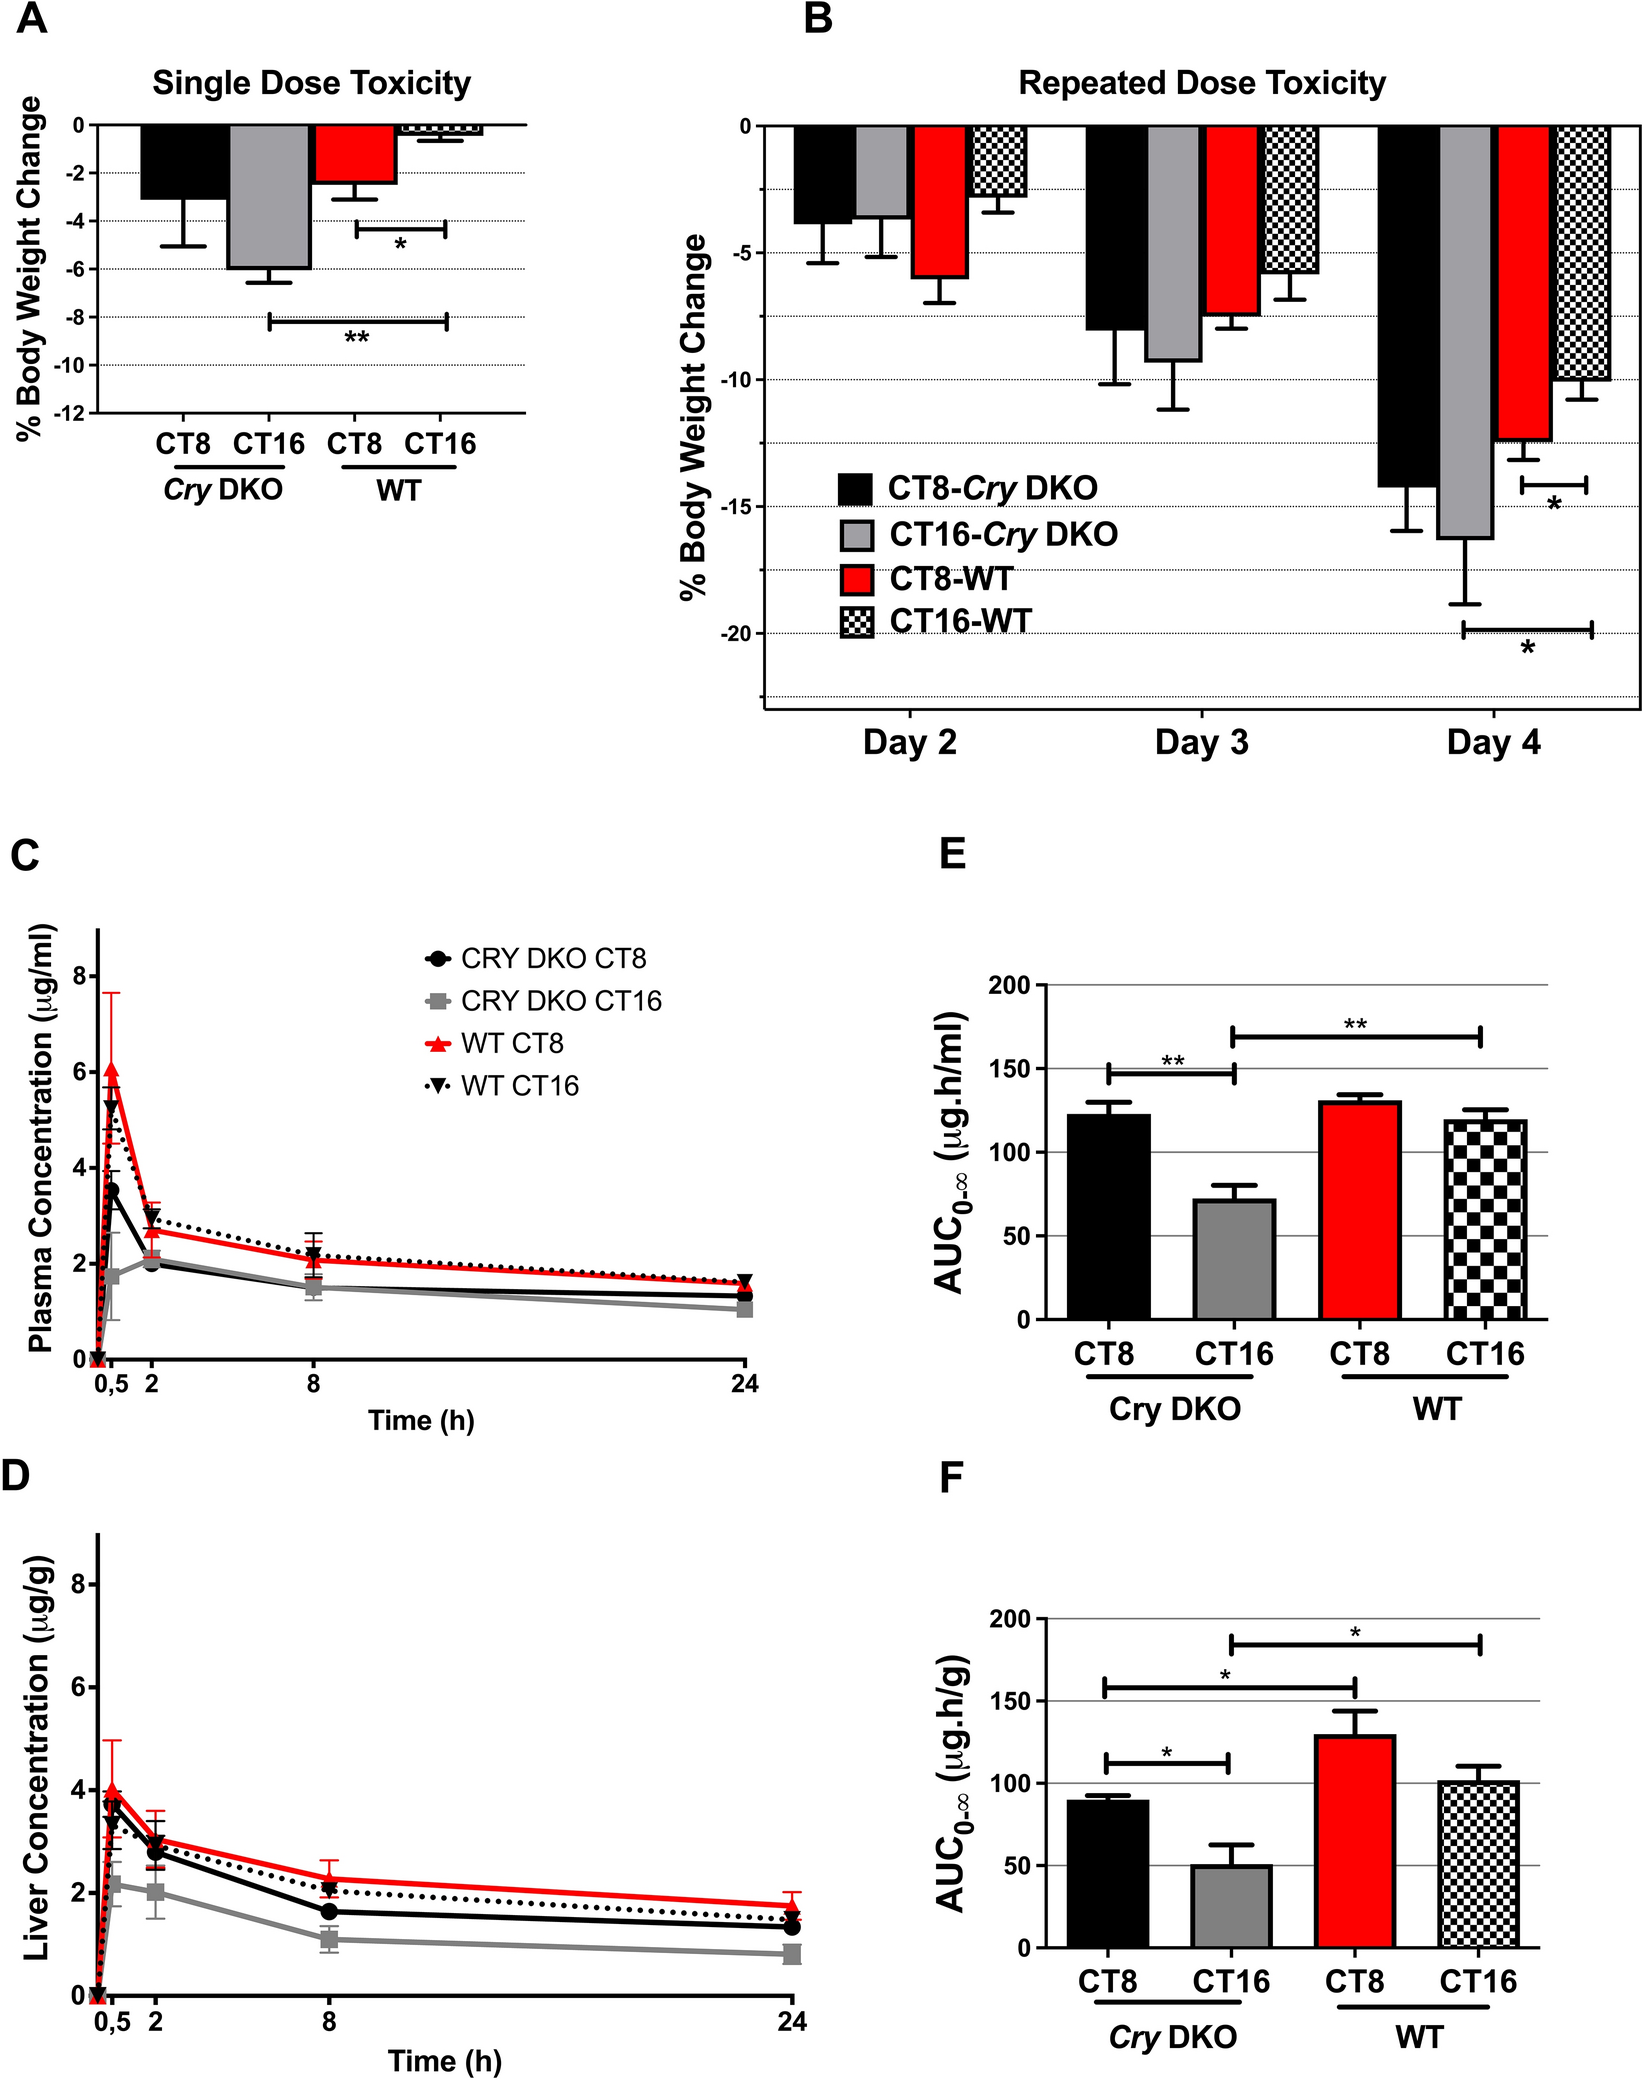
Oxaliplatin (Alfa Aesar, Germany) was diluted in 5% dextrose solution to a final dose of 12 mg/kg before each injection. The experiments were conducted in two arms: single-dose study and repeated-dose study. For single-dose study, oxaliplatin was intraperitoneally injected to the wild-type and Cry DKO male mice as a single dose at CT8 and CT16. The blood samples were collected under isoflurane anesthesia by cardiac puncture at 0.5, 2, 8 and 24 h after drug administration (n = 3–4 for each time point). After cervical dislocation, the livers were quickly removed and snap-frozen in liquid nitrogen. The blood samples were collected in EDTA tubes and the plasma was isolated by centrifugation at 4000 rpm for 10 min. Plasma and liver levels of oxaliplatin were determined by ICP-OES (Inductively coupled plasma-optical emission spectrometry) method as described below.
For repeated-dose study, oxaliplatin (12 mg/kg, i.p.) was given to wild-type and Cry DKO male mice at two circadian times (CT8, CT16) for three consecutive days. Body weight was measured every day as an index of general toxicity. Oxaliplatin-induced body weight change was expressed relative to body weight on the initial treatment day. The mice were sacrificed by cervical dislocation 24 h after 3rd injections (n = 4 for each CT). Blood and liver samples were collected. Hematological evaluation was performed in the blood samples. The liver samples were snap-frozen in liquid nitrogen and stored at − 80 °C until RNA extraction.
RNA isolation and library preparation
Total RNA from liver samples (WT and CRYDKO mice treated with oxaliplatin at CT8 and CT16) were isolated by using RNeasy Mini Kit (QIAGEN, Germany). The quality of amount of RNA was assessed by using Qubit (Thermo Fisher Scientific, USA). 1 µg high quality RNA samples (OD260/280 1.8–2.0) were used to prepare the library for RNA Sequencing analysis. Briefly, adenylated mRNAs were isolated by using Poly(A) mRNA Magnetic Isolation Module (New England Biolabs, USA). Then mRNAs were fragmented, converted to cDNA and second strand synthesis was performed. The 150 bp paired-end sequencing of libraries was carried out via Illumina platform (Macrogen, Netherlands).
Transcriptome analysis
We followed a similar protocol, with some differences, that was published before (Cavga et al. 2019; Emisoglu-Kulahli et al. 2021). Briefly, the quality of sequencing reads was evaluated by using FastQC (Babraham Bioinformatics, UK) program. Trimmomatic (v0.35) was used to clean low-quality bases and adaptor contaminations (Bolger et al. 2014). Star aligner program (v2.5.3) was used to align clean reads to reference mouse genome (GRCm39). To determine differentially expressed genes (DEGs) among genetically different mice and time points, DESeq2 function (adjusted p < 0.05) in R was used (Love et al. 2015). Briefly, sorted reads by the STAR aligner were counted by using HTSeq (htseq-count v. 1.99.2) (Anders et al. 2015). Then, DEGs were calculated by using DESeq2 (Love et al. 2014). Low read counts were filtered by removing total read counts less than 10 across the independent biological samples. Variance stabilizing transformation was used by using vst function in DESeq2 to construct distance-distance matrix and to perform principal component analysis (PCA). Finally, statistically significant fold changes were calculated for genes having p-adjusted values < 0.05. To determine the significantly altered KEGG pathways in which DEGs were involved, ClueGo extension of Cytoscape (3.9.1) was used.
Measurement of oxaliplatin concentrations in mouse plasma and liverChemicals
High-purity nitric acid was used in the ICP-EOS study (Merck, Istanbul, Türkiye). The purity of nitric acid was improved using the Berghof-Acid apparatus additionally. A standard solution of 1000 mg/L concentration was used for the platinum (VHG Labs, Manchester NH, USA). All standard solutions were prepared with ultrapure water obtained using the Elga Ultra-Pure System (Elga, UK). The standard solutions for measurement were prepared by appropriate dilution of these stock solutions on the day of use and stored in high-density polyethylene (HDPE) containers. Pure argon (99.999%) and pure nitrogen (99.99%) were supplied by Habaş, Türkiye. In the study, no glassware was used and all plastic materials were immersed in nitric acid (10%) for at least 24 h to significantly reduce contamination and were thoroughly rinsed with ultrapure water 3 times before use.
Microwave wet decomposition
Determining platinum levels with ICP-OES requires digesting tissue samples into a solution form prior to measurements. First, tissue samples were tared and dry-weighed with heat-resistant plastic ware tubes. Plasma samples were used directly as 100 µl. Prior to being microwaved, tissue samples were homogenized using ultrapure water with a tissue disintegration system (Magna Lyser, Roche, USA) and lyophilized at − 55 °C. 1.9 ml of nitric acid and 3 ml of ultrapure water were added to 100 µl plasma samples and placed in a microwave wet decomposition instrument (Berghoff, Italy) Teflon container. On the other hand, 3 ml of nitric acid and 2 ml of ultrapure water were added to tissue samples, weighed to 100 mg following lyophilization, and placed in Teflon containers. Microwave device parameters: Acid extraction was performed on the samples by applying 130 °C 35 bar for 8 min; 155 °C 35 bar for 5 min with 5 °C increments; 185 °C 35 bar for 12 min with 5 °C increments, 100 °C 35 bar for 5 min with 5 °C increments, and 50 °C 35 bar for 5 min with a sudden decrease.
ICP-OES parameters
For plasma and tissue samples, quantitative analyses of the platinum element were performed on a Perkin Elmer brand Optima 7000DV model ICP-OES (inductively coupled plasma–optical emission spectrometry) instrument using a concentric nebulizer, standard baffled cyclonic spray chamber, alumina injector, and quartz torch. The relative standard deviation was accepted as 10% and analyses with 9 replicates were performed. Instrument precision and accuracy analyses were performed using 0.6, 0.8, 1.0, 2.0, 4.0, and 5.0 μg/L platinum and 1.0 μg/L internal standard (manganese) standards. Calibration was done just before the true samples were analyzed and the stability was determined. The analysis of the samples was started by analyzing the platinum calibration points (5 ppb–100 ppb) with internal standards added to estimate their LODs (Limit of Detection), precision, accuracy, repeatability, linearity, and dynamic range. Instrument parameters: RF power (kW) was 1.3; nebulizer gas flow rate (L min−1) was 0.6; auxiliary gas flow rate (L min−1) was 0.2; plasma gas flow rate (L min−1) was 16.0; sample aspiration rate (mL min−1) was 1.0; platinum element detection wavelengths (nm) were 265,945 and 214,423; argon flow was 8 bar; nitrogen flow was 5 bar. The instrumental detection limit is given in Table S1.
Pharmacokinetic analysis
The pharmacokinetic parameters of oxaliplatin were calculated using the non-compartmental pharmacokinetic analysis method. Peak plasma concentration (Cmax) and time to reach peak concentration (tmax) values were directly obtained from the concentration–time curves. The area under the plasma concentration–time curve from 0 to 24 h (AUC0–24 h) was calculated using the linear trapezoidal rule. The total area under the plasma concentration–time curve from 0 h to infinity (AUC0–∞) was calculated using the standard formula (Concentration at 24 h (C24h)/Elimination rate constant (kel)). The elimination rate constant (kel) was calculated from the terminal points of the concentration–time curve. T1/2 was calculated using the formula ln2/kel. The apparent total clearance (Cl/F) was calculated using the formula Dose/AUCtotal. The apparent distribution volume (Vd/F) was calculated by the formula (Cl/F)/kel.
Statistical analysis
The data were presented as means ± standard error of means (SEM). Statistical analyses were performed using GraphPad Prism 5.00 (GraphPad Software, USA). The statistical significance of differences between groups was evaluated using Student’s t-test. Statistical significance required a p < 0.05.


留言 (0)