
記住我

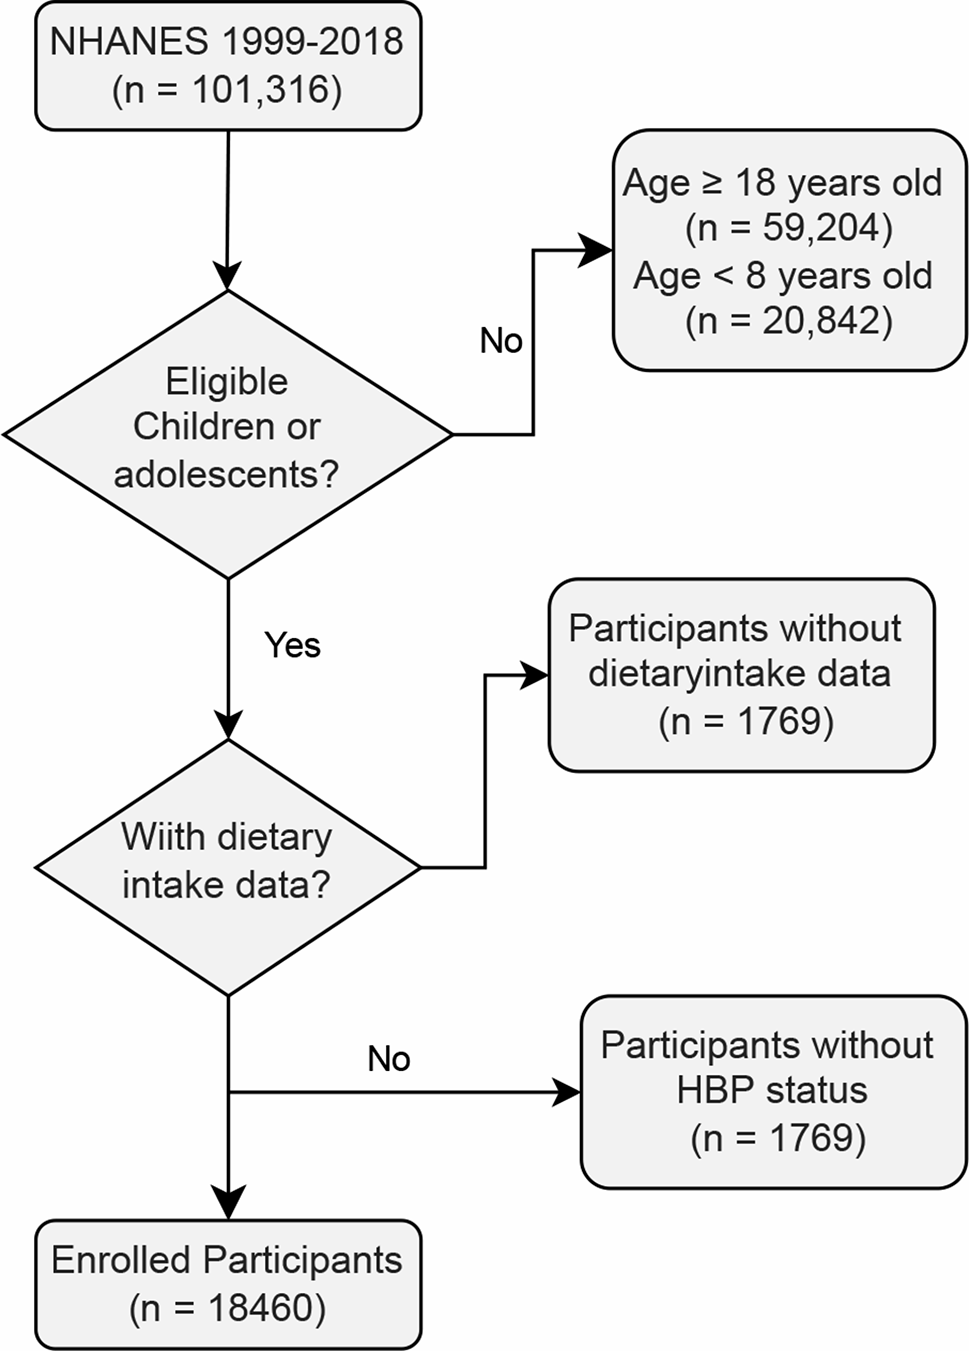


NHANES is a large-scale cross-sectional study conducted nationwide in the United States, aimed at assessing the health and dietary status of American residents [19]. Many studies have utilized its publicly available data (https://www.cdc.gov/nchs/nhanes/index.htm, accessed on 11 November 2022) to explore the risk factors for various diseases, providing significant assistance for clinical diagnosis and treatment. In this study, we obtained data from all 10 complete cycles of NHANES from 1999 to 2018. The protocol number for NCHS IRB/ERC is #2018-01. Clinical trial number: not applicable. By excluding participants over 18 years old and under 8 years old, we successfully screened children and adolescents. We excluded participants without dietary data and those without hypertension status, resulting in a total of 18,460 patients included. The representativeness of the NHANES study population was determined through a stratified sampling approach, where the study sample was designed to closely mirror the broader demographic characteristics of adolescents in the U.S., including age, gender, race/ethnicity, and geographic distribution, etc. We used data from the NHANES database, which is nationally representative and routinely adjusted to account for sampling weights and population characteristics. The total of 18,460 children and adolescents included in the study reflects the weighted representation of approximately 37 million children and adolescents in the U.S. See Fig. 1 for detailed participant recruitment flowchart.
Figure Legends.
Fig. 1
Flowchart of children and adolescents enrollment
DII calculationNutrition methodology working group of the NHANES conducted comprehensive dietary recall interviews for detailed dietary information. The first dietary review was conducted face-to-face in the mobile examination center (MEC) [20]. The second review was conducted via telephone follow-up. For all participants, dietary recall was conducted with the assistance of a parent or guardian. This approach has been commonly used in large-scale surveys such as NHANES to ensure more accurate data collection across different age groups. In this study, we chose the average of two dietary interviews as the representation of an individual’s daily dietary intake, and to calculate DII. Based on previously published literature and its methodologies by Shivappa et al., we calculated the DII [21]. All available food components in the NHANES database were included in the calculation of the DII, and each dietary component was assigned a specific DII score based on its impact on six major inflammatory biomarkers: IL-1β, IL-4, IL-6, IL-10, TNF-α, and CRP. Based on the intake of a specific food component, we can calculate the DII for each food component [21]. To assess the impact of all dietary intakes on inflammation for a participant within a day, the individual DII scores calculated for all food components are summed up to derive the overall DII. A positive score indicates pro-inflammatory potential, while a negative score represents anti-inflammatory potential. In this study, DII was initially studied as a continuous variable to examine its relationship with the occurrence of youth hypertension. Based on the values of DII, we then divided the entire study population into three groups (T1: -3.97-1.53; T2: 1.53–2.95; T3: 2.95–5.42). Further investigation was conducted to explore the relationship between DII and the occurrence of youth hypertension.
Outcome of youth hypertensionThe experienced staff used standardized equipment to measure the blood pressure of each participant. We used the average of multiple measurements as the final blood pressure. According to current clinical guidelines, we defined participants whose blood pressure exceeded the 95th percentile for children and adolescents of the same age and gender as having youth hypertension, serving as the outcome measure for this study [22].
CovariatesNHANES team collected all demographic data used in this study through standardized questionnaires, including age, gender, and race. We obtained the above data directly from the NHANES official website. Body mass index (BMI), derived from dividing weight in kilograms (kg) by height in meters squared (m²). The data for body height and body weight are measured by experienced staff using standardized equipment. According to WHO standards, when BMI falls between 18.5 kg/m² and 24.9 kg/m², we consider the individual to have a normal weight. When BMI falls between 25 kg/m² and 29.9 kg/m², we consider the individual to be overweight. When BMI is greater than 30 kg/m², we consider the individual to be obesity. To calculate the estimated glomerular filtration rate (eGFR), NHANES utilized a formula by the Chronic Kidney Disease Epidemiology Collaboration (CKD-EPI) [23]. This formula integrates variables such as age, sex, race/ethnicity, and serum creatinine (SCr) to accommodate diverse population groups. Fasting blood glucose (FBG), glycated hemoglobin (HbA1c), triglyceride (TG), total cholesterol (TC), low-density lipoprotein cholesterol (LDL-C), high-density lipoprotein cholesterol (HDL-C), hemoglobin (Hb), red blood cell (RBC) counts and hemoglobin were obtained after fasting for at least 8 h by standardized laboratory tests. Anyone with diabetes history was defined as patients with diagnosed diabetes, while those without diagnosed diabetes but with any of the following items was classified as having undiagnosed diabetes: (1) HbA1c level 6.5 or higher, (2) FPG level 7.0 mmol/L or higher, (3) 2-hour oral glucose tolerance test (OGTT) plasma glucose 11.1 mmol/L or higher [24].
Statistical methodsIn this study, all analyses were weighted based on the complex sampling method employed by NHANES. We conducted the study in accordance with the data analysis guidelines provided by NHANES. In this study, continuous variables are presented as means and 95% confidence intervals, while categorical variables are presented as percentages and 95% confidence intervals. We employed t-tests and chi-square tests to conduct detailed comparisons of baseline demographic and clinical dat. Weighted multivariate logistic regression analysis was adopted to explore the association of DII with youth hypertension. Moreover, the correlation of DII with youth hypertension was investigated and visualized by restricted cubic spline (RCS) curve. Additionally, we conducted detailed subgroup analyses by stratifying children and adolescents based on different ages, genders, races, and BMI. We performed all statistical analyses using R software version 4.1.6 (http://www.R-project.org, The R Foundation, Vienna, Austria), with statistical significance set at a two-tailed P-value < 0.05.
留言 (0)