
記住我
The dynamic equilibrium between the toxic and therapeutic effects of pharmaceuticals used in the management of liver diseases presents a significant challenge that warrants meticulous examination. With the rising incidence of liver disease, it has become a significant public health concern, leading to 170,000 deaths each year in Europe (Acevedo, 2015). Liver injury (LI), often an early indicator of liver disease, can arise from various etiological factors, including alcohol consumption, infectious agents, immune dysregulation, and adverse drug reactions (Breit et al., 2023; Kirpich and McClain, 2012; Younossi et al., 2023). The pathological features of LI encompass inflammatory cell infiltration, steatosis, and ballooning degeneration of hepatocytes (Zhang et al., 2024b). Clinical presentations of LI encompass abnormal liver function test results, fever, nausea, vomiting, jaundice, and right upper quadrant pain (EASL et al., 2019; Knight, 2005). In the absence of timely intervention, LI may progress to liver failure, ultimately leading to mortality (Niewiński et al., 2020). Current standard therapeutic approaches for LI predominantly include antiviral medications, hepatoprotective strategies, and immunosuppressive agents such as corticosteroids, pioglitazone, and cholestyramine (Devarbhavi et al., 2023). However, these treatments can paradoxically induce drug-induced liver injury (DILI) due to their intrinsic hepatotoxic properties (Katarey and Verma, 2016). This highlights the urgent need to explore more effective and safer alternatives for the management of LI.
2,3,5,4′-tetrahydroxystilbene-2-O-β-D-glucoside (TSG; C20H22O9; MW = 406.38) is a bioactive compound extracted from the dried root of Polygonum multiflorum Thunb., which is a traditional herbal medicine and has garnered significant interest due to its complex nature regarding liver health (Lin et al., 2015a; Liu et al., 2022; Ma et al., 2015). TSG exhibits a dualistic pharmacological profile, acting as both a hepatoprotective and hepatotoxic agent, which is intricately linked to its interaction with multiple signaling pathways and its stereoisomeric forms, namely, cis-SG and trans-SG (Kong et al., 2022; Liu et al., 2022). The hepatoprotective effects of TSG are multifaceted, with its ability to activate the nuclear factor erythroid 2-related factor 2 (Nrf2)/heme oxygenase-1 (HO-1) pathway, a critical cellular defense mechanism against oxidative stress, being paramount (Gao et al., 2020; Yu W. et al., 2020). This activation bolsters the cell’s antioxidant capacity, thereby mitigating liver damage induced by reactive oxygen species (ROS) (Liu et al., 2022; Yu W. et al., 2020). Additionally, TSG is known to modulate the nuclear factor kappa-B(NF-κB) pathway to protect liver tissues, which interacts with phosphatidylinositol 3-kinase (PI3K)/protein kinase B (Akt) and Nrf2 pathways (Elbaset et al., 2024; Lawrence, 2009; Lin et al., 2015b). TSG could potentially counteract LI through the suppression of the NF-κB signaling cascade, which in turn stimulates the Nrf2–HO-1 signaling axis, and dampens the PI3K/Akt/NF-κB pathway (Gao et al., 2020; Lawrence, 2009; Lin et al., 2015b; Wang et al., 2020b; Xiong et al., 2012). However, TSG’s potential to cause liver damage has also been noted, particularly in relation to the peroxisome proliferator-activated receptor (PPAR) pathway, which has complex interactions with Janus kinase (JAK)/signal transducer and activator of transcription (STAT), Nrf2/HO-1, and NF-κB signaling pathways (Christofides et al., 2021; Zhang, 2017). TSG may inhibit Nrf2 activity by suppressing the PPAR/JAK/STAT/Nrf2 axis, while activating NF-κB, leading to LI (Meng et al., 2017; Shao et al., 2024; Zhang, 2017). Several studies suggested that TSG and its isomers, specifically the cis-form and trans-form, may exhibit differential effects on liver health. The cis-isomer, in particular, has been associated with an increased risk of LI, possibly through the inhibition of the peroxisome proliferator-activated receptor γ (PPARγ) pathway, which can exacerbate inflammation and immune responses (Kong et al., 2022; Meng et al., 2017). The trans-isomer, on the other hand, might have a more protective role under certain conditions, although the exact mechanisms are still under investigation (Liu et al., 2022). Furthermore, the duration and dosage of TSG medication are pivotal factors influencing its toxicity and therapeutic efficacy. However, there is a noticeable gap in the literature regarding the precise delineation of the toxic dose range for TSG. Despite the importance of understanding the safe dosage limits, current research has not yet provided a definitive framework for distinguishing the toxic dose thresholds of this medication.
It is crucial to recognize that the hepatoprotective and hepatotoxic effects of TSG may be interrelated and influenced by on various factors, including dosage, duration of exposure, and individual susceptibility. Further research is needed to fully elucidate the mechanisms by which TSG and its isomers influence liver health and to determine the safe therapeutic window for its use in treating liver diseases. Consequently, the objective of this study is to integrate pharmacological techniques to assess the influence of TSG in the development of LI and elucidate the dynamic processes through which TSG exerts its hepatoprotective and hepatotoxic effects.
2 Methods2.1 Data sources and search strategyThis study accessed data from eight distinct repositories, which included four English-language databases and an equal number of Chinese-language databases: PubMed, Web of Science, the Cochrane Library, and Embase, alongside the China National Knowledge Infrastructure, Wanfang Medicine Online, the Chinese Science and Technology Journal Database, and the Chinese Biomedical Database (Ju et al., 2018; Liu et al., 2021; Luo et al., 2021; Xiong et al., 2019; Zheng et al., 2021). Up to March 2024, all eligible literatures were searched. The keywords were “2,3,5,4′-tetrahydroxystilbene-2-O-β-D-glucoside,” “liver injury,” “hepatoprotection,” and “hepatotoxicity.” (Figure 1; Supplementary Table 1).
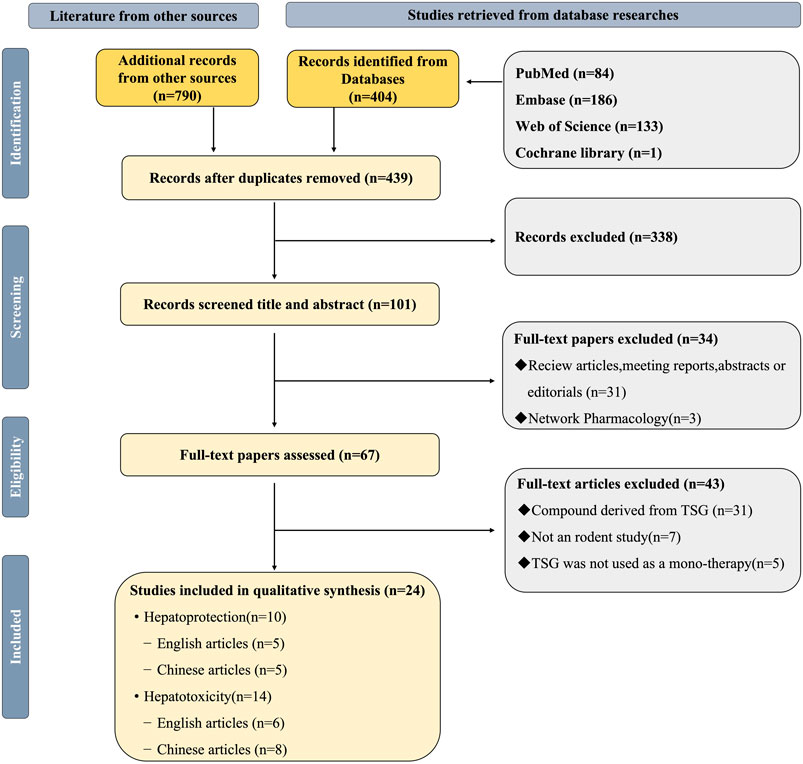
Figure 1. Selection of studies for this study.
2.2 Included criteria2.2.1 Studies on hepatoprotection(1) Population: Studies must involve rats or mice. (2) Experimental design: At least one pair of intervention and control groups must be established, both consisting of liver injury models. (3) Intervention: The intervention groups should receive TSG monotherapy exclusively. (4) Control: Control groups must receive no treatment or a non-functional intervention. (5) Indicators: Alanine aminotransferase (ALT) and aspartate aminotransferase (AST) are essential experimental indicators. Tumor necrosis factor alpha (TNF-α), interleukin 6 (IL-6), serum triglyceride (TG), serum total cholesterol (TC), glutathione (GSH), malondialdehyde (MDA), and superoxide dismutase (SOD) are selective experimental indicators. (6) Quality evaluation: The quality assessment score must not be less than 5 points on the CAMARADES 10-point scale.
2.2.2 Studies on hepatotoxicity(1) Population: Studies must involve rats or mice. (2) Experimental design: At least one pair of intervention and control groups must be established. (3) Intervention: The intervention groups should receive TSG monotherapy exclusively. (4) Control: Control groups must receive no treatment or a non-functional intervention. (5) Indicators: ALT and AST are essential experimental indicators. TNF-α, IL-6, interferon gamma (IFN-γ), apoptosis rate, alkaline phosphatase (ALP), albumin (ALB), and total protein (TP) are selective experimental indicators. (6) Quality evaluation: The quality assessment score must be equal to or higher than 5 points on the CAMARADES 10-point scale.
2.3 Excluded criteria(1) The animal subjects were not rats or mice. (2) No appropriate LI or normal animal models were selected for the study. (3) Lack of control group formation. (4) Intervention groups receiving interventions other than TSG monotherapy (e.g., Western medicine, traditional Chinese medicine, integrated medicine). (5) There are no necessary experimental indicators. (6) The quality evaluation result was less than 5 points.
2.4 Data extractionData extraction was performed by two independent researchers. The mean and standard deviation (SD) of continuous variables were estimated based on the collected experimental data using the Universal Desktop Ruler. The following information was extracted: (1) First author’s name and publication year; (2) Number, species (mice or rats), strain, sex, and weight of experimental animals; (3) Methodology for modeling and criteria for successful modeling; (4) Name, dosage, and frequency of drug administration; (5) Outcome indicators. Graphics were prioritized over digital text for reporting results (Table 1).
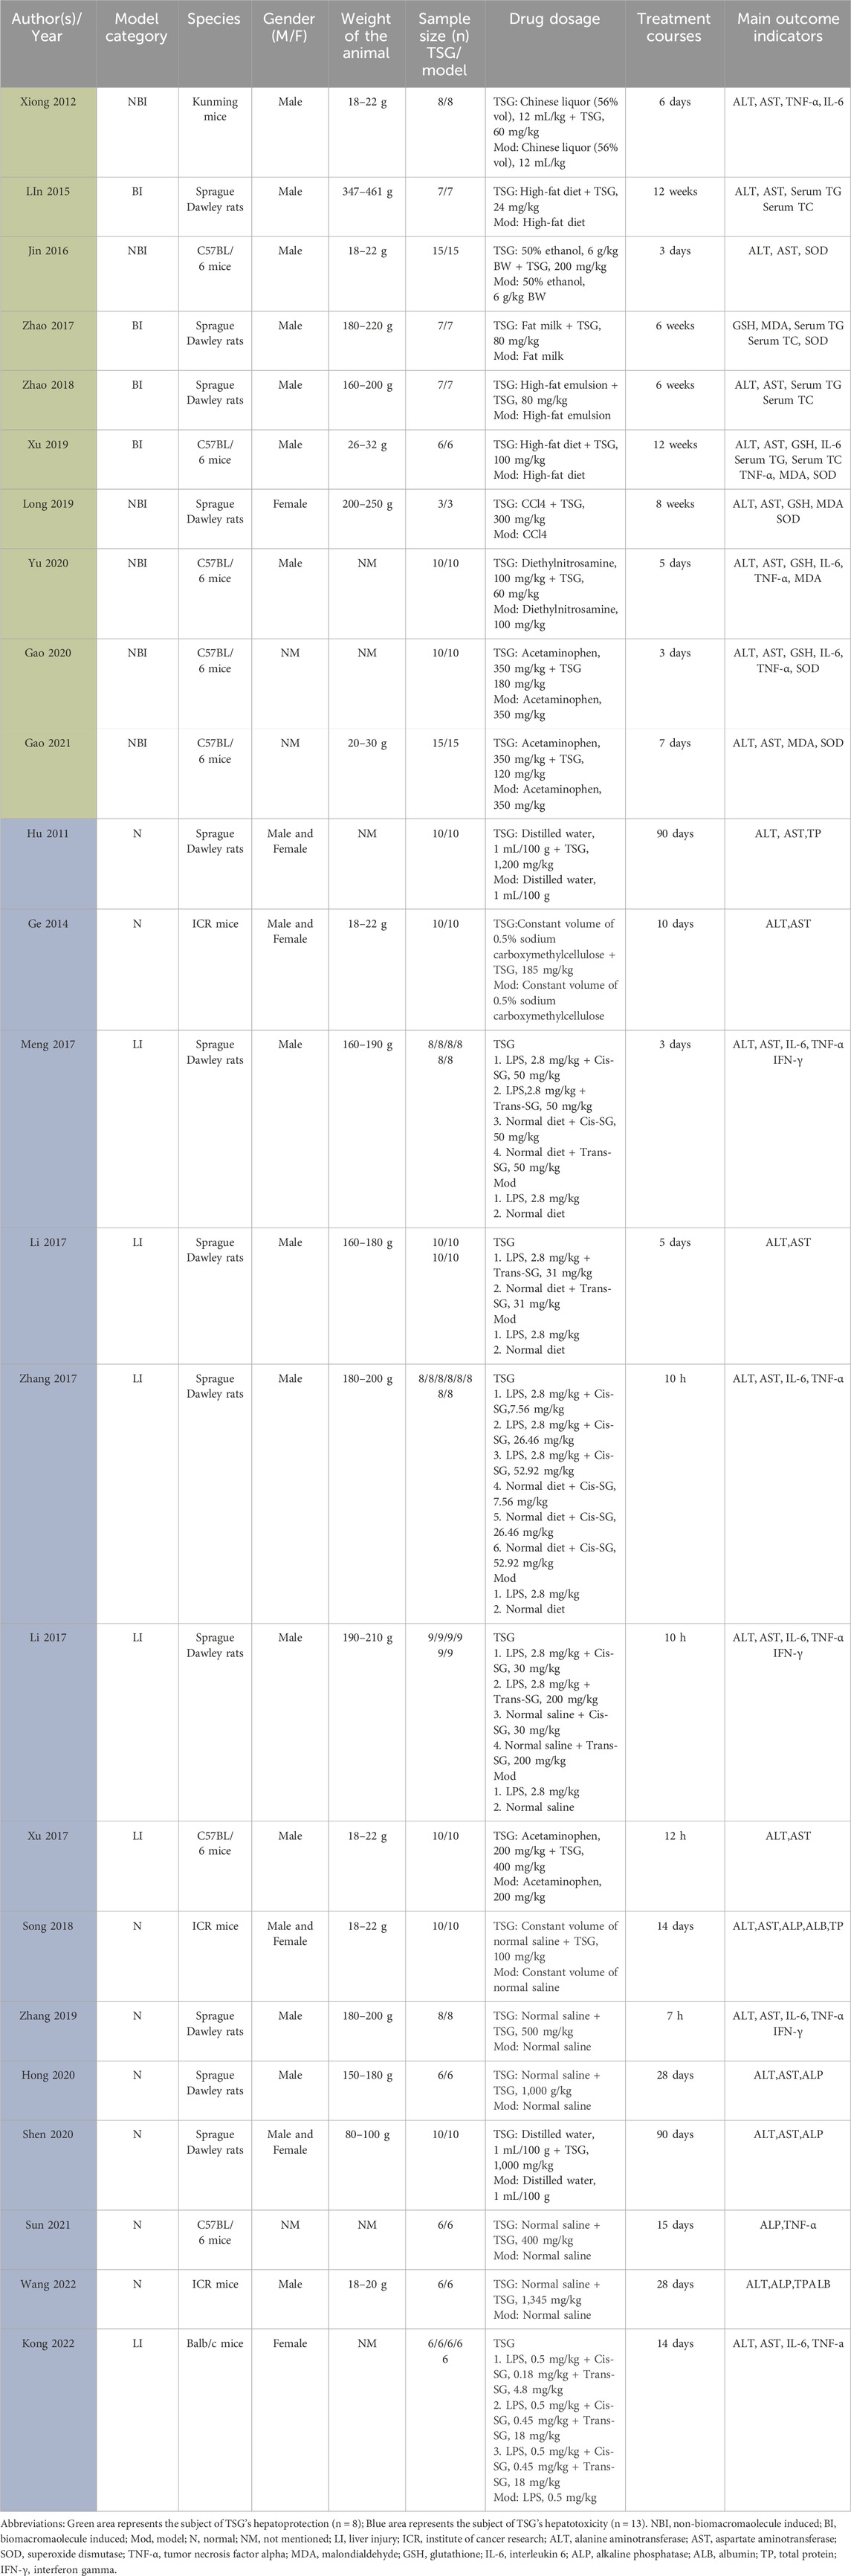
Table 1. The key characteristics of all 24 studies.
2.5 Risk of bias and quality of evidenceThe methodological quality of the included studies was independently assessed by two researchers using the CAMARADES (Collaborative Approach to Meta-Analysis and Review of Animal Data from Experimental Studies) 10-point scale (Macleod et al., 2004). Due to the specific nature of the study, the evaluation criteria were optimized by the researchers. In case of disagreements, the corresponding author acted as an arbitrator. The detailed method is presented in Figure 2.
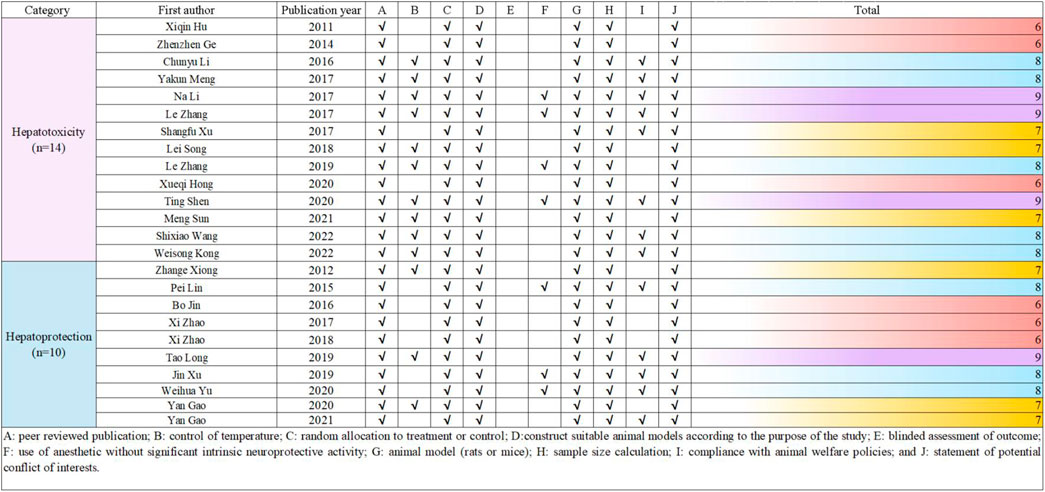
Figure 2. Risk of bias and quality assessment scores for included study.
2.6 Quantitative synthesis and statistical analysesThe study utilized STATA 16.0 software for conducting statistical analyses. Statistical significance was defined as p values less than 0.05 (p < 0.05). The results were assessed using the standardised mean difference (SMD) and the corresponding 95% confidence interval (95% CI). Heterogeneity between studies was evaluated using the I-squared (I2) test, with a random-effects model applied for I2 >50% and a fixed-effects model for I2 ≤ 50%. Results with an I2 of less than 50% were considered to have insignificant heterogeneity. Subgroup analysis was conducted for exploring whether the hepatoprotective effect of TSG would be affected by differences in species and modeling methods, including animal species subgroups (rats, mice) and modeling methods subgroups [non-biomacromolecule induced (NBI), biomacromolecule induced (BI)]. Additionally, subgroup analysis was performed for exploring whether the hepatotoxicity of TSG is related to species, modeling methods, and isomers, including animal models subgroups [normal(N) rodents, LI rodents], animal species subgroups (rats, mice), and isomers subgroups (cis-SG, trans-SG, as well as cis-SG and trans-SG). A sensitivity analysis and Egger’s test were carried out to ensure the credibility of the results for drawing inferences.
2.7 The dose-time-effect relationship and machine learningIn this study, the time unit for all included experiments was standardized to weeks (W). The dose-time-effect/toxicity relationship of TSG on the liver was visualized using 3D maps and radar charts. Four datasets with 81 diverse samples was collected to analyze the impact of intervention dosage on ALT and AST levels, a measure of TSG’s dual effects. The data underwent standardization using z-scores for consistency, enhancing model training efficiency and interpretability. A gradient boosting regression model was employed for precise prediction, with the data split into 8:2 training and test sets. The Radial Basis Function (RBF) kernel captured nonlinear relationships, and mean squared error (MSE) served as the metric for model evaluation, guiding dosage optimization to maximize ALT and AST level intervention. The LOWESS method was utilized for visualizing the relationship between dosage and variable effects, with confidence intervals plotted for clarity. Model performance was gauged by MSE, with lower values indicating better fit. Python (3.12.3) and Stata (16.0) were the analytical tools of choice. This study demonstrates a systematic approach to optimizing dosage through data-driven modeling and analysis.
2.8 Network pharmacology-based analysis2.8.1 Acquisition of TSG-related targetsUtilizing the SuperPred (https://prediction.charite.de/) and the BATMAN database (http://bionet.ncpsb.org.cn/batman-tcm/#/home), we conducted a comprehensive search to identify all potential targets of TSG. Subsequently, we refined the list of targets by aligning them with the UniProt database (https://www.uniprot.org/) to standardize the gene nomenclature. This process involved the exclusion of human-specific genes and the elimination of any invalid or redundant targets, ensuring a curated and standardized set of gene names.
2.8.2 Acquisition of LI-related targetsTo identify LI-related targets, we conducted searches in the GeneCards (https://www.genecards.org/) and OMIM (https://www.omim.org/) databases using the keyword “liver injury.” The resulting disease-associated targets were then compiled into a single Excel spreadsheet. We eliminated any duplicate genes and cross-referenced the list with the Uniprot database to refine and validate the gene information for the disease targets.
2.8.3 Assembly of a shared PPI network for TSG and LI targetsA Venn diagram approach was employed to pinpoint the overlapping targets between TSG and LI. Subsequently, these shared targets were examined using the STRING database to gather data on protein-protein interactions (PPIs), with an emphasis on human proteins. The PPI network for the common targets was then graphically represented using Cytoscape 3.8.2, where the size and color of the nodes were adjusted to reflect their connectivity within the network.
2.8.4 Go analysis and KEGG pathway enrichment analysisThe overlapping genes identified for TSG and LI were submitted to the DAVID database (https://david.ncifcrf.gov/summary.jsp) for comprehensive functional annotation. This resource is adept at evaluating the biological process (BP), cellular component (CC), and molecular function (MF) associated with the genes. The GO analysis elucidates the roles, pathways, and cellular contexts in which these genes are enriched. Additionally, the KEGG database (https://www.genome.jp/kegg/) serves as a repository for the systematic analysis of gene functions. The synthesis of GO and KEGG enrichment analyses facilitates a deeper understanding of the genes’ functional profiles and the potential pathways that link drugs to diseases. The visualization of the data was achieved by selecting the top 10 GO categories and the top 20 KEGG pathways based on the lowest P-values, which were then depicted using bar and bubble charts for a clear presentation.
2.9 Molecular dockingTwo distinct databases served as repositories for the chemical compounds and molecular ligands: the PubChem database (https://pubchem.ncbi.nlm.nih.gov) and the RCSB Protein Data Bank (https://www.rcsb.org/structure). For the molecular docking procedures, AutoDockTools version 1.5.6 and AutoDock Vina version 4.2 were the chosen software tools. The detailed docking workflow is as follows.
1. The molecular framework of TSG was retrieved from the PubChem database and subsequently transformed into a three-dimensional configuration using ChemDraw, which also optimized the molecular energy. This 3D model was processed through AutoDockTools 1.5.6, and the output was stored in pdbqt format.
2. The ligands were sourced from the RCSB protein repository. After importing them into PyMOL, they underwent dehydration and hydrogenation processes, preparing them for subsequent separation into individual ligands. AutoDockTools 1.5.6 was then utilized to create a docking grid box centered on the active site of the target proteins, with the configuration saved in pdbqt format.
3. AutoDock Vina, specifically version 1.1.2, was deployed for docking the potential targets with the active compounds and for assessing the free binding energies.
4. For the visualization and analysis of molecular interactions, PyMOL version 2.6 and Discovery Studio 2019 were the software applications utilized.
3 Result3.1 Comprehensive literature selection and study qualityA total of 1,184 articles were initially identified using specific keywords, comprising 404 articles from English databases and 790 articles from Chinese databases. After eliminating 745 duplicate articles, the researchers proceeded with evaluating the remaining 439 articles. Following a thorough review of titles and abstracts based on inclusion and exclusion criteria, 101 articles were excluded. Subsequently, 34 articles, including those related to TSG reviews, conference reports, abstracts, editorials, and web pharmacology, were further eliminated. Finally, after full-text reviews, 43 articles were excluded, resulting in a meta-analysis comprising 24 publications (Bo, 2016; Gao et al., 2020; Kong et al., 2022; Song et al., 2018; Li C. et al., 2017; Lin et al., 2015b; Long et al., 2019; Meng, 2021; Meng et al., 2017; Li N. et al., 2017; Shen et al., 2020; Wang et al., 2022; Xi, 2017; Xi, 2018; Hu et al., 2011; Xu et al., 2019; Xu et al., 2017; Xueqi, 2020; Gao, 2021; Yu W. et al., 2020; Zhang, 2017; Zhang et al., 2019; Xiong et al., 2012; Zhenzhen et al., 2014) (Figure 1).
To evaluate the quality of the research methodology, a revised CAMARADES checklist was applied, consisting of 10 distinct criteria. The inclusion criteria included publication in peer-reviewed journals, maintenance of appropriate temperature conditions, the use of relevant rodent models that matched the research goals, random assignment of subjects in the experiments, unbiased evaluation of outcomes, clear documentation of anesthesia protocols without significant inherent neuroprotective properties, calculation of sample sizes, compliance with ethical guidelines for animal research, and the revelation of any potential conflicts of interest.
Out of the 24 reviewed papers, each employed suitable rodent models with well-defined experimental groupings, along with thorough reporting on sample sizes and the declaration of potential conflicts of interest. However, only seven papers specifically addressed the use of anesthesia without neuroprotective effects, eleven papers omitted references to animal welfare guidelines, and none reported on blinded outcome assessments. The quality scores varied from 6 to 9, with six papers receiving a score of 6 (25.00%), another six scoring 7 (25.00%), eight papers scoring 8 (33.33%), and four papers achieving a score of 9 (16.67%). A graphical representation of the methodological quality for each study is depicted in Figure 2.
3.2 Basic information and features of the articles includedSufficient information was available in the 24 papers to conduct a meta-analysis. These trials involved a total of 564 rodents, with 324 assigned to the treatment group and the remaining rodents serving as the control group (Table 1).
The animals’ weights in the studies ranged from 18 g to 250 g, categorized into five groups based on species distribution: Kunming mice (2.84%, 16/564), ICR mice (9.22%, 52/564), C57BL/6 mice (25.53%, 144/564), Balb/c mice (5.32%, 30/564), and Sprague Dawley Rats (57.09%, 322/564). Rats constituted 57.09% (322/564) of the total rodents, with mice comprising 42.91% (242/564).
Furthermore, all experiments on hepatoprotection were divided into rats (27.27%, 48/176) and mice (72.73%, 128/176) subgroups, with non-biomacromolecule-induced (NBI) (43.81%, 76/176) and biomacromolecule-induced (BI) (56.82%, 100/176) subgroups. Hepatotoxicity studies were categorized into rats (58.97%, 138/234) and mice (41.03%, 96/234) subgroups, as well as normal (N) (56.41%, 132/234) and liver injury (LI) (43.59%, 102/234) subgroups.
The daily TSG dosage ranged from 4.98 mg/kg to 1,345 mg/kg, administered for up to 90 days. For the two TSG isomers, 38 experiments involving 288 rodents examined the hepatotoxic effects of cis and trans isomers. Among the 288 mice, subgroups were based on animal modeling methods and TSG isomers: normal (N) (43.75%, 126/288) and liver injury (LI) (56.25%, 162/288); cis-SG (C) (56.94%, 164/288), trans-SG (T) (30.56%, 88/288), as well as cis-SG and trans-SG (C.T) (12.50%, 36/288) subgroups.
3.3 Protective effects of TSG on LIThe impact of TSG therapy on LI was evaluated by measuring the levels of ALT, AST, TNF-α, and IL-6, which were the primary outcomes. Additionally, the levels of GSH, MDA, SOD, serum TG and serum TC were also affected by TSG treatment (Supplementary Tables 2, 3). Histological analysis of 10 included articles of liver tissues from LI animals showed significant signs of inflammation, hepatocyte swelling, and hepatocellular necrosis (Bo, 2016; Gao et al., 2020; Lin et al., 2015b; Long et al., 2019; Xi, 2017; Xi, 2018; Xu et al., 2019; Gao, 2021; Yu W. et al., 2020; Xiong et al., 2012). Further analysis of this study to find out the optimal protective dosage range was 27.27–38.81 mg/kg/d.
3.3.1 TSG improves the primary outcomes of LI3.3.1.1 ALT levelsGiven the low degree of variability (I2 < 50%), a fixed-effects model was applied for the analysis. The findings indicated a substantial decrease in ALT levels for the TSG-intervention groups when contrasted with the LI model groups [n = 162, 95% CI (-3.81,-2.80), SMD = |-3.30|, I2 = 33.5%, P-value <0.0001] (Figures 3A, B; Supplementary Table 2).
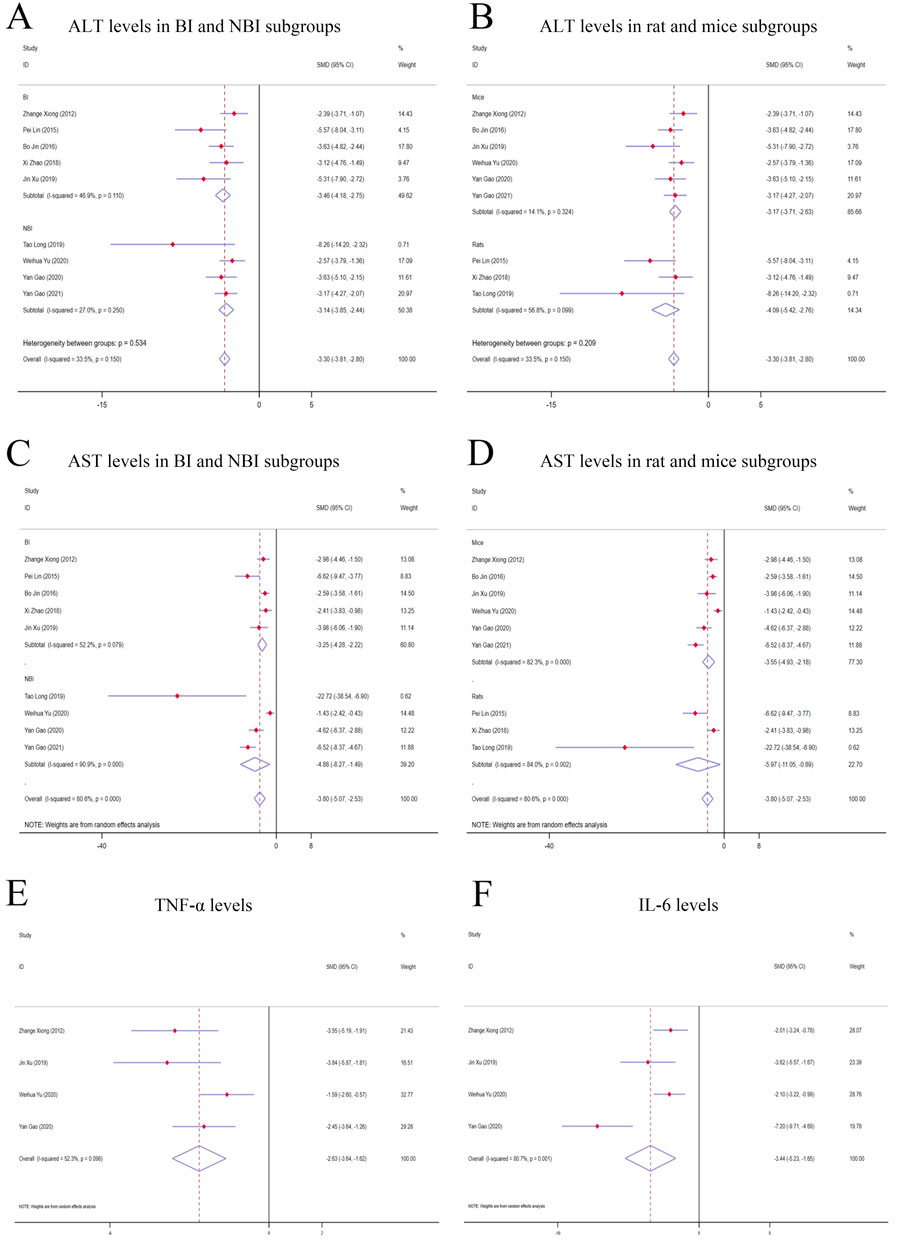
Figure 3. Forest plot (effect size and 95% CI) of TSG’s hepatoprotective roles on ALT, AST, TNF-α and IL-6. (A) ALT levels in BI and NBI subgroups; (B) ALT levels in rat and mice subgroups; (C) AST levels in BI and NBI subgroups; (D) AST levels in rat and mice subgroups; (E) TNF-α levels; (F) IL-6 levels. Abbreviations: 95% CI, 95% confidence interval; ALT, alanine aminotransferase; AST, aspartate aminotransferase; TNF-α, tumor necrosis factor alpha; IL-6, interleukin 6; BI, biomacromolecule induced; NBI, non-biomacromolecule induced.
3.3.1.2 AST levelsDue to considerable variability among the studies (I2 > 50%), a random-effects model was implemented for the analysis. The findings demonstrated a noteworthy divergence in the levels of AST between the TSG and LI model groups, favoring the TSG groups with lower AST levels [n = 162, 95% CI (-5.07,-2.53), SMD = |-3.80|, I2 = 80.6%, P-value <0.0001] (Figures 3C, D; Supplementary Table 2).
3.3.1.3 TNF-α levelsA considerable degree of heterogeneity (I2 > 50%) was observed, prompting the use of a random-effects model for the analysis. The data analysis revealed that the TSG group exhibited significantly lower TNF-α levels compared to the LI model groups [n = 68, 95% CI (-3.64, −1.62), SMD = |-2.63|, I2 = 52.3%, P-value <0.0001] (Figure 3E; Supplementary Table 2).
3.3.1.4 IL-6 levelsRandom-effects analyses showed variations in IL-6 levels among the rodent models in the study. The IL-6 levels in the TSG groups were notably lower than those in the control groups [n = 68, 95% CI (-5.23,-1.65), SMD = |-3.44|, I2 = 80.7%, P-value <0.0001] (Figure 3F; Supplementary Table 2).
3.3.2 TSG effects on secondary outcomes of LI3.3.2.1 GSH levelsThe random-effects model analysis indicated pronounced disparities in the levels of GSH between the TSG and LI model groups. It was found that the TSG groups had considerably elevated GSH levels in contrast to the LI model groups [n = 75, 95% CI (1.97,5.26), SMD = |3.61|, I2 = 75.1%, P-value <0.0001], as depicted in Supplementary Figure 1A; Supplementary Table 2.
3.3.2.2 MDA levelsThe random-effects model analysis exposed significant variations in the levels of MDA between the TSG and LI model groups. The TSG groups displayed substantially reduced MDA levels relative to the LI model groups [n = 82, 95% CI (-3.89,-1.44), SMD = |-2.66|, I2 = 66.7%, P-value <0.0001], as illustrated in Supplementary Figure 1B; Supplementary Table 2.
3.3.2.3 SOD levelsGiven the considerable heterogeneity (I2 > 50%), a random-effects model was utilized for a more in-depth analysis. The results demonstrated a marked difference in SOD levels between the TSG and LI model groups, with the TSG groups showing an increase in SOD activity [n = 112, 95% CI (1.64,4.09), SMD = |2.87|, I2 = 74.6%, P-value <0.0001], which is detailed in Supplementary Figure 1C; Supplementary Table 2.
3.3.2.4 Serum TG levelsBased on the random-effects analysis, there were observed differences in serum TG levels among the animal models in the study. The TSG groups exhibited lower serum TG levels in comparison to the LI groups [n = 54, 95% CI (-7.15,-1.13), SMD = |-4.14|, I2 = 86.6%, P-value = 0.007], as represented in Supplementary Figure 1D; Supplementary Table 2.
3.3.2.5 Serum TC levelsThe random-effects model analysis indicated significant variations in serum TC levels between the TSG and LI model groups. The TSG groups had significantly decreased serum TC levels compared to the LI model groups [n = 54, 95% CI (-9.19,-1.61), SMD = |-5.40|, I2 = 87.0%, P-value = 0.005], as depicted in Supplementary Figure 1E; Supplementary Table 2.
3.3.3 Subgroup analysis of hepatoprotection studies3.3.3.1 Analysis of ALT levels in distinct subgroupsWhen analyzing the liver enzyme levels, it was found that the TSG groups had markedly lower levels of ALT compared to the LI model groups. The most notable decrease in ALT levels was observed in the BI subgroups [n = 86, 95% CI (-4.18, −2.75), SMD = |-3.46|, I2 = 46.9%, P-value <0.0001], surpassing the reduction observed in the NBI subgroup [n = 76, 95% CI (-3.85,-2.44), SMD = |-3.14|, I2 = 27.0%, P-value <0.0001] (Figure 3A; Supplementary Table 3). The TSG intervention proved to be effective in both mice [n = 128, 95% CI (-3.71,-2.63), SMD = |-3.17|, I2 = 14.1%, P-value <0.0001] and rats [n = 34, 95% CI (-5.42,-2.76), SMD = |-4.09|, I2 = 56.8%, P-value <0.0001] subgroups, with a more pronounced reduction in the latter (Figure 3B; Supplementary Table 3). The variability in results was primarily attributed to the rats and BI subgroups. The TSG intervention consistently reduced ALT levels across all analyzed subgroups, without any significant differences in its effectiveness.
3.3.3.2 Analysis of AST levels in distinct subgroupsIn the evaluation of AST levels, the TSG groups also demonstrated a significant reduction compared to the LI model groups. The TSG intervention was particularly effective in reducing AST levels in mice [n = 128, 95% CI (-4.93,-2.18), SMD = |-3.55|, I2 = 82.3%, P-value <0.0001] and rats [n = 34, 95% CI (-11.05,-0.89), SMD = |-5.97|, I2 = 84.0%, P-value = 0.021] subgroups (Figure 3C; Supplementary Table 3). The BI subgroup [n = 86, 95% CI (-4.25,-2.22), SMD = |-3.25|, I2 = 52.2%, P-value <0.0001] and the NBI subgroup [n = 76, 95% CI (-8.27,-1.49), I2 = 90.9%, SMD = |-4.88|, P-value = 0.005] both responded positively to TSG, with the NBI and rats subgroups showing a more significant reduction in AST levels (Figure 3D; Supplementary Table 3). TSG demonstrated greater efficacy in lowering AST levels within the NBI and rat subgroups. Heterogeneity was more pronounced in the mice, rat, and NBI subgroups, contrasting with the comparatively lower heterogeneity observed in the BI subgroups.
3.4 Hepatotoxic effects of TSGThe hepatotoxic potential of TSG was assessed by examining four critical biomarkers in a comprehensive review of 14 research studies: ALT, AST, TNF-α, and IL-6. In contrast to the N groups, where no substantial changes were noted, a marked elevation in these biomarkers was observed in the LI groups. The findings suggest that TSG may intensify liver damage, particularly influencing the levels of ALT and AST in the LI groups. The histological examination of 9 included articles showed significant hepatotoxic effects in liver tissue, including inflammatory cell infiltration, cell edema, and vacuolar cytoplasmic degeneration (Kong et al., 2022; Li C. et al., 2017; Meng, 2021; Meng et al., 2017; Wang et al., 2022; Xu et al., 2017; Xueqi, 2020; Zhang, 2017; Zhang et al., 2019). Further analysis of this study to find out the optimal toxic dosage range was 51.93–76.07 mg/kg/d (Supplementary Tables 4, 5).
3.4.1 Primary indicators of TSG’s hepatotoxic effects3.4.1.1 ALT levelsGiven the significant variability across studies (I2 > 50%), a random-effects model was applied for the statistical analysis. The findings indicated that the treatment of TSG resulted in a significant increase in ALT levels when compared with the control groups [n = 222, 95% CI (0.06,1.69), SMD = |0.88|, I2 = 85.3%, P-value = 0.034] (Figures 4A, B).
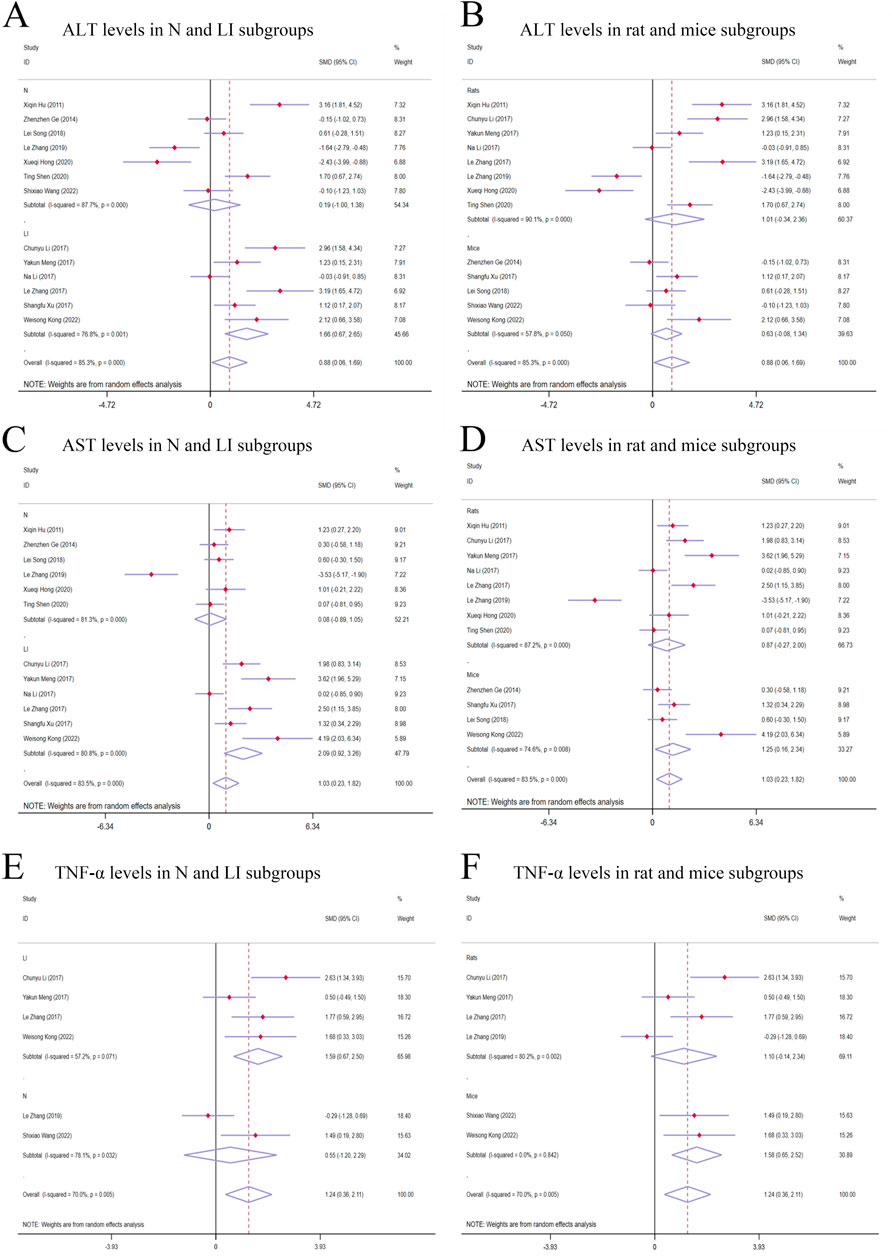
Figure 4. Forest plot (effect size and 95% CI) of TSG’s hepatotoxic roles on ALT, AST and TNF-α. (A) ALT levels in N and LI subgroups; (B) ALT levels in rat and mice subgroups; (C) AST levels in N and LI subgroups; (D) AST levels in rat and mice subgroups; (E) TNF-α levels in N and LI subgroups; (F) TNF-α levels in rat and mice subgroups. Abbreviations: 95% CI, 95% confidence interval; ALT, alanine aminotransferase; AST, aspartate aminotransferase; TNF-α, tumor necrosis factor alpha; N, normal; LI, liver injury.
3.4.1.2 AST levelsThe random-effects model analysis highlighted a significant difference in AST levels between the groups treated with TSG and those in the control groups. The data suggested that TSG was linked to an increase in AST levels [n = 210, 95% CI (0.23,1.82), SMD = |1.03|, I2 = 83.5%, P-value = 0.011] (Figures 4C, D).
3.4.1.3 TNF-α levelsThe presence of considerable heterogeneity (I2 > 50%) in the study data led to the application of a random-effects model. The analysis demonstrated that TSG-treated groups exhibited increased TNF-α levels compared to the control groups [n = 90, 95% CI (0.36,2.11), SMD = |1.24|, I2 = 70.0%, P-value = 0.006] (Figures 4E, F).
3.4.1.4 IL-6 levelsThe random-effects model analyses revealed a notable variation in IL-6 levels among the rodent models under investigation. The IL-6 levels in the TSG groups were found to be markedly higher compared to the control groups [n = 78, 95% CI (0.31,3.27), SMD = |1.79|, I2 = 85.1%, P-value = 0.018] (Figure 5A).
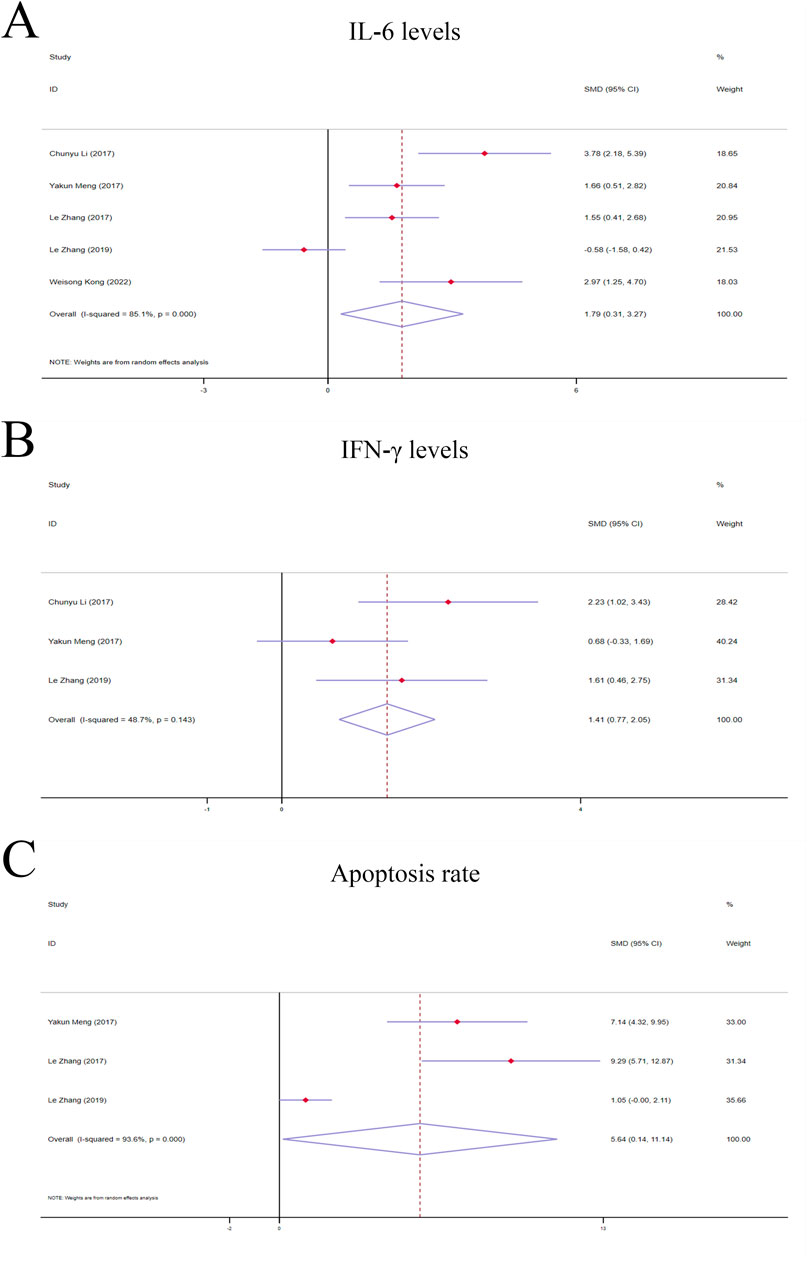
Figure 5. Forest plot (effect size and 95% CI) of TSG’s hepatoprotective roles on IL-6, IFN-γ and apoptosis rate. (A) IL-6 levels; (B) IFN-γ levels; (C) Apoptosis rate. Abbreviations: 95% CI, 95% confidence interval; IL-6, interleukin 6; IFN-γ, interferon gamma.
3.4.2 Secondary indicators of TSG’s hepatotoxic effects3.4.2.1 IFN-γ levelsA fixed-effects model analysis revealed significant variations in IFN-γ levels between the TSG groups and the control groups. The TSG groups demonstrated notably elevated the levels of IFN-γ relative to the control groups [n = 50, 95% CI (0.77,2.05), SMD = |1.41|, I2 = 48.7%, P-value <0.0001] (Figure 5B).
3.4.2.2 Apoptosis rateDue to the substantial heterogeneity observed (I2 > 50%), a random-effects model was utilized for the analysis. The findings showed that the TSG groups experienced a significantly increased rate of apoptotic cell death when compared to the control groups [n = 48, 95% CI (0.14,11.14), SMD = |5.64|, I2 = 93.6%, P-value = 0.044] (Figure 5C).
3.4.3 Subgroup analysis of studies on hepatotoxicity3.4.3.1 Subgroup analysis of ALT levelsThe subgroup analysis showed that TSG notably increased ALT levels in the LI subgroups [n = 102, 95% CI (0.67,2.65), SMD = |1.66|, I2 = 76.8%, P-value = 0.001], whereas no significant changes were detected in the N subgroups [n = 120, 95% CI (-1.00,1.38), SMD = |0.19|, I2 = 87.7%, P-value = 0.755] (Figure 4A). Toxic effects of TSG were observed in both mice [n = 84, 95% CI (-0.08, 1.34), SMD = |0.63|, I2 = 57.8%, P-value = 0.083] and rats [n = 138, 95% CI (-0.34, 2.36), SMD = |1.01|, I2 = 90.1%, P-value = 0.144] subgroups, with a more pronounced increase in ALT levels in the rats subgroups compared to the mice subgroups (Figure 4B). Rats models and N models were identified as the main sources of increased heterogeneity in the subgroup analysis.
3.4.3.2 Subgroup analysis of AST levelsIn the subgroup analysis based on modeling methods, AST levels were found to be elevated in the LI subgroups in response to TSG [n = 102, 95% CI (0.92,3.26), SMD = |2.09|, I2 = 80.8%, P-value < 0.001], whereas no significant differences were observed between the N subgroups and the control groups [n = 108, 95% CI (-0.89,1.05), SMD = |0.08|, I2 = 81.3%, P-value = 0.867] (Figure 4C). Both the N and LI subgroups contributed to the increased heterogeneity. Additionally, a trend of increasing AST levels was observed in the mice subgroups [n = 72, 95% CI (0.16,2.34), SMD = |1.25|, I2 = 74.6%, P-value = 0.025], whereas the rats subgroups did not exhibit statistically significant changes [n = 138, 95% CI (-0.27,2.00), SMD = |0.87|, I2 = 87.2%, P-value = 0.142] (Figure 4D).
3.4.3.3 Subgroup analysis of TNF-α levelsThe subgroup analysis based on modeling methods indicated a significant increase in TNF-α levels in the LI subgroups due to TSG [n = 62, 95% CI (0.67,2.50), SMD = |1.59|, I2 = 57.2%, P-value = 0.001], while no significant differences were noted in the N subgroups when compared to the control groups [n = 28, 95% CI (-1.20,2.29), SMD = |0.55|, I2 = 78.1%, P-value = 0.541] (Figure 4E). An increase in TNF-α levels was observed in both mice [n = 24, 95% CI (0.65,2.52), SMD = |1.58|, I2 = 0.0%, P-value = 0.001] and rats [n = 66, 95% CI (-0.14,2.34), SMD = |1.10|, I2 = 80.2%, P-value = 0.082] (Figure 4F). Rats models and N models were identified as the primary sources of increased heterogeneity in the subgroup analysis.
3.5 Analysis of the hepatotoxic effects of cis-SG and trans-SGCis-SG and trans-SG were two isomers of TSG. This study encompassed 38 experiments involving 288 rodents to explore the hepatotoxic effects of these two isomers. ALT, AST, TNF-α, and IL-6 levels were evaluated as primary indicators to assess the toxic effects of cis-SG and trans-SG. The levels of these indicators were elevated in the LI subgroups, C subgroups, and C.T subgroups, while there was no significant difference between T subgroups and N subgroup (Supplementary Tables 6, 7).
3.5.1 The primary indicators of the hepatotoxic effects of cis-SG and trans-SG3.5.1.1 ALT levelsIn terms of modeling methods subgroups, ALT levels significantly increased in the LI subgroups [n = 162, 95% CI (0.44,1.72), SMD = |1.08|, I2 = 69.6%, P-value = 0.001], while there was no difference in the N subgroups [n = 126, 95% CI (-0.32,0.38), SMD = |0.03|, I2 = 0.0%, P-value = 0.875] (Figure 6A). Both C and C.T subgroups showed toxic effects of TSG [C subgroups: n = 164, 95% CI (0.16,1.46), SMD = |0.81|, I2 = 72.9%, P-value = 0.015; C.T subgroups: n = 36, 95% CI (-0.44,2.67), SMD = |1.11|, I2 = 76.2%, P-value = 0.161], but no difference was observed in the T subgroups between trans-SG therapy groups and control groups [n = 88, 95% CI (-0.33,0.50), SMD = |0.09|, I2 = 0.0%, P-value = 0.689] (Figure 6B). The heterogeneity predominantly originated from the LI subgroups, C subgroups and C.T subgroups.
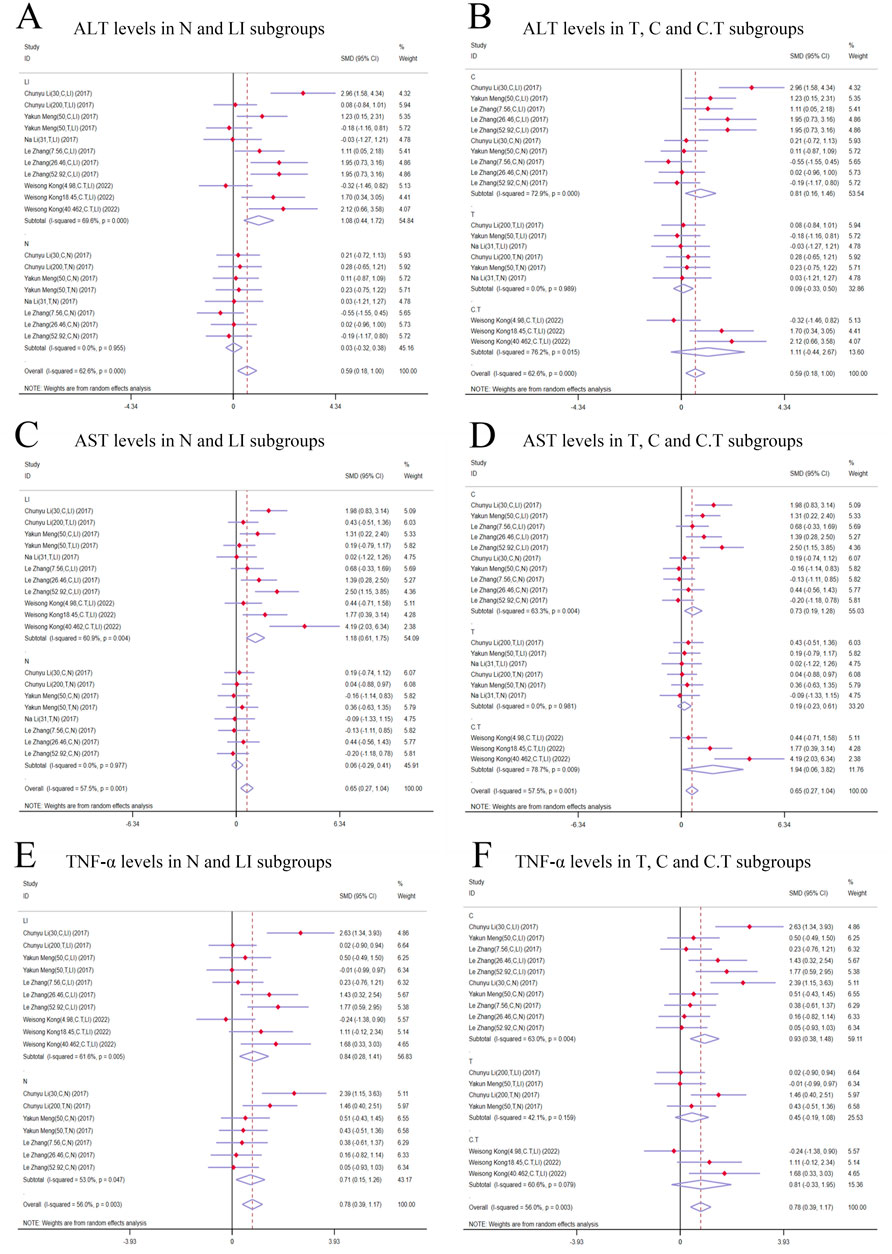
Figure 6. Forest plot (effect size and 95% CI) of cis/trans-SG’s hepatotoxic roles on ALT, AST and TNF-α. (A) ALT levels in N and LI subgroups; (B) ALT levels in T, C and C.T subgroups; (C) AST levels in N and LI subgroups; (D) AST levels in T, C and C.T subgroups; (E) TNF-α levels in N and LI subgroups; (F) TNF-α levels in T, C and C.T subgroups. Abbreviations: 95% CI, 95% confidence interval; ALT, alanine aminotransferase; AST, aspartate aminotransferase; TNF-α, tumor necrosis factor alpha; N, normal; LI, liver injury; T subgroup, trans-SG subgourp; C subgroup, cis-SG subgroup; C.T subgroup, cis-SG and trans-SG subgroup.
3.5.1.2 AST levelsAST levels exhibited a higher trend in the TSG groups in comparison with the control groups. A meticulous subgroup analysis exposed a significant surge in AST levels within the LI [n = 162, 95% CI (0.61,1.75), SMD = |1.18|, I2 = 60.9%, P-value < 0.0001], C [n = 164, 95% CI (0.19,1.28), SMD = |0.73|, I2 = 63.3%, P-value = 0.009], and C.T [n = 36, 95% CI (0.06,3.82), SMD = |1.94|, I2 = 78.7%, P-value = 0.043] subgroups. Conversely, no substantial distinction was unearthed in the remaining groups when the intervention groups were appraised against the control groups [N subgroups: n = 126, 95% CI (-0.29,0.41), SMD = |0.06|, I2 = 0.0%, P-value = 0.721; T subgroups: n = 88, 95% CI (-0.23,0.61), SMD = |0.19|, I2 = 0.0%, P-value = 0.382] (Figures 6C, D). The LI, C, and C.T subgroups were identified as the primary sources of increased heterogeneity in the subgroup analysis.
3.5.1.3 TNF-α levelsIn contrast to the control groups, TNF-α levels were increased by TSG in intervention groups. This increase was noted across both the LI [n = 152, 95% CI (0.28,1.41), SMD = |0.84|, I2 = 61.6%, P-value = 0.003] and the N [n = 120, 95% CI (0.15,1.26), SMD = |0.71|, I2 = 53.0%, P-value = 0.013] subgroups as illustrated in Figure 6D. A detailed examination of the isomer-based subgroups indicated a rise in TNF-α levels across all categories [C subgroups: n = 166, 95% CI (0.38,1.48), SMD = |0.93|, I2 = 63.0%, P-value = 0.001; T subgroups: n = 70, 95% CI (-0.19,1.08), SMD = |0.45|, I2 = 42.1%, P-value = 0.170; C.T subgroups: n = 36, 95% CI (-0.33,1.95), SMD = |0.81|, I2 = 60.6%, P-value = 0.164], while T subgroups and C.T subgroups did not exhibit statistical significance (Figure 6E).
3.5.1.4 IL-6 levelsSubgroup analysis based on modeling methods and isomers revealed a significant increase in IL-6 levels in LI [n = 152, 95% CI (0.41,2.41), SMD = |1.27|, I2 = 80.9%, P-value = 0.004], C [n = 164, 95% CI (0.23,1.41), SMD = |0.82|, I2 = 67.5%, P-value = 0.006], and C.T [n = 36, 95% CI (1.20,2.91), SMD = |2.05|, I2 = 1.1%, P-value < 0.0001] subgroups. IL-6 levels in N [n = 116, 95% CI (-0.03,0.72), SMD = |0.34|, I2 = 0.0%, P-value = 0.069] and T [n = 68, 95% CI (-0.88,1.02), SMD = |0.07|, I2 = 72.6%, P-value = 0.886] subgroups showed no significant difference compared to control groups (Figures 7A, B). Conversely, the N [n = 116, 95% CI (-0.03,0.72), SMD = |0.34|, I2 = 0.0%, P-value = 0.069] and T [n = 68, 95% CI (-0.88,1.02), SMD = |0.07|, I2 = 72.6%, P-value = 0.886] subgroups demonstrated no significant deviation in IL-6 levels when compared to their respective control groups (Figures 7A, B).
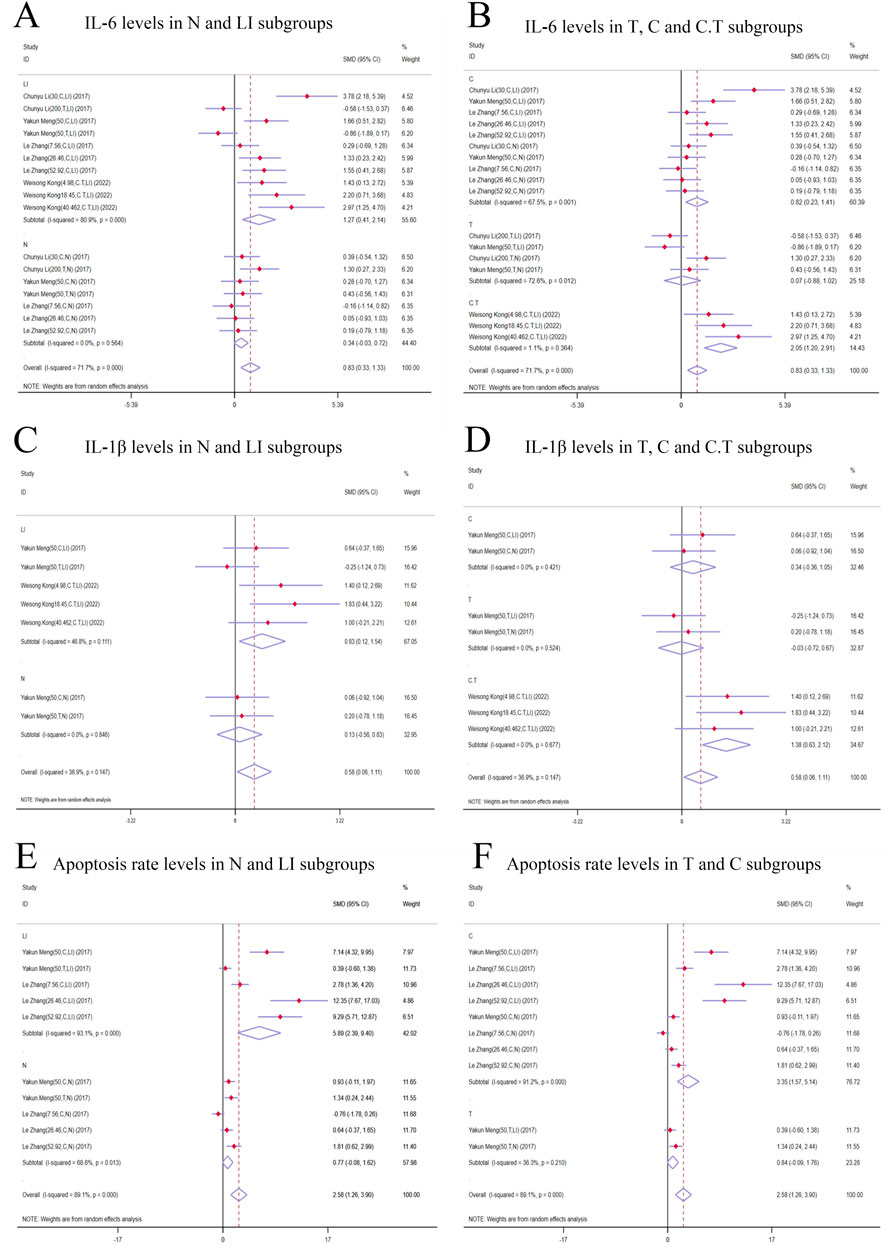
Figure 7. Forest plot (effect size and 95% CI) of cis/trans-SG’s hepatotoxic roles on IL-6, IL-1β and apoptosis rate. (A) IL-6 levels in N and LI subgroups; (B) IL-6 levels in T, C and C.T subgroups; (C) IL-1β levels in N and LI subgroups; (D) IL-1β levels in T, C and C.T subgroups; (E) Apoptosis rate levels in N and LI subgroups; (F) Apoptosis rate levels in T and C subgroups. Abbreviations: 95% CI, 95% confidence interval; IL-6, interleukin 6; IL-1β, interleukin 1β; N, normal; LI, liver injury; T subgroup, trans-SG subgourp; C subgroup, cis-SG subgroup; C.T subgroup, cis-SG and trans-SG subgroup.
3.5.2 Secondary indicators of the hepatotoxic effects of cis-SG and trans-SG3.5.2.1 IL-1β levelsIn the subgroup analysis based on modeling methods, IL-1β levels in the LI subgroups were higher than those in the control groups [n = 68, 95% CI (0.12,1.54), SMD = |0.83|, I2 = 46.8%, P-value = 0.022], while no significant difference was found between N subgroups and control groups [n = 32, 95% CI (-0.56,0.83), SMD = |0.13|, I2 = 0.0%, P-value = 0.711] (Figure 7C). Additionally, IL-1β levels exhibited an increasing trend in the C.T subgroups [n = 36, 95% CI (0.63,2.12), SMD = |1.38|, I2 = 0.0%, P-value <0.0001]. The T [n = 32, 95% CI (-0.72,0.67), SMD = |-0.03|, I2 = 0.0%, P-value = 0.942] and C [n = 32, 95% CI (-0.36,1.05), SMD = |0.34|, I2 = 0.0%, P-value = 0.338] subgroups did not show statistical significance (Figure 7D).
3.5.2.2 Apoptosis rateApoptosis rate significantly was increased in the LI [n = 80, 95% CI (2.39,9.40), SMD = |5.89|, I2 = 93.1%, P-value = 0.001] and C [n = 128, 95% CI (1.57,5.14), SMD = |3.35|, I2 = 91.2%, P-value <0.0001] subgroups. In contrast, the N [n = 80, 95% CI (-0.08,1.62), SMD = |0.77|, I2 = 68.6%, P-value = 0.078] and T [n = 32, 95% CI (-0.09,1.76), SMD = |0.84|, I2 = 36.3%, P-value = 0.076] subgroups demonstrated no significant changes in apoptosis rates (Figures 7E, F).
3.6 Sensitivity analysis and publication bias of outcome indicatorsThe ability of ALT and AST levels to LI in rodent models was found to be comparably effective. In order to assess potential publication bias, we employed the absolute value of the t-statistic and performed Egger’s test. The absolute t-values for both of these biomarkers did not suggest the presence of publication bias within the included studies (ALT in hepatoprotection, |t|-value = |-3.49|; AST in hepatoprotection, |t|-value = |-3.67|; ALT in hepatotoxicity, |t|-value = |1.07|; AST in hepatotoxicity, |t|-value = |1.2|) (Supplementary Tables 2, 3).
3.7 Dose–time–effect/toxicity relationship and machine learning3.7.1 Effective dose and time length of TSG on ALT and AST levelsIn the context of LI models, the therapeutic substance (TSG) has been observed to lower ALT and AST levels when administered at dosages between 30 mg/kg/day and 100 mg/kg/day, as determined by three-dimensional (3D) scatter plot analysis. By employing machine learning techniques, the precise effective dosage was refined to a narrower range of 27.27 mg/kg/day to 38.81 mg/kg/day, with an optimal dosage identified at 27.27 mg/kg/day. It is important to note that these beneficial effects are not present if the dosage falls below the threshold of 27.27 mg/kg/day. In terms of treatment duration, 3D mapping and radar chart analysis suggest that TSG’s efficacy in reducing ALT and AST levels is observed within a window of 0.43 weeks–1 week. Further research is necessary to ascertain the precise dosage and effectiveness of TSG for treatment periods extending beyond 1 week, as depicted in Figures 8–10.
留言 (0)