
記住我
Rheumatoid arthritis (RA) is an autoimmune disorder mainly defined by inflammation in the synovial joints, resulting in swelling, pain, and permanent joint damage. This significantly impairs patients’ quality of life and work capacity. Research indicates that within 10 years, the disability rate for RA patients can reach as high as 43.5%. As the number of cases continues to rise, RA has become a major rheumatic disease globally, with a prevalence of 0.5 to 1% (Almutairi et al., 2021). Although RA remains incurable, guidelines from major rheumatology associations in western countries recommend a treat-to-target strategy to alleviate symptoms and control disease progression (Aletaha et al., 2010). However, prolonged use of existing treatments, including conventional and biologic disease-modifying antirheumatic drugs (DMARDs), is frequently associated with significant side effects (El Masri et al., 2020; Gomides et al., 2021). Consequently, there is a pressing need to explore new, effective treatments with fewer adverse effects.
Recent research has increasingly explored the possible connection between gut microbiota and RA. Epidemiological and translational studies have indicated that imbalances in gut microbiota are strongly linked to RA development (Catrina et al., 2016; Scher et al., 2016; Scher et al., 2013; Holers et al., 2018). Notably, gut microbiota composition shifts significantly in the early stages of RA, contributing to the “gut-joint axis” theory (Wells et al., 2020; Zaiss et al., 2021). This theory posits that dysbiosis in gut microbiota not only promotes the onset of RA but also contributes significantly to maintaining the inflammatory state associated with the disease (Zhang X. et al., 2015; Chen et al., 2016; Marietta et al., 2016; Maeda et al., 2016; Alpizar-Rodriguez et al., 2019; Inamo, 2021; Alpizar Rodriguez et al., 2021; Jeong et al., 2019). Additionally, angiogenesis in the synovium, which provides nutrients to inflamed areas and exacerbates joint damage, is also linked to microbial imbalances (Zaiss et al., 2021; Zhang Y. et al., 2015; Alunno et al., 2015; Rogier et al., 2017). These findings offer new perspectives on RA pathophysiology and suggest the potential for therapeutic strategies targeting gut microbiota.
One research has shown that pairing mangiferin with cinnamic acid can ease RA symptoms through inhibition of the TLR4/NFκB/NLRP3 signaling pathway (Li et al., 2022). Various bioactive compounds derived from TCM, such as alkaloids, saponins, flavonoids, and terpenoids, have also shown potential in suppressing bone destruction and modulating immune responses (Shi et al., 2020). Furthermore, TCM components have been found to reduce RA symptoms by regulating endoplasmic reticulum stress, providing a basis for new therapeutic approaches (de Seabra Rodrigues Dias et al., 2021). Meta-analyses and clinical evaluations have further emphasized the effectiveness of TCM formulas in improving key biomarkers, such as rheumatoid factor and anti-cyclic citrullinated peptide antibodies, in RA patients (Tang et al., 2021). These results offer solid support for incorporating TCM into modern medical practices.
Importantly, recent studies have emphasized TCM’s considerable potential in modulating gut microbiota for RA treatment. For example, studies have shown that Danggui Niantong Decoction can improve RA by regulating gut microbiota and promoting mitochondrial apoptosis in animal models (Lu et al., 2022). Similarly, paeoniflorin has been shown to dynamically reshape gut microbiota in CIA rats, indicating its potential therapeutic effects on RA through microbiota modulation (Peng et al., 2019). These studies underscore the importance of exploring TCM’s role in modulating gut microbiota as a therapeutic strategy for RA.
In addition to gut microbiota regulation, TCM has demonstrated significant potential in inhibiting angiogenesis related to RA. For example, Yuxuebi tablets have demonstrated anti-angiogenic activity in RA rat models by inhibiting the LOX/Ras/Raf-1 signaling pathway (Su et al., 2022). Similarly, oxymatrine has been found to inhibit synovial angiogenesis in CIA rats by targeting the HIF-VEGF-Ang signaling and the PI3K/Akt pathways (Ao et al., 2022). These pieces of evidence further reinforce the potential of targeting angiogenesis to control RA progression.
Based on this background, our study hypothesizes that new bitongling (NBTL) can modulate gut microbiota to influence the VEGF pathway, thereby inhibiting angiogenesis in RA and achieving therapeutic effects. Our research team has previously demonstrated that new bitongling significantly improves the pathological state of RA in rats and alleviates arthritis symptoms by inhibiting the JAK2/STAT3 signaling pathway (Li et al., 2021). To gain deeper insights into the mechanism, we intend to apply deep neural network prediction techniques to construct a regulatory model linking gut microbiota and the VEGF pathway. Experimental validation of the model’s predictions will provide robust evidence for NBTL’s efficacy in treating RA, furthering the integration of TCM into modern medicine.
2 Materials and methods 2.1 Preparation of new bitongling and Tripterygium wilfordii tabletsNew bitongling, a traditional Chinese medicine (TCM) compound, is formulated using herbs such as Cinnamomi ramulus (Gui Zhi), Saposhnikoviae radix (Fang Feng), Ephedrae herba (Ma Huang), Sinomenii caulis (Qing Feng Teng), Aconiti radix (Chuan Wu), and Vespae nidus (Feng Fang), sourced from the pharmacy at Jiangsu Provincial Hospital of TCM. Prior to preparation, all raw herbs underwent stringent quality control measures, including morphological identification and visual inspection to verify the authenticity and purity of each herb. Additionally, each herb was standardized based on established pharmacopeial standards (China Pharmaceutical Association, 2020), ensuring that they met predefined criteria for key active components to guarantee consistency across different batches.
The preparation process involves several key steps: Aconiti radix (Chuan Wu) is first decocted in double-distilled water at 100°C for 30 min. Subsequently, the remaining herbs are added and the mixture is decocted for an additional 45–60 min. The resulting liquid is then filtered to obtain the herbal extract. This decoction process is repeated to ensure thorough extraction of active constituents. The combined extracts are concentrated and centrifuged at 5,000 rpm for 30 min to eliminate residues, yielding a final concentration of 1.22 g/mL. The decoction is then aliquoted and stored at −20°C for future use. All preparation batches underwent quality control checks, including visual inspection and adherence to standardized preparation protocols, to confirm the consistency and potency of the extracts.
For the positive control, Tripterygium wilfordii tablets containing 10 mg of the active ingredient were used. These tablets, produced by Zhejiang Deyongde Pharmaceutical Co., Ltd. (Batch number: 2204111B), were ground into a fine powder and dissolved in distilled water to create a suspension. The suspension was standardized to a final concentration of 8 mg/mL through precise measurement and preparation techniques to ensure the stability and uniformity of the active components for experimental use.
2.2 Selection of experimental animals, housing, model construction, and groupingIn this study, we selected 6-week-old female Sprague–Dawley (SD) rats, weighing between 180–200 g, sourced from Zhejiang Vital River Laboratory Animal Technology Co., Ltd. (License No. SCXK(Zhe)2021-0006). The rats were acclimatized for 1 week before the experiment in a specific pathogen-free (SPF) facility at the Affiliated Hospital of Nanjing University of Chinese Medicine (License No. SYXK(Su)2017-0069), maintained under controlled conditions (22 ± 2°C, 45–60% humidity). They had free access to SPF-grade feed (Synergy Bio, 1010086) and water. The study adhered to National Institutes of Health (NIH) guidelines for the care and use of laboratory animals and received approval from the Ethics Committee of the Affiliated Hospital of Nanjing University of Chinese Medicine (Approval No. 2022 DW-37-01).
For arthritis induction, bovine type II collagen (CII) (Beijing Bolide Biotech, 20021) was dissolved in 0.1 mol/L glacial acetic acid to a concentration of 4 g/L, stirred on ice, and stored overnight at 4°C. This solution was then emulsified with an equal volume of complete Freund’s adjuvant (CFA) (Sigma, F5881) to create a 2 g/L collagen II emulsion. The rats were randomly assigned to either a normal group or a collagen-induced arthritis (CIA) model group. The CIA induction protocol involved intradermal injections of 0.3 mL of the CII emulsion on day 1, followed by a booster dose on day 7. The primary immunization consisted of a 1:1 mix of bovine type II collagen and CFA, administered at a 2 g/L concentration. The booster immunization used a similar 1:1 mix with incomplete Freund’s adjuvant (IFA) (Sigma, F5506). Arthritis severity was evaluated on day 14 using a visual scoring system for each paw (0–4, with a maximum total score of 16): 0 for normal joints, 1 for slight swelling or erythema, 2 for moderate erythema and swelling, 3 for pronounced erythema and swelling, and 4 for severe swelling, erythema, or ankylosis (Trentham et al., 1977).
The rats with successfully induced arthritis were randomly allocated into different treatment groups, along with a blank control group selected from the normal group. The groups received the following treatments via oral gavage for 28 days (Li et al., 2021): blank control group received distilled water; model group received distilled water; low dose new bitongling group received 2.75 g/kg/day of new bitongling; medium dose new bitongling group received 5.5 g/kg/day of new bitongling; high dose new bitongling group received 11 g/kg/day of new bitongling; and the positive control group received 0.008 g/kg/day of Tripterygium wilfordii solution. The selected doses for the low, medium, and high new bitongling (NBTL) groups were based on dose extrapolation from equivalent human doses using the standard body surface area (BSA) conversion formula (Nair and Jacob, 2016; Reagan-Shaw et al., 2008). These doses were further refined through preliminary experiments reported in our prior study, which demonstrated the efficacy and safety of these specific concentrations in a similar model (Li et al., 2021). The rats were monitored daily for changes in appearance, behavior, food intake, and excretion, with body weight measurements taken weekly. After 28 days, the rats were anesthetized for blood serum collection and then euthanized for the collection of ankle and knee synovial tissue.
2.3 Preparation of serum containing new bitongling and control serumWe selected 6–8 week-old SPF-grade SD rats and randomly divided them into the traditional Chinese medicine (TCM) group and the blank control group. The TCM group received an oral gavage of new bitongling (NBTL) at the optimal dose for in vivo rat experiments (high dose: 11 g/kg/day, with a drug concentration of 1.22 g/mL). The blank control group was administered an equal volume of physiological saline. Both treatments were administered daily for seven consecutive days. One hour after the final administration, the rats were anesthetized, and blood samples were collected. The blood was allowed to clot at 4°C for 2 h to facilitate serum and clot separation. The samples were then centrifuged at 3,000 rpm for 10 min to separate the serum from the clot. The supernatant, which is the serum, was carefully collected. The collected serum was then inactivated at 56°C to eliminate any potential biological activity. This step is performed after serum separation. Following inactivation, the serum was filtered for sterilization, aliquoted, and stored at −80°C for subsequent experiments (Pan et al., 2023; Pei et al., 2024).
2.4 Identification of prototypical components and metabolites of new bitongling in blood using UPHLC-MS-TOFWe used ultra-performance high-performance liquid chromatography coupled with time-of-flight mass spectrometry (UPHLC-MS-TOF) to identify the prototypical components and metabolites of new bitongling (NBTL) in rat serum. Serum samples were prepared by protein precipitation and filtration. Chromatographic separation was performed on an acquity UPLC BEH C18 column, followed by mass spectrometric analysis with an electrospray ionization source in both positive and negative ion modes. Data processing included peak detection, alignment, and compound identification through database matching.
Ion peak data were filtered based on various conditions, with missing values removed. Positive and negative ion data were processed separately and converted to a long format for plotting, retaining only NBTL medicated serum group data. Vertical offsets were applied to avoid overlapping annotations. The “ggplot2” package (Villanueva and Chen, 2019) was used to visualize the data, creating plots for positive and negative ions to illustrate the prototypical components and metabolites.
2.5 Hematoxylin and eosin staining of synovial tissueSynovial tissue samples were fixed in 4% paraformaldehyde (PFA) (Aladdin, C104188; Sinopharm, 30525-89-4), dehydrated through graded ethanol solutions (Sinopharm, 100092683), and embedded in paraffin. Sections were cut at 4 microns, dewaxed, and rehydrated. Hematoxylin staining (Zhuhai Beisuo, BA4097) was used to highlight cell nuclei, followed by eosin staining (Zhuhai Beisuo, BA4099) to highlight cytoplasm. The sections were then dehydrated with anhydrous ethanol (Sinopharm, 100092683), cleared with xylene (Sinopharm, 1330-20-7), and mounted with neutral balsam (Sinopharm, 10004160). Hematoxylin and eosin (HE) staining was evaluated for synovial cell arrangement, hyperplasia, and inflammatory cell infiltration, with scores ranging from 0 (no lesion) to 4 (very severe) based on the extent of disorganization, hyperplasia, and infiltration. The average score was calculated to assess tissue damage severity across samples (Guo et al., 2017).
2.6 Serum enzyme-linked immunosorbent assay analysisSerum samples stored at −80°C were thawed to room temperature for enzyme-linked immunosorbent assay (ELISA) analysis. The following reagents and consumables were used: rat interleukin-6 (IL-6) ELISA kit (CSB-E04640r), rat interleukin-17 (IL-17) ELISA kit (CSB-E07451r), and rat tumor necrosis factor alpha (TNF-α) ELISA kit (CSB-E11987r) from Cusabio. Biotin-labeled antibodies and HRP-labeled streptavidin were diluted with their respective diluents at a ratio of 10 μL to 990 μL and kept on ice. The wash buffer was prepared by mixing 1 mL of concentrate with 24 mL of deionized water. Standard proteins were prepared through serial dilutions. The ELISA procedure involved adding standard proteins and serum samples to a coated 96-well plate, followed by incubation at 37°C. After 2 h, 100 μL of biotin-labeled antibody was added and incubated for another hour. The plate was then washed five times with 200 μL of wash buffer per wash, followed by the addition of 100 μL of HRP-labeled streptavidin and a 1-h incubation. The wash step was repeated, and 90 μL of 3,3′,5,5′-tetramethylbenzidine (TMB) substrate was added and incubated in the dark. Finally, 50 μL of stop solution was added, and the absorbance was measured at 450 nm using a microplate reader.
2.7 Western blot analysisIn this study, western blot analysis was performed on synovial tissue samples. Key reagents included 10X Transfer Buffer, 10X Electrophoresis Buffer (pH 8.3), and 10X Tris Buffered Saline with Tween-20 (TBST) Buffer. We prepared working solutions such as 10% sodium dodecyl sulfate (SDS), 10% ammonium persulfate (APS), and Tris-HCl buffers at pH 8.8 and 6.8, along with stacking and separating gels of varying concentrations for sodium dodecyl sulfate-polyacrylamide gel electrophoresis (SDS-PAGE). The synovial tissues were minced, ground in liquid nitrogen, and lysed using radioimmunoprecipitation assay (RIPA) buffer with a protease inhibitor cocktail (Sigma, P8340). Protein concentrations were determined using the bicinchoninic acid (BCA) protein assay kit (Beyotime, P0010). The samples were resolved on SDS-PAGE gels and transferred to polyvinylidene difluoride (PVDF) membranes (Millipore, ISEQ00010). Membranes were blocked with 5% skim milk (BD, 232100) in TBST, then incubated overnight with primary antibodies in 1% bovine serum albumin (BSA)/TBST (Sigma-Aldrich, V900933). The primary antibodies used were glyceraldehyde 3-phosphate dehydrogenase (GAPDH) (Zen-Bio, 200306-7E4), vascular endothelial growth factor (VEGF) (Santa Cruz, sc-53463), vascular endothelial growth factor receptor 1 (VEGFR1) (Proteintech, 19003-1-AP), vascular endothelial growth factor receptor 2 (VEGFR2) (Abcam, ab32152), hypoxia-inducible factor 1-alpha (HIF-1α) (Santa Cruz, SC-13515), and apoptosis-associated speck-like protein containing a CARD (ASC) (Santa Cruz, sc-514414). Secondary antibodies included HRP-conjugated anti-mouse (Beyotime, A0216) and anti-rabbit (Beyotime, A0208), as well as fluorescent antibodies Alexa Fluor 488 Donkey Anti-Rabbit IgG (H + L) (Abcam, ab150061) and Alexa Fluor 488 Donkey Anti-Mouse IgG (H + L) (Abcam, ab150105). Detection was performed using an enhanced chemiluminescence (ECL) substrate (Tanon, 180-5001) and visualized with a Tanon5200 Imaging System.
2.8 Quantitative polymerase chain reaction for mRNA and miRNA analysis in rat and cell samplesFor quantitative polymerase chain reaction (qPCR) detection of mRNA and miRNA in rats and cells, we use specific kits and reagents. RNA is extracted using RNAiso Plus from Takara, combined with Alladin’s chloroform, isopropanol, ethanol, and diethylpyrocarbonate (DEPC) (C128130, I112011, E111989, D105557). This involves homogenizing in TRIzol (Thermo Fisher Scientific, 15596026), adding chloroform, and undergoing centrifugation to isolate RNA, which is then precipitated and washed before dissolving in DEPC water for concentration measurement.
For reverse transcription, the PrimeScript™ RT kit with gDNA Eraser from Takara is used for mRNA, while miRNA in rats employs the Ribobio’s Bugle-Loop™ RT kit (Guangzhou RiboBio Co., Ltd.) (Zhou et al., 2015), following the specific protocols of each. Quantitative PCR is performed using SYBR® Premix Ex Taq™ from Takara, starting with a 95°C denaturation, followed by 40 cycles and melting curve analysis.
Expression levels are calculated using the 2−ΔΔCT method, comparing Ct values between target and reference genes (Livak and Schmittgen, 2001). Rat mRNA primers are detailed in Table 1. Due to intellectual property constraints, rat miRNA primer sequences from the Ribobio kit are not disclosed. Cell miRNA primers are provided in Table 2.
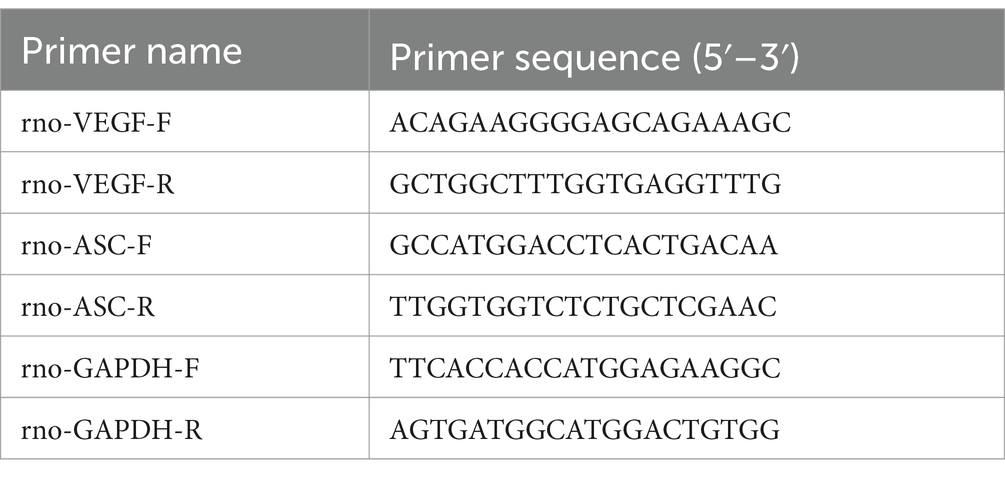
Table 1. mRNA gene primer sequences.
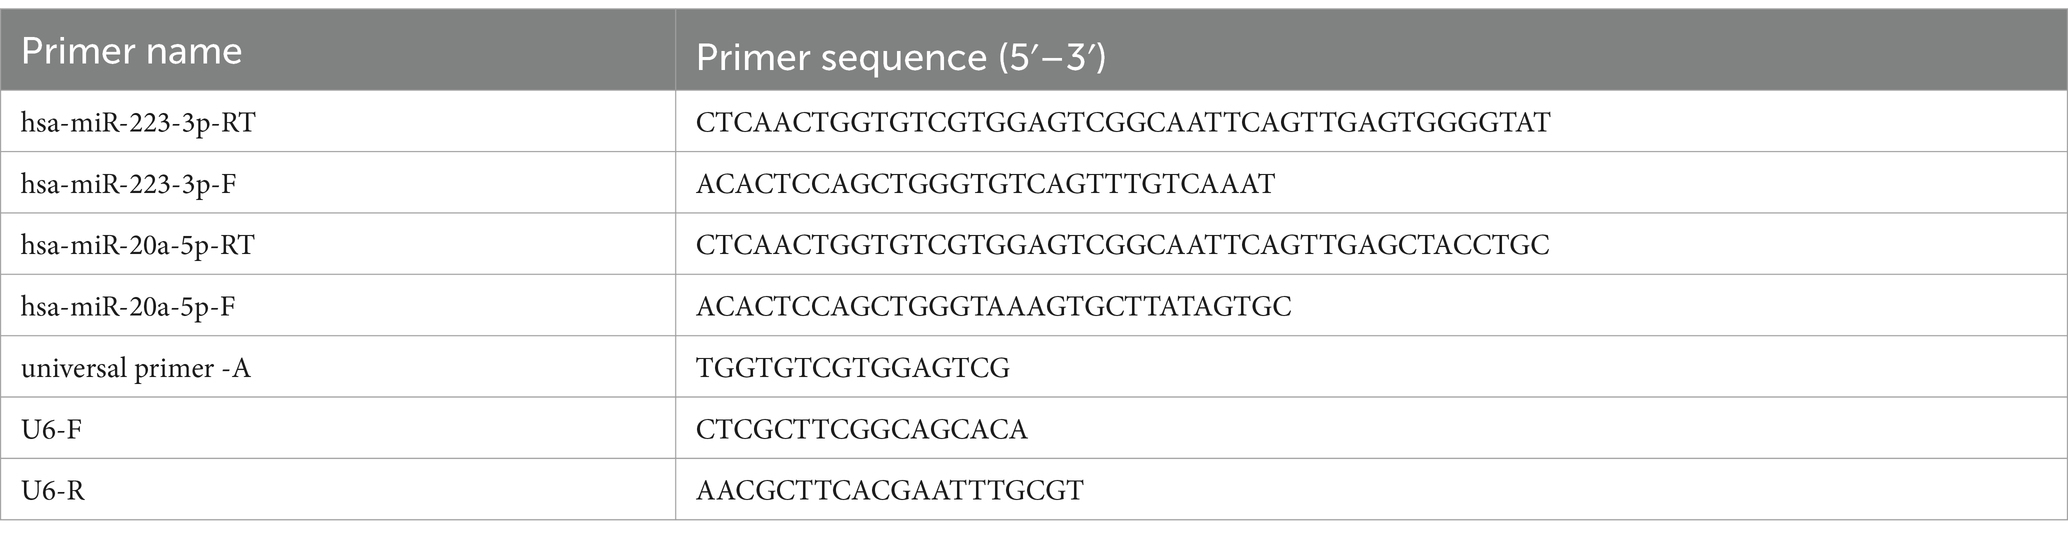
Table 2. miRNA gene primer sequences.
2.9 Gut microbiota 16S rDNA sequencing of ratsRats were anesthetized with 10% Sodium Pentobarbital (Wengjiang Reagent, CAS: 57-33-0) via intraperitoneal injection. Fecal samples were collected under sterile conditions and either used immediately or stored at −80°C. Microbial DNA was extracted using the E.Z.N.A.® Soil DNA Kit (Omega Bio-tek, United States), with quality checked by agarose gel electrophoresis. Concentration and purity were measured with a NanoDrop2000 spectrophotometer (Thermo Scientific, United States). The V3–V4 region of the 16S rRNA gene was amplified using primers 338F and 806R. The PCR mix included TransStart FastPfu Buffer, dNTPs, primers, and DNA polymerase, in a final volume of 20 μL. The PCR process began with denaturation at 95°C for 3 min, followed by 27 cycles at 95°C, 55°C, and 72°C, each for 30 s. The final step was a 10-min extension at 72°C, followed by cooling at 4°C. PCR products were separated on a 2% agarose gel, then purified and quantified. Sequencing libraries were created using the NEXTFLEX Rapid DNA-Seq Kit, which included adapter ligation, magnetic bead purification, and PCR amplification. Sequencing was performed using the Illumina PE300/PE250 platform. The raw paired-end data underwent quality control with Fastp (Chen et al., 2018) (v0.19.6) and were merged using FLASH (Magoč and Salzberg, 2011) (v1.2.11). Clustering into operational taxonomic units (OTUs) was done with UPARSE (Edgar, 2013; Stackebrandt and Goebel, 1994) (v7.1) at 97% similarity, with chimeric and mitochondrial sequences removed. To balance sequencing depth, each sample was normalized to 20,000 reads, achieving a Good’s coverage of 99.09%. OTUs were classified with the RDP Classifier (Wang et al., 2007) (v2.11) at a 70% confidence threshold, referencing the Silva 16S rRNA Gene Database (v138), followed by community composition analysis.
2.10 Preliminary analysis of gut microbiotaThe “data table” package (Barrett et al., 2021) was used to read the OTU table, set OTU ID as row names, and extract sample and taxonomy tables. The “amplicon” package (Callahan et al., 2016) calculated microbial relative abundance with a threshold of 1 × 10⁻⁴.
The “ropls” package (Thévenot et al., 2015) constructed the partial least squares discriminant analysis (PLS-DA) model, and the “ggplot2” and “ggsci” (Xiao, 2023) packages visualized the results, including sample score and variable importance plots.
To observe gut microbial abundance changes, the total abundance of each species was calculated and sorted. The top 10 species by abundance and the total abundance of remaining species were displayed using stacked bar plots with “ggplot2” package. The “aplot” package (Yu, 2023) added group information.
For LEfSe (linear discriminant analysis effect size) analysis, the OTU table was loaded with identifiers as row names. A sample table and formatted taxonomy table were created. The “microeco” package (Liu C. et al., 2021) integrated these tables into a Microtable object. LEfSe analysis was conducted using the trans_diff$new function, with bar plots and a cladogram generated for taxonomic differences. Correlation analysis with the “corrplot” package (Wei et al., 2021) produced a correlation heatmap among gut microbiota.
2.11 Identification and analysis of characteristic gut microbiota associated with NBTL treatment in rheumatoid arthritis using SVM-RFE and random forestWe utilized the “tidyverse” (Wickham et al., 2019) packages for data preprocessing. The support vector machine-recursive feature elimination (SVM-RFE) algorithm, implemented via the “e1071” package (Meyer et al., 2023), was employed for feature selection, identifying influential features for classification. K-fold cross-validation evaluated the feature set effectiveness, with error rates and model accuracy visualized to assess the impact of feature subsets. The best-performing subset was selected based on error rates. A random forest model, created with the “randomForest” package (Liaw and Wiener, 2002), evaluated feature importance, and its generalizability was tested with five repetitions of 10-fold cross-validation. The optimal feature subset was selected based on importance scores and error rates.
Next, key microbiota identified from the SVM-RFE and random forest analyses were extracted and compared using the “VennDiagram” package (Chen and Boutros, 2011), with overlapping microbiota exported for receiver operating characteristic (ROC) analysis. The “pROC” package (Robin et al., 2011) was used for ROC analysis, calculating the area under the curve (AUC) values. An AUC >0.7 was considered indicative of strong discriminative power for key microbiota. ROC curves were plotted and saved, and data for high AUC microbiota were exported.
Finally, the “data table” and “tidyverse” packages processed expression data of target microbiota. Boxplots were generated with the “ggsignif (Ahlmann-Eltze and Preisenergie, 2021), “ggplot2,” and “ggpubr” (Kassambara, 2023) packages to illustrate abundance differences among groups. The stat_compare_means function added p-values, identifying significant microbiota associated with NBTL treatment for rheumatoid arthritis.
2.12 Transcriptomic sequencing of rat synovial tissue mRNARNA was extracted from tissue samples using TRIzol® Reagent (Invitrogen) and RNAiso Plus (Takara, 9108). Concentration, purity, and integrity were assessed with a NanoDrop 2000 spectrophotometer and agarose gel electrophoresis. Quality was further verified using an Agilent 2100 Bioanalyzer, ensuring ≥1 μg of total RNA, a concentration of at least 50 ng/μL, and an OD 260/280 ratio within 1.8 to 2.2. diethylpyrocarbonate (DEPC) water (Alladin, D105557) was used in all preparations to ensure RNase-free conditions. mRNA was extracted using Oligo(dT) magnetic beads, then fragmented into ~300 bp pieces with a buffer for Illumina Sequencing. Using the PrimeScript™ RT reagent Kit with gDNA Eraser (Takara, RR047A), double-stranded cDNA was synthesized from fragmented mRNA with random primers. The cDNA then underwent end repair, A-tailing, and Y-shaped adapter ligation using the Truseq™ RNA Sample Prep Kit (Illumina). Adapter-ligated cDNA was purified, size-selected, and amplified by PCR to generate the final sequencing library. The libraries were quantified with the QuantiFluor® dsDNA System (Promega), and sequencing was conducted on the Illumina HiSeq X Ten platform using its reagent kit. Sequencing reads were analyzed for base distribution and quality, followed by quality control, reference genome alignment, and expression level analysis, with results reported in transcripts per million (TPM).
2.13 Preliminary bioinformatics analysis of the genetic basis of angiogenesisWe used the “ropls” package to create a PLS-DA model, extracting results like the model summary and VIP (variable importance in projection) values. Sample distributions and confidence ellipses were then plotted using the “ggplot2” package. Kyoto Encyclopedia of Genes and Genomes (KEGG) gene sets were acquired using the “msigdbr” package (Dolgalev, 2022) to prepare gene lists for gene set variation analysis (GSVA). The analysis was carried out with the “GSVA” package (Hänzelmann et al., 2013), followed by differential analysis using GraphPad Prism.
For weighted gene co-expression network analysis (WGCNA), we processed and cleaned the gene expression data. The “WGCNA” package (Langfelder and Horvath, 2008, 2012) was then used for clustering analysis and the removal of outlier samples. The optimal soft threshold was determined, and a co-expression network was constructed to identify modules. These modules were analyzed for their correlation with phenotypic traits, and relevant plots were generated.
Next, module genes were analyzed for protein–protein interactions (PPI) using the STRING database (Szklarczyk et al., 2019). Cytoscape (Shannon et al., 2003) was used to visualize the interaction data, and the cytoHubba plugin (Bader and Hogue, 2003) identified hub genes through degree analysis. Following this, we read and cleaned the gene expression data, imported the top 10 genes based on degree ranking, and standardized the GSVA results for the vascular endothelial growth factor (VEGF) pathway. The “vegan” package (Oksanen et al., 2022) was used for correlation analysis, and the results were visualized with the “ggcor” package (Huang et al., 2020).
We imported and cleaned the synovial PCR results and microbiota data. Spearman correlation tests were conducted to examine relationships between these datasets, and scatter plots were generated. Lastly, we imported synovial PCR data, selected samples, conducted correlation tests, and plotted scatter diagrams to display the relationship between miRNA and VEGF expression.
2.14 Deep neural network model construction and evaluationLoad the “data table,” “mlr3” (Lang et al., 2019), “mlr3learners” (Lang et al., 2023), “mlr3pipelines” (Binder et al., 2021), and “keras” (Chollet and Allaire, 2023) packages, and use the “reticulate” package (Kalinowski et al., 2024) to access the Keras library (Chollet, 2015) from a Python environment. Specify the working directory, load the dataset, and split it into 80% for training and 20% for testing. Standardize the training data and apply principal component analysis (PCA) for dimensionality reduction. Construct a sequential deep neural network (DNN) model with two hidden layers, using rectified linear unit (ReLU) activation and the Adam optimizer. The model was compiled using mean squared error (MSE) as the loss function and mean absolute error (MAE) as the performance metric. It was trained with a 20% validation split and evaluated on the test set. Plot comparisons of predicted versus actual values, calculate the R2 value, monitor the loss curve during training, and display a graphical representation of the model structure.
2.15 Cell culture and screening for the effective concentration of NBTL-containing serumHuman umbilical vein endothelial cells (HUVECs) were sourced from the American Type Culture Collection (ATCC) and stored in liquid nitrogen. Before culture, cells were quickly thawed in a 37°C water bath and transferred to a 15 mL centrifuge tube containing 10 mL of pre-warmed Roswell Park Memorial Institute (RPMI)-1640 medium (Gibco, C11875500BT) supplemented with 10% fetal bovine serum (FBS) (Gibco, 10099-141C) and 2 mM L-glutamine. After centrifugation at 1,000 rpm for 5 min, the supernatant was discarded, and the cell pellet was resuspended in fresh pre-warmed medium and transferred to a pre-coated T25 culture flask. HUVECs were maintained at 37°C in a 5% CO2 atmosphere, with medium changes every 2–3 days. Cells were passaged at 80–90% confluence using 0.25% trypsin-EDTA (Gibco, Wisent 325-043-EL) for 1–2 min at 37°C, followed by centrifugation at 1,000 rpm for 5 min. Digestion was halted with an equal volume of RPMI-1640 containing 10% FBS, and cells were resuspended in fresh complete medium and redistributed into new culture flasks. For cryopreservation, cells were harvested, resuspended in CELLSAVING serum-free cryopreservation solution (C40100), aliquoted into cryovials, and stored at −80°C.
To screen for the effective concentration of NBTL-containing serum, HUVECs were cultured to an appropriate density and seeded into 96-well plates at 5 × 10³ cells per well in RPMI-1640 medium with 10% FBS. Cells were treated with various concentrations of NBTL-containing serum (0, 2, 4, 8, 12, 16, 20%) or an equal volume of blank rat serum for 24 h at 37°C and 5% CO2. It is important to note that the intervention was carried out solely with rat serum and RPMI-1640 basal medium, without the addition of FBS. Each concentration was tested in triplicate, followed by the addition of 10 μL of Cell Counting Kit-8 (CCK-8) reagent (APExBIO, K1018) and 90 μL of RPMI-1640 medium, with further incubation for 1–4 h. Absorbance was measured at 450 nm using a microplate reader.
2.16 Scratch assayHUVECs (1 × 10⁵ cells per well) were cultured in 6-well plates until they reached confluence. A scratch was then created using a sterile 200 μL pipette tip, followed by treatment with either NBTL-containing serum at its optimal concentration or blank rat serum. Cell migration and scratch closure were evaluated by capturing images at the beginning (0 h) and after 24 h using an inverted microscope.
2.17 Carboxyfluorescein diacetate succinimidyl ester flow cytometryHUVECs (1 × 10⁵ cells per well) were seeded in 6-well plates and labeled with 10 μM carboxyfluorescein diacetate succinimidyl ester (CFSE) (Beyotime, C1031). After 15 min of incubation at 37°C in the dark, the cells were rinsed with phosphate-buffered saline (PBS) (Nanjing Shengxing, SN331). The cells were then exposed to either control rat serum or NBTL-containing serum for 24 h, collected, and resuspended in PBS. Flow cytometry was used to assess cell proliferation, utilizing a 488 nm excitation and 518 nm emission.
2.18 Angiogenesis assayHUVECs (1 × 10⁵ cells per well) were first cultured in 6-well plates and treated with either control rat serum or NBTL-containing serum for 24 h. The cells were then transferred to Matrigel-coated 24-well plates (1.5 × 10⁵ cells per well) and incubated for 4 h. Tube formation was documented and quantified using ImageJ software with the Angiogenesis Analyzer plugin.
2.19 Immunofluorescence assayCells were seeded at 1 × 10⁵ density into 3.5 cm glass-bottom culture dishes and incubated overnight. The next day, the media was replaced with control or drug-containing serum based on CCK8 results, followed by a 24-h incubation. Cells were fixed with 4% paraformaldehyde (PFA) for 10 min, then washed with pre-cooled PBS and permeabilized using 0.5% Triton X-100 on ice. Blocking was performed with 3% bovine serum albumin (BSA) for 30 min at room temperature. Cells were incubated overnight at 4°C with primary antibodies (VEGF, VEGFR2, HIF-1α, VEGFR1) diluted in PBS with 1% BSA. After washing, secondary antibodies (1:400 dilution) were applied for 1 h at room temperature in the dark. Nuclei were stained with 100 ng/mL DAPI for 10 min, followed by washes. Finally, an anti-fade reagent was added, and the cells were imaged using a fluorescence microscope.
2.20 Statistical analysis and software utilizationIn this study, the analysis and processing of gut microbiota data were primarily conducted using R software (R Core Team, 2021) (version 4.3.0). For the correlation analysis between synovial PCR results and characteristic gut microbiota, R software (version 4.3.1) was employed. The construction and training of the deep neural network (DNN) model utilized R software (version 4.3.0), while other R analyses were mainly performed using version 4.3.2. Grayscale value analysis of western blot results, scratch assay migration area analysis, and angiogenesis assay analysis were all conducted using ImageJ software. CFSE flow cytometry analysis was carried out with FlowJo software (version 10.8.1). Further data processing and graphical plotting were completed using GraphPad Prism software (version 9.5.0).
For statistical comparisons, one-way analysis of variance (ANOVA) was used for comparisons among multiple groups with a single factor, and two-way ANOVA was employed for comparisons involving two factors. Paired t-tests were used for within-group comparisons, while unpaired t-tests were employed for comparisons between independent groups. Before performing statistical tests, normality was assessed using the Shapiro–Wilk test, and homogeneity of variance was evaluated using Levene’s test. If these assumptions were met, parametric tests (ANOVA and t-tests) were applied. For non-normally distributed data, non-parametric tests (e.g., Mann–Whitney U test) were used.
In all statistical analyses, significance levels were set as follows: p-values under 0.05 were considered statistically significant, those below 0.01 were highly significant, and p-values less than 0.001 or 0.0001 were deemed extremely significant.
2.21 Statistical power and sample size 2.21.1 Animal experimentsThe experiment involved six groups: control, model, low-dose NBTL, medium-dose NBTL, high-dose NBTL, and positive control, with each group containing eight animals (n = 8). As stated in Trentham et al. (1977), Charan and Kantharia (2013), and Vesterinen et al. (2014), a sample size of 8 is widely accepted in studies of collagen-induced arthritis (CIA) and is adequate to identify significant differences in metrics such as arthritis and histopathological scores. This design provides a statistical power exceeding 80% for primary outcome measures.
2.21.2 Gut microbiota analysisThree groups were analyzed: control, model, and high-dose NBTL, with n = 8 per group. Gut microbiota composition and diversity were evaluated using 16S rDNA sequencing. Xu et al. (2020) and Liu J. et al. (2021) confirms that this sample size is sufficient to detect significant intergroup variations in microbiota profiles, enabling robust α and β diversity analyses, LEfSe analysis, and key taxa identification. The statistical power of the gut microbiota analysis was evaluated using R based on OTU-level data. The OTU table, metadata, and taxonomy data were merged using sample IDs, and the group variable (control, model, high-dose NBTL) was defined as an ordered factor. OTU abundance was normalized through z-score transformation to ensure consistency across samples. Significant OTUs were identified using Kruskal–Wallis tests (p < 0.05). Effect sizes were calculated for significant OTUs using MANOVA, and the average effect size was used for power analysis with the R “pwr” (Champely, 2020) package, assuming a sample size of n = 8 per group and three groups. The results indicated a statistical power of 0.9233 (Supplementary material S1), confirming the study’s sensitivity to detect significant differences in gut microbiota composition between groups.
2.21.3 Synovial transcriptomics analysisGroups included control, model, and high-dose NBTL, with each group consisting of six samples (n = 6). Synovial tissues were subjected to RNA-Seq analysis for gene expression and pathway enrichment. As noted by Love et al. (2014) and Shu et al. (2021), n = 6 is considered adequate for detecting differentially expressed genes (DEGs) and changes in pathway activity. Power analysis (Supplementary material S1) involved preprocessing count matrices, estimating dispersion using the “RnaSeqSampleSize” (Zhao et al., 2021) package, and calculating statistical power at a significance level of 0.01 and a fold-change threshold of 2. The power for transcriptomic data was calculated to be 0.8193.
2.21.4 Deep neural network model predictionPower analysis details (Supplementary material S2) include root-mean-square error (RMSE), Shapiro–Wilk tests for residual normality, and Pearson correlation coefficients. The model exhibited an RMSE of 0.084 (training) and 0.134 (testing), residual p-values of 0.124 (training) and 0.640 (testing), and Pearson correlation coefficients of 0.819 (training) and 0.979 (testing).
2.21.5 Western blotSix experimental groups—control, model, low-dose NBTL, medium-dose NBTL, high-dose NBTL, and positive control—were analyzed with n = 3 biological replicates per group. As per Chen et al. (2023), this sample size, combined with internal control normalization, suffices to detect significant differences in protein expression.
2.21.6 Quantitative PCRSix groups (control, model, low-dose NBTL, medium-dose NBTL, high-dose NBTL, and positive control) were assessed, with three biological replicates per group (n = 3) and three technical replicates per sample. According to Livak and Schmittgen (2001) and Nan et al. (2023), this configuration ensures stable and reliable results.
2.21.7 ELISAGroups included control, model, low-dose NBTL, medium-dose NBTL, high-dose NBTL, and positive control, with each group comprising three biological replicates (n = 3). As stated by Li et al. (2021), this sample size is adequate for measuring significant differences in cytokines such as TNF-α, IL-6, and IL-17.
2.21.8 Cellular experimentsTwo experimental groups were analyzed: control (20% blank serum) and NBTL-treated serum (20%), with three biological replicates per group (n = 3). This setup supported wound healing, tube formation, proliferation, and immunofluorescence assays. Referring to Qian et al. (2021) and Mosmann (1983), this sample size is commonly used in cellular studies and is sufficient to capture significant changes in angiogenesis, migration, and proliferation.
3 Results 3.1 Comprehensive analysis of prototype components and metabolites of NBTL in blood using UPHLC-MS-TOFUsing UPHLC-MS-TOF, we conducted an in-depth analysis of the prototype components and metabolites of new bitongling (NBTL) after its entry into the bloodstream.
In the positive ion mode (Figure 1A and Table 3), the primary prototype components identified included zingerone (Rt. min. 5.029, m/z: 177.0907), wogonoside (Rt. min. 7.219, m/z: 461.1054), and uracil (Rt. min. 2.764, m/z: 113.0346), among others. In the negative ion mode (Figure 1B and Table 4), the main components detected were terpineol-4 (Rt. min. 8.989, m/z: 153.12506), succinic anhydride (Rt. min. 13.701, m/z: 99.00613), and salicyluric acid (Rt. min. 6.295, m/z: 194.04202), among others.
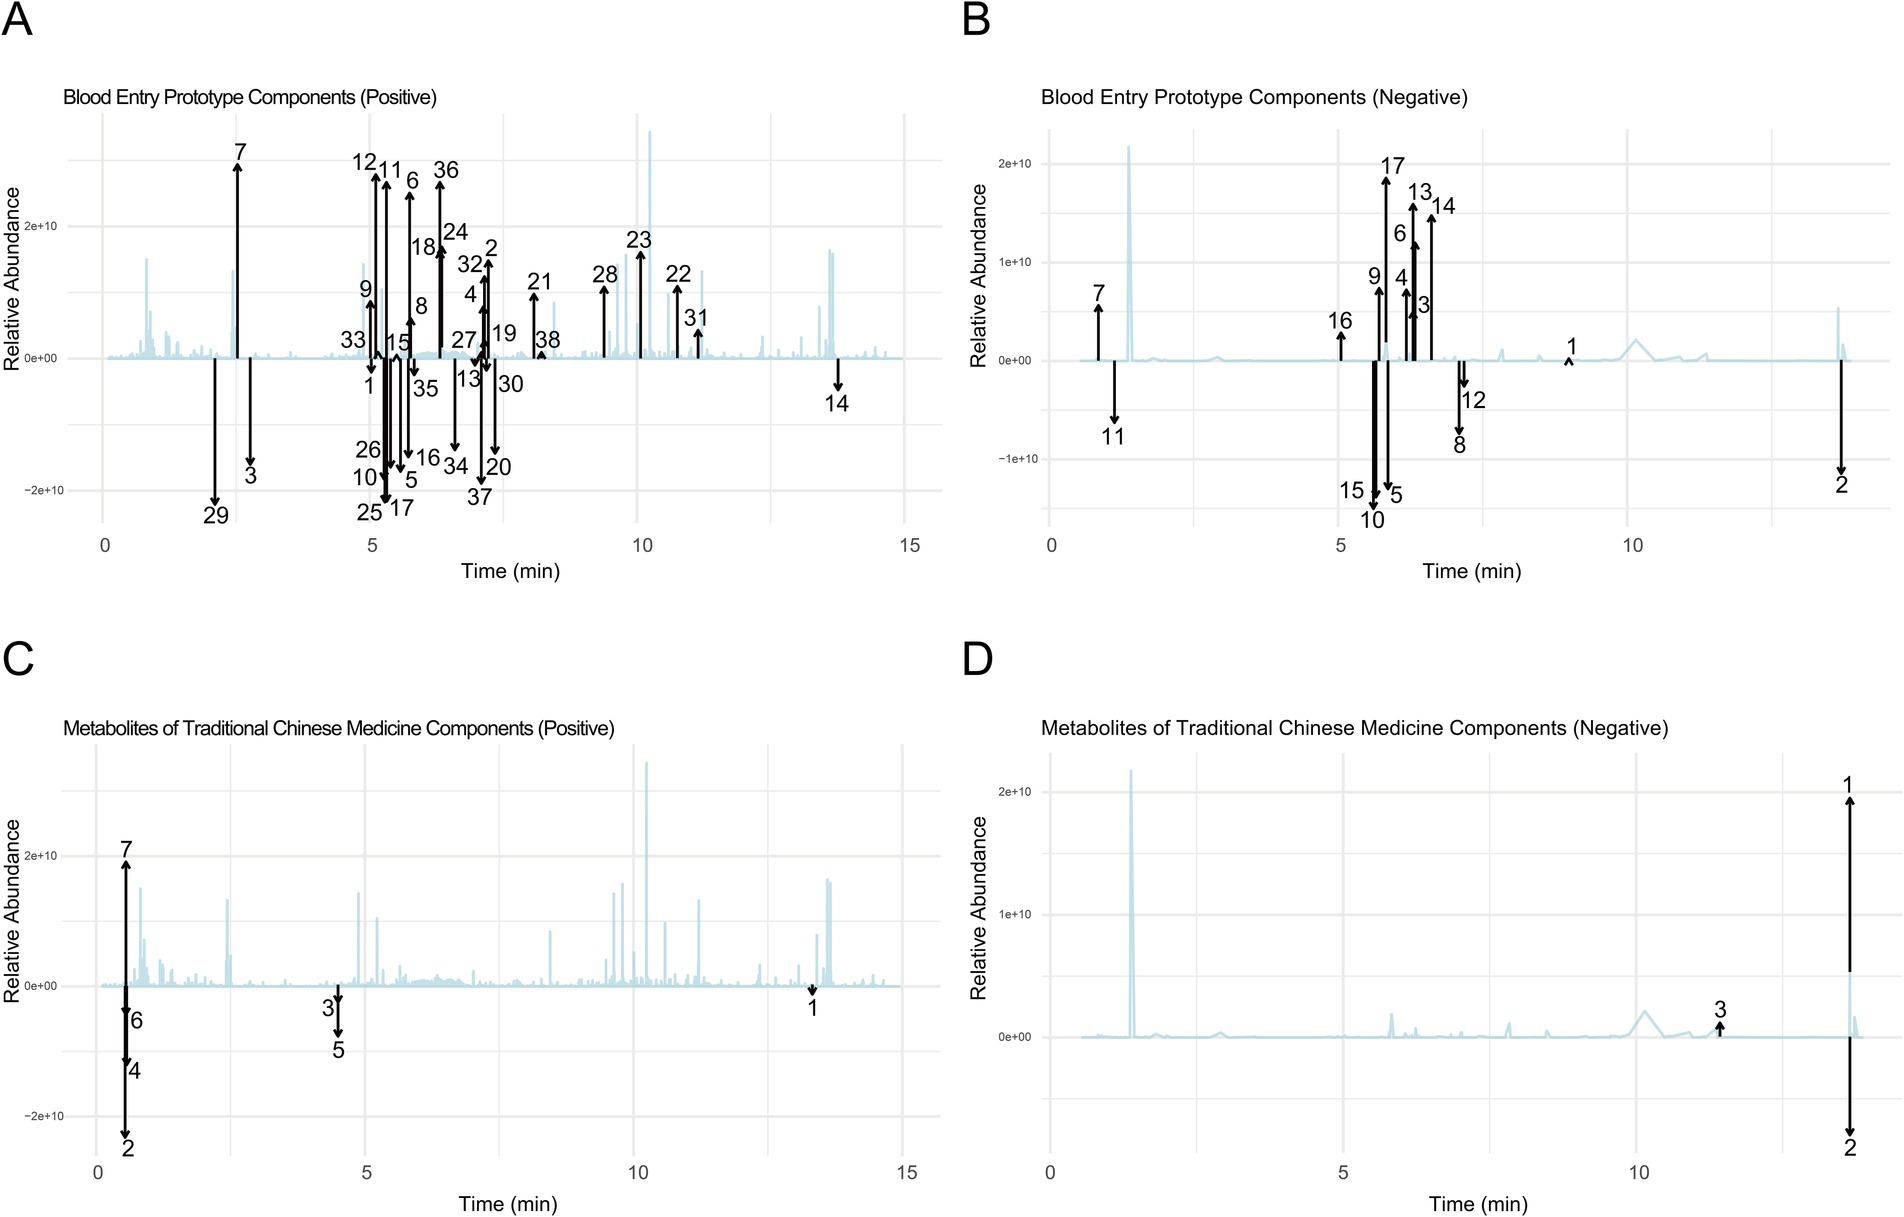
Figure 1. Comprehensive analysis of prototype components and metabolites of NBTL in blood using UPHLC-MS-TOF. (A) Blood entry prototype (positive). (B) Blood entry prototype (negative). (C) Metabolites of TCM (positive). (D) Metabolites of TCM (negative).
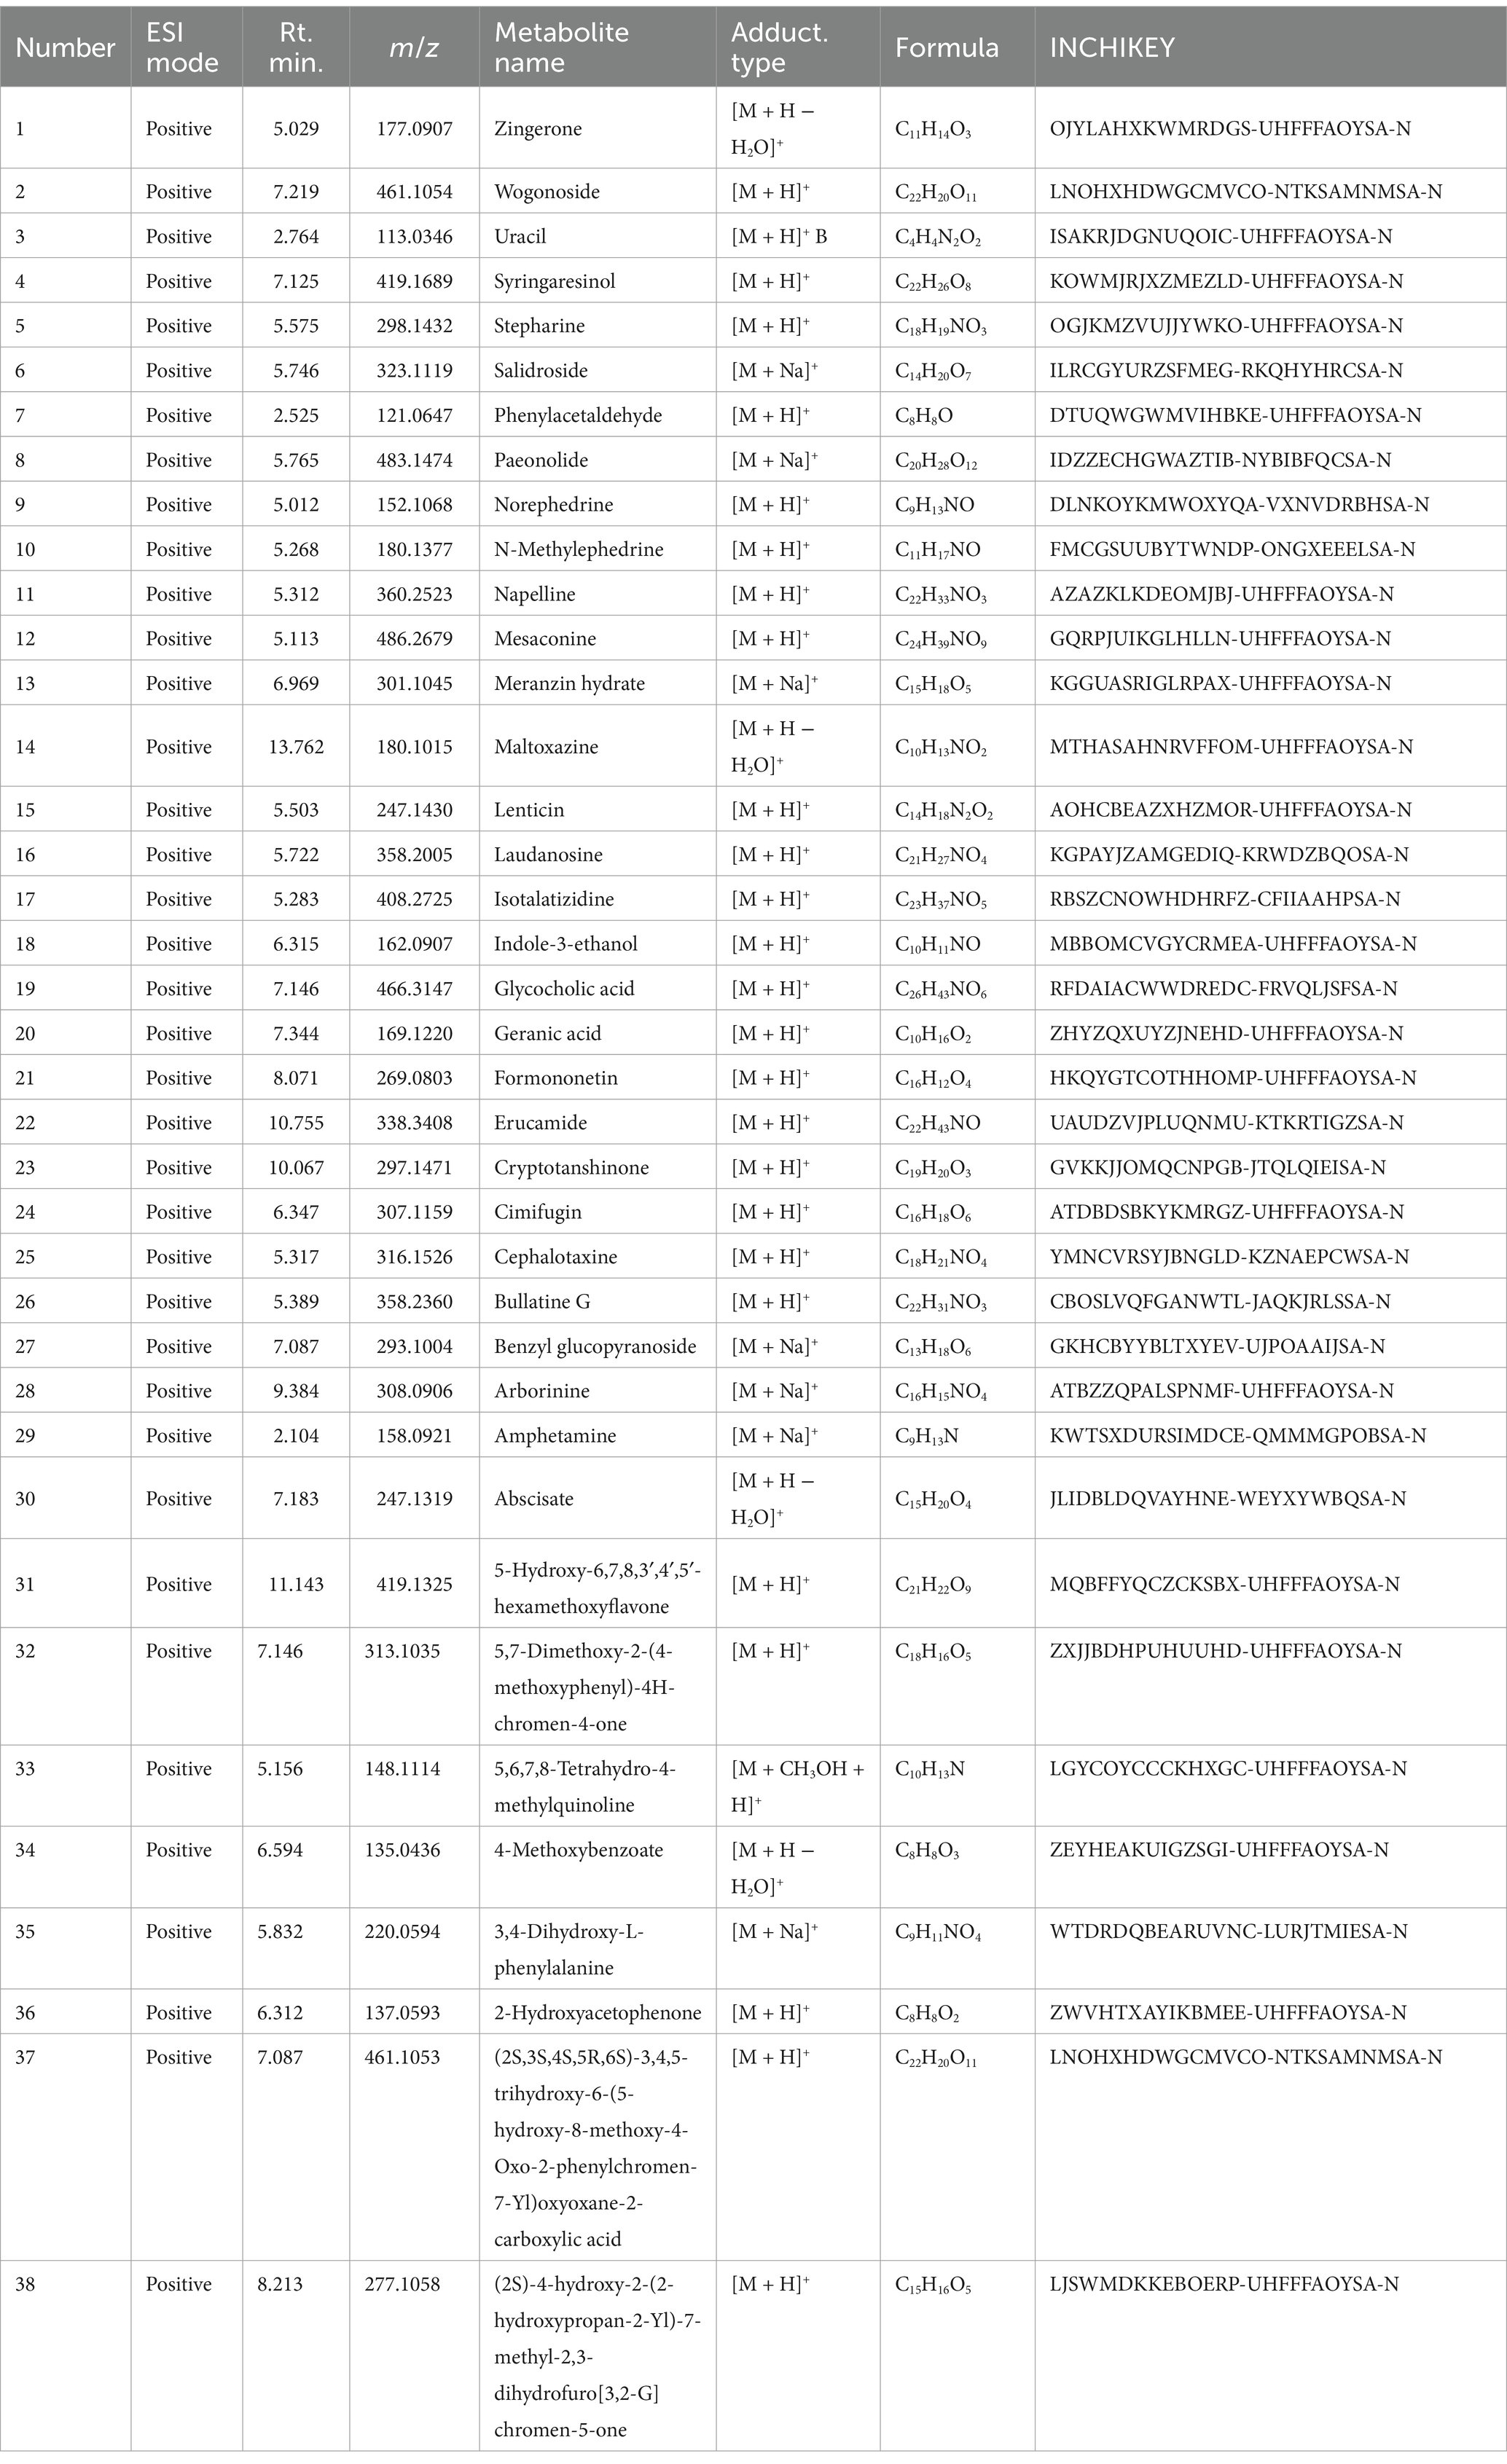
Table 3. Blood entry prototype components (positive).
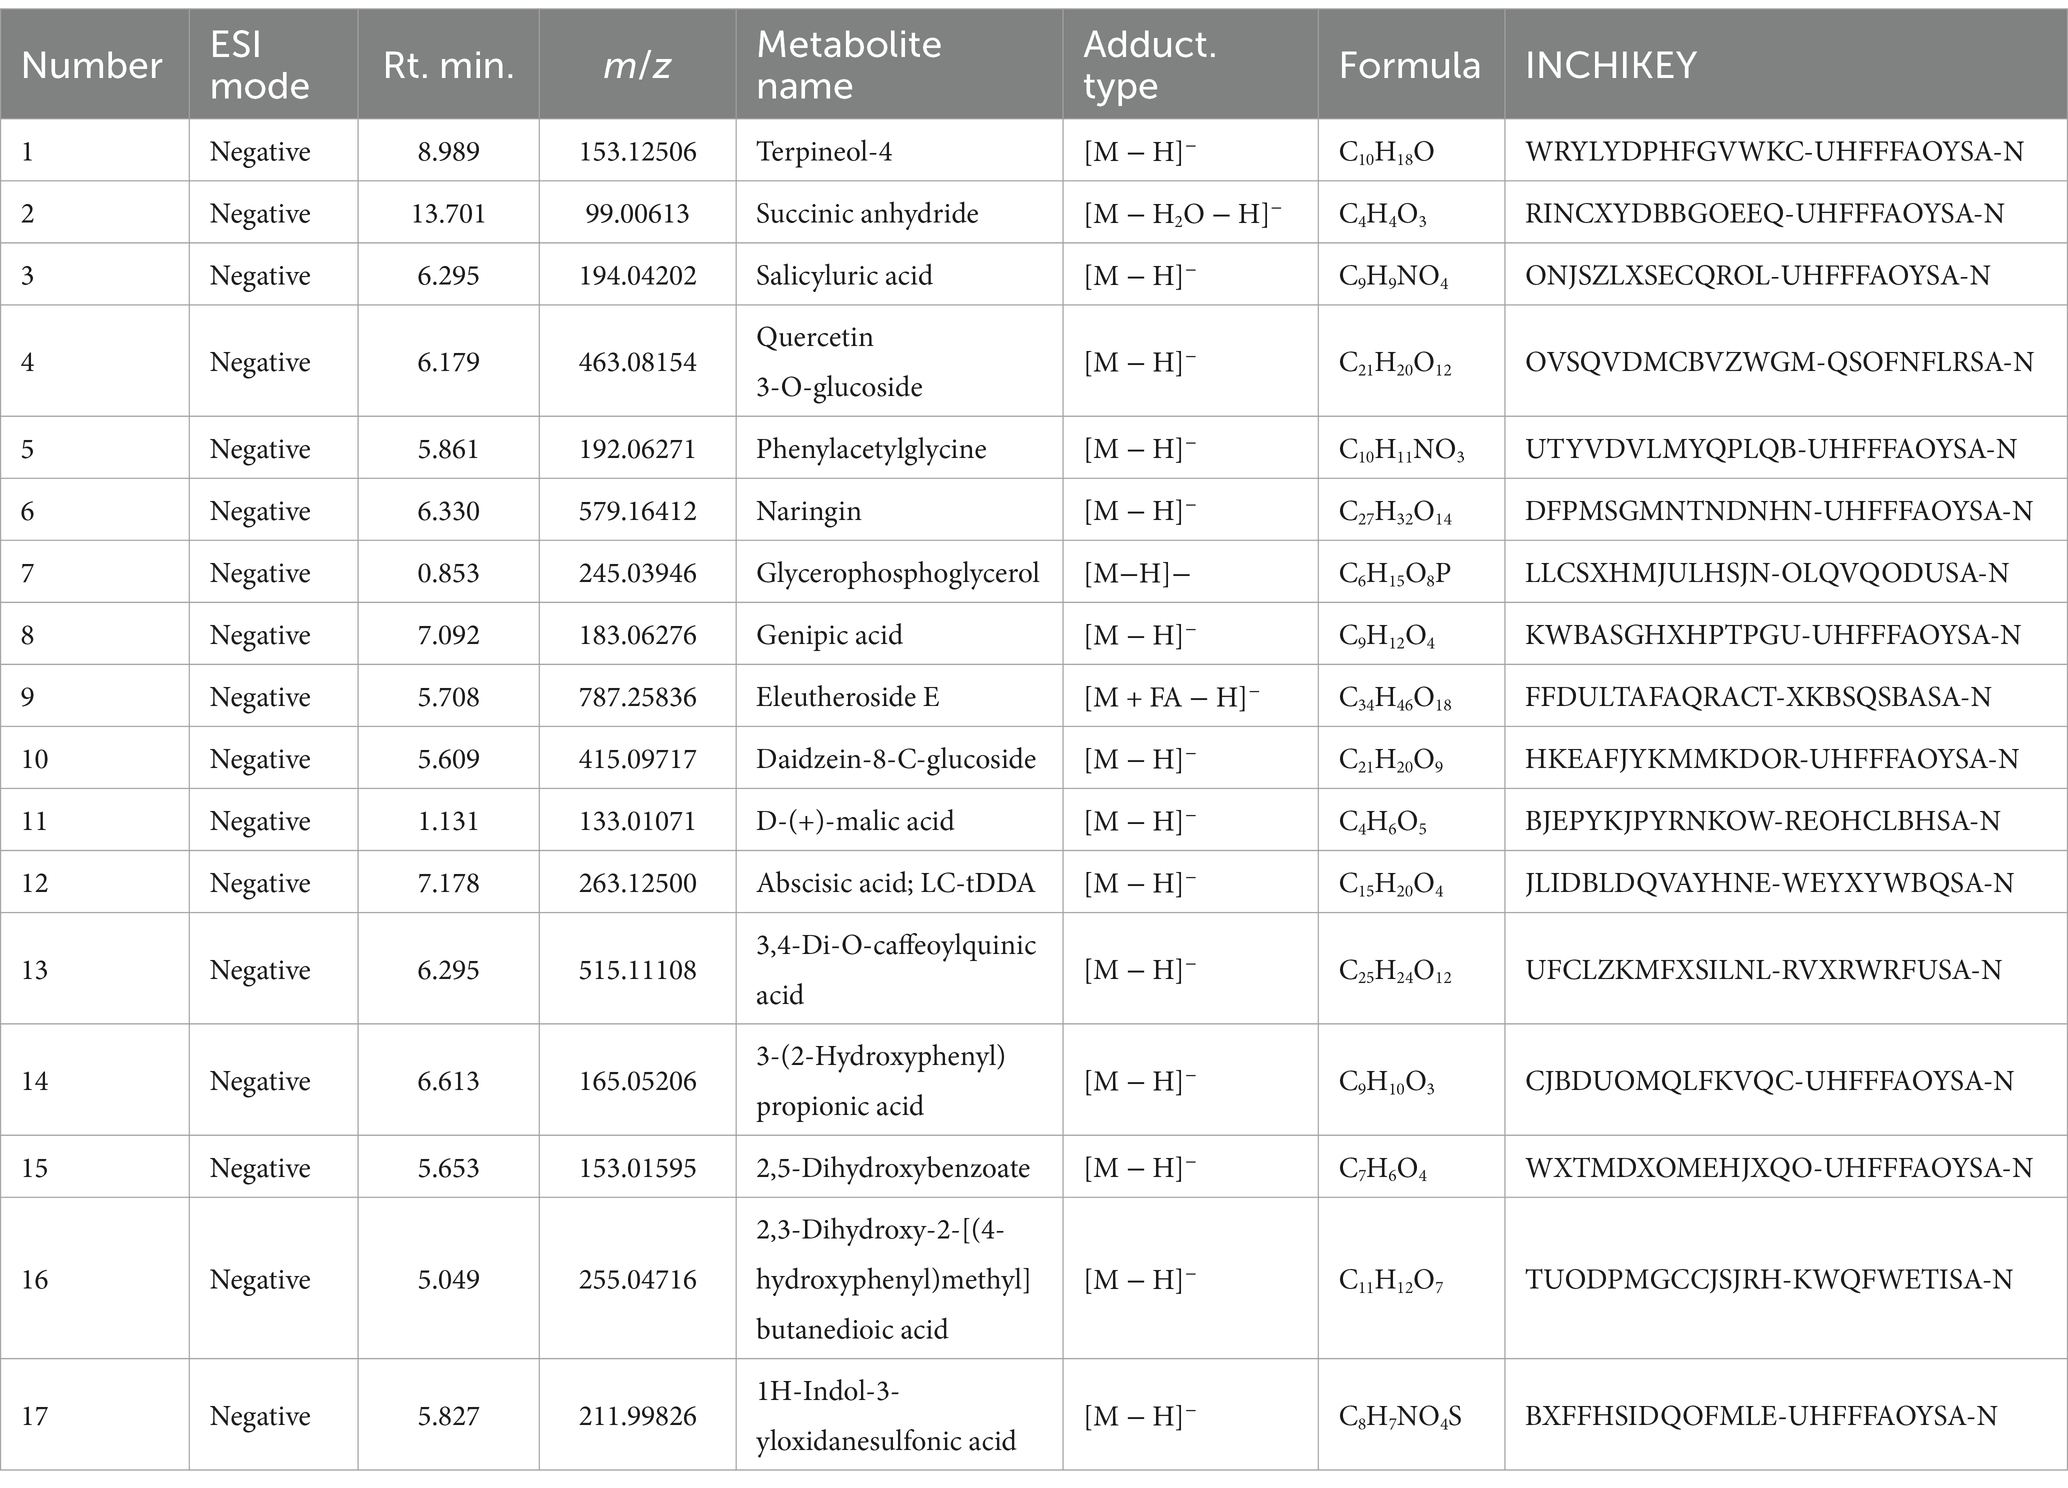
Table 4. Blood entry prototype components (negative).
Furthermore, the analysis of NBTL metabolites in the bloodstream revealed several key compounds. In the positive ion mode (Figure 1C and Table 5), we identified pyrimidine (Rt. min. 13.328, m/z: 81.04522), pyridine (Rt. min. 0.539, m/z: 80.04992), and myrcene (Rt. min. 4.501, m/z: 137.13211), among others. In the negative ion mode (Figure 1D and Table 6), the primary metabolites detected included D-galactose (Rt. min. 13.649, m/z: 179.0527), arabitol(D) (Rt. min. 13.649, m/z: 151.0578), and (+)-triptophenolide (Rt. min. 11.431, m/z: 311.1644), among others.
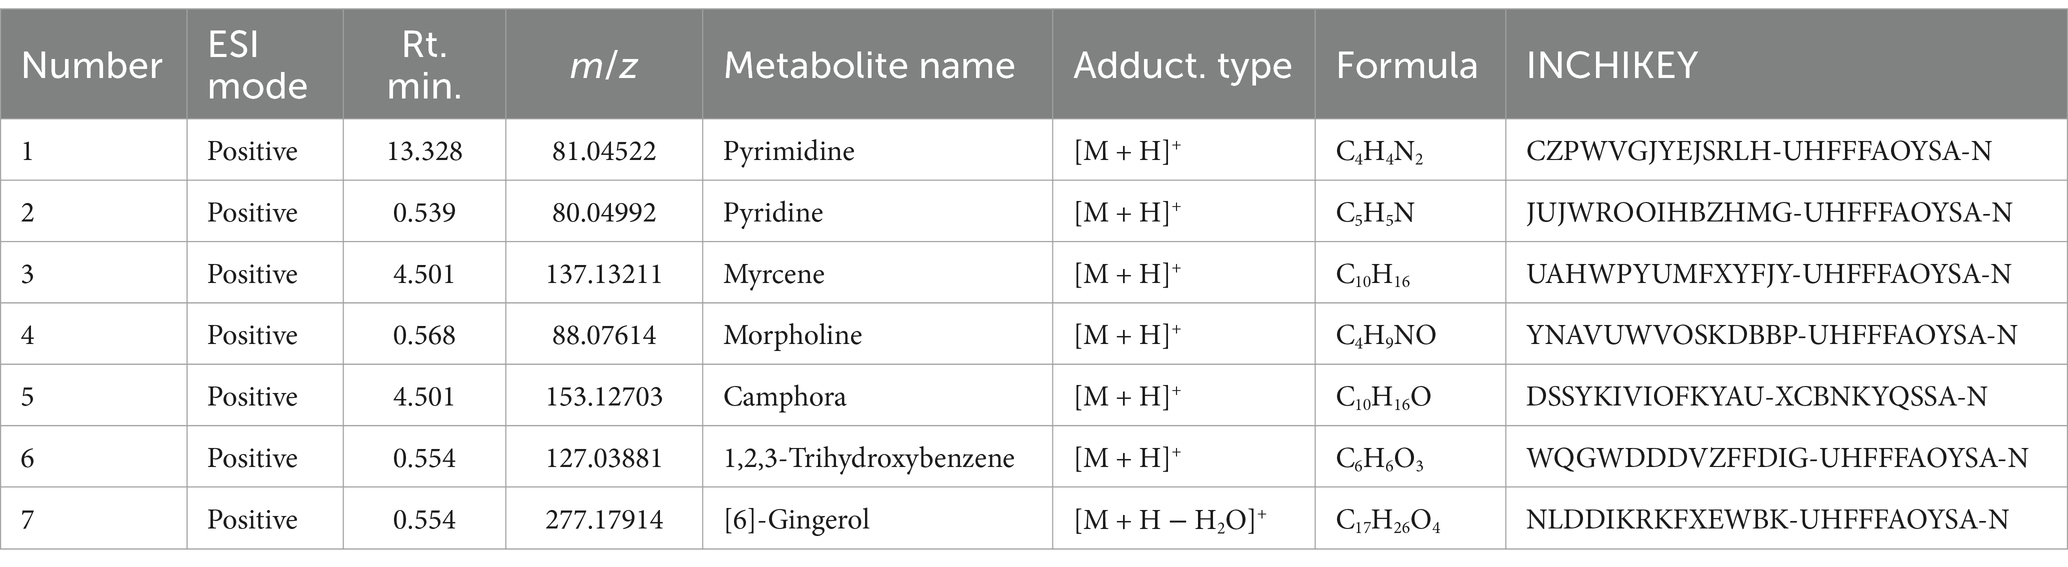
Table 5. Metabolites of traditional Chinese medicine components (positive).
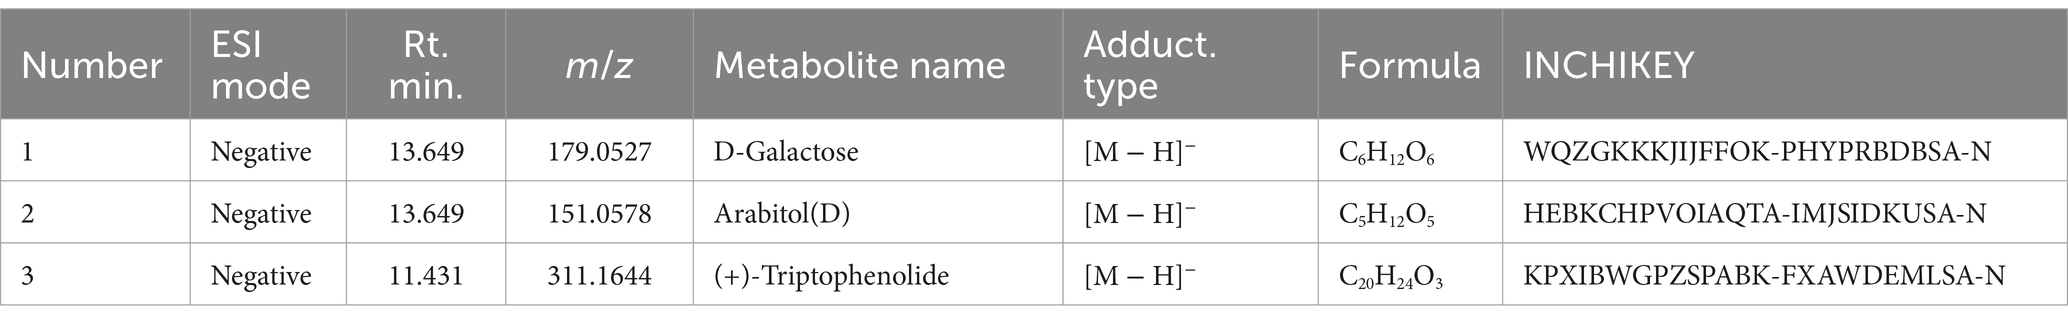
Table 6. Metabolites of traditional Chinese medicine components (negative).
This detailed UPHLC-MS-TOF analysis successfully identified the prototype components and metabolites of NBTL in the bloodstream, providing crucial data to support further research into the pharmacological mechanisms of NBTL.
3.2 Assessment of NBTL efficacy in a rat arthritis modelThe animals underwent a one-week acclimation period to adjust to the experimental environment. Following this, two immunizations were performed on day 0 and day 7 to establish an arthritis model. The experimental animals were randomly divided into six groups: control, model, low-dose new bitongling (NBTL-L), medium-dose new bitongling (NBTL-M), high-dose new bitongling (NBTL-H), and Tripterygium wilfordii tablets (TWT). Treatment for each group began on day 14 and continued until day 42 (Figure 2A).
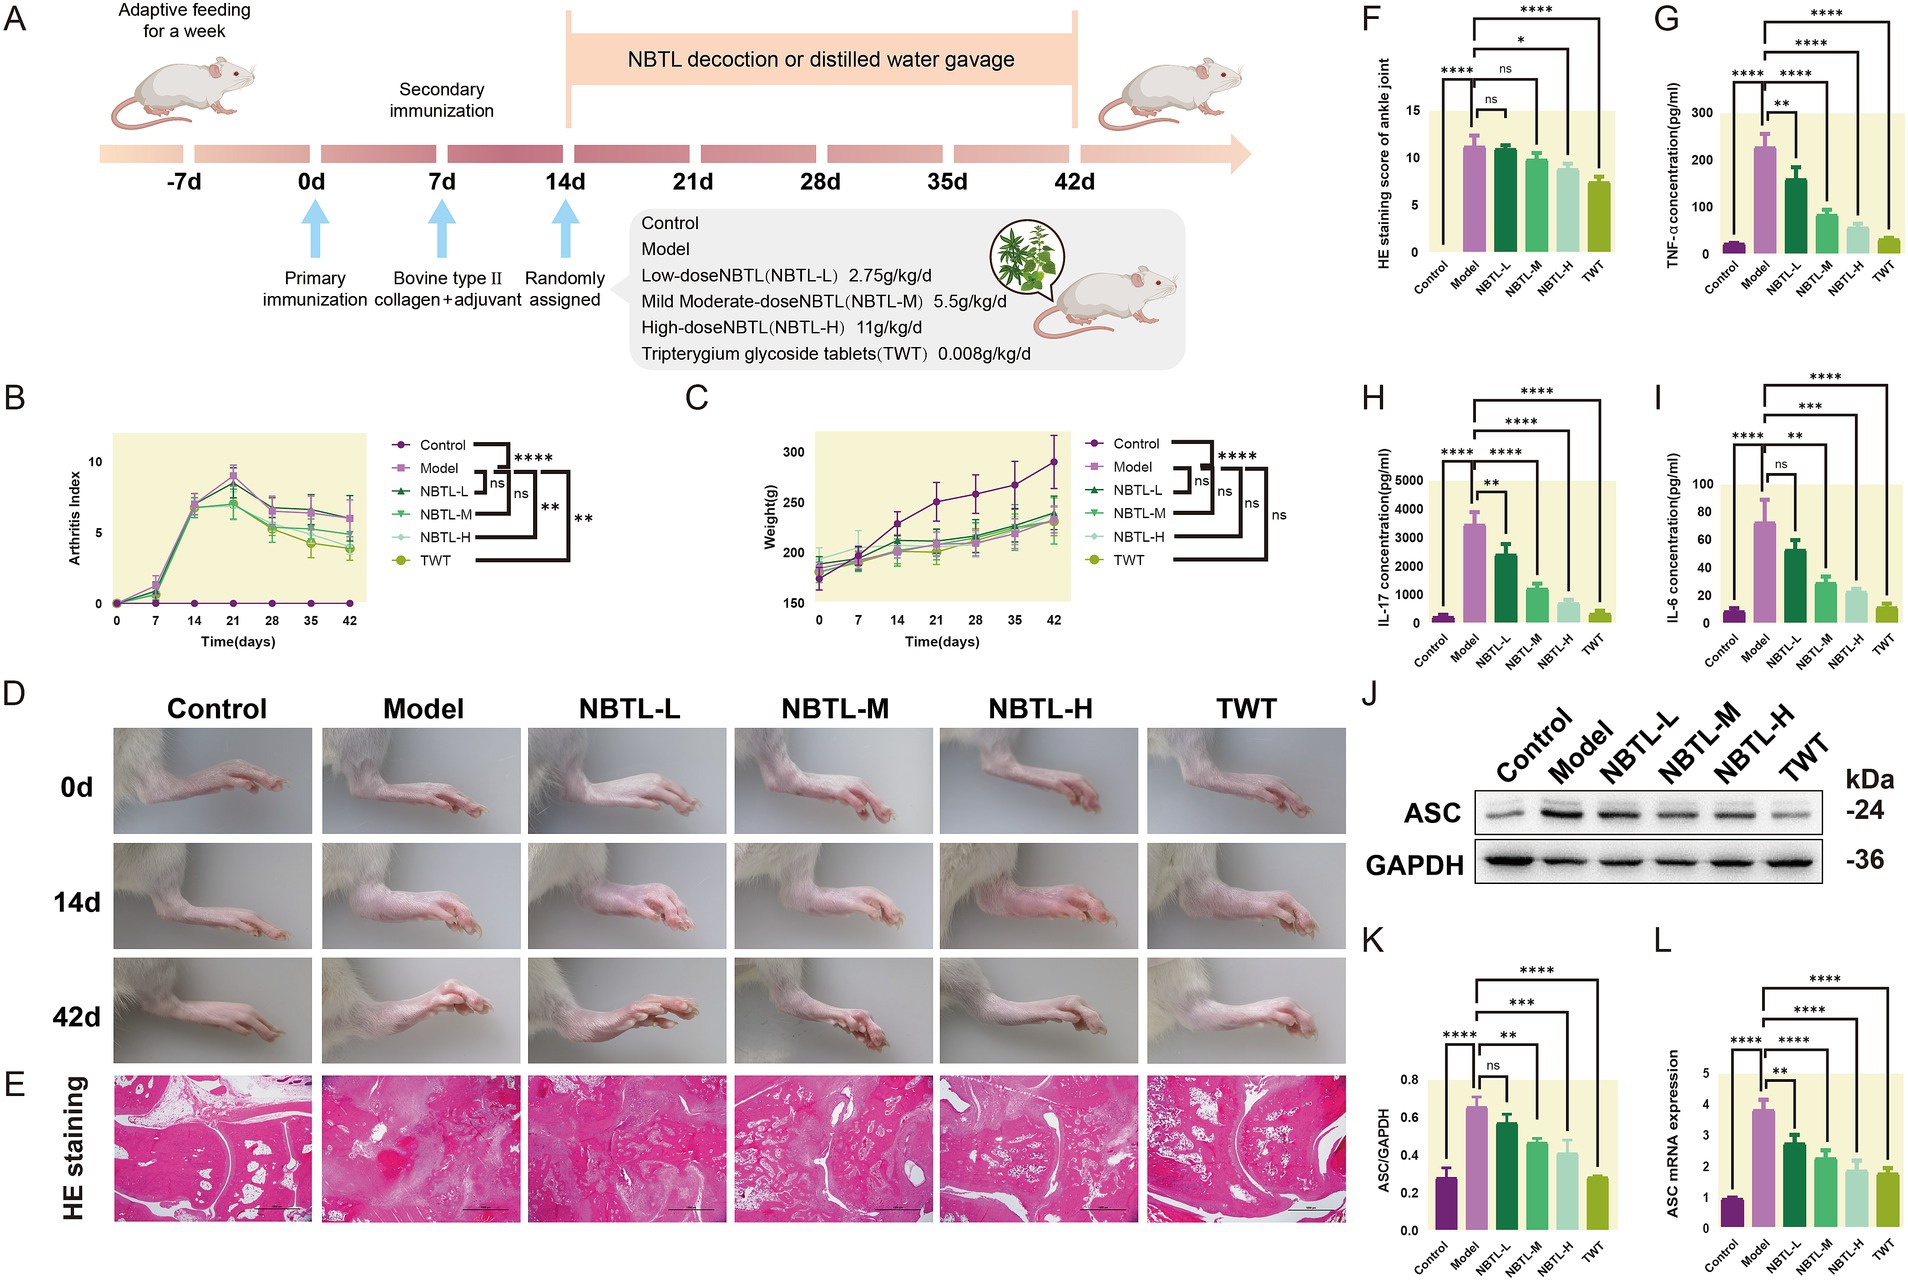
Figure 2. Evaluation of the therapeutic effects of NBTL on a rat model of arthritis. (A) Experimental design and timeline: −7 days to 0 day, acclimatization; 0 day, first immunization with type II collagen and adjuvant; 7 days, second immunization to enhance arthritis model; 14 days to 42 days, treatment groups: control (no treatment), model (arthritis development), new bitongling (NBTL) low (NBTL-L), medium (NBTL-M), and high (NBTL-H) doses, and Tripterygium wilfordii tablets (TWT) as a drug control. (B) Arthritis index scoring over time. (C) Weight changes, showing no significant differences (ns). (D) Visual comparison of rat leg inflammation on days 0, 14, and 42 across all groups. (E) Histological analysis with HE staining at 20× magnification showing joint tissue structure and inflammation. (F) HE staining scores indicating tissue damage severity. (G,H) Serum levels of TNF-α and IL-17, showing inflammation response across treatments. (I) IL-6 serum levels with significant reductions in treated groups compared to the model. (J,K) Western blot analysis of ASC protein expression in synovial tissue with GAPDH as a loading control. (L) ASC mRNA levels quantified by qPCR, comparing each group to the model, with statistical significance noted. Significance markers used are (*p < 0.05, **p < 0.01, ***p < 0.001, and ****p < 0.0001, ns: not significant). (B–F) Sample size per group: n = 8. (G–L) Sample size per group: n = 3.
Compared to the model group, all new bitongling groups and the TWT group showed reductions in arthritis index, especially the NBTL-H group (p < 0.01) (Figure 2B). Body weight changes during the experiment did not differ significantly across the groups (Figure 2C). Photographs taken at various time points revealed typical arthritis symptoms in the model group, which were noticeably reduced in the new bitongling and TWT groups (Figure 2D).
Histopathological examination of the ankle joints in the model group revealed significant structural damage along with marked infiltration of inflammatory cells. In contrast, both the NBTL-H and TWT groups showed a notable reduction in these pathological changes (p < 0.05 and p < 0.0001) compared to the model group (Figures 2E,F).
Following new bitongling treatment, TNF-α and IL-17 levels were notably decreased in the NBTL-L, NBTL-M, and NBTL-H groups (p < 0.01 and p < 0.0001), with comparable reductions seen in the TWT group (Figures 2G,H). Regarding IL-6, significant reductions were noted in the NBTL-M and NBTL-H groups (p < 0.01 and p < 0.001), but not in the NBTL-L group (Figure 2I).
Western blot analysis showed significantly increased ASC protein expression in the synovial tissues of the model group. After new bitongling treatment, ASC expression showed a dose-dependent decline, with the greatest reduction observed in the NBTL-H group (p < 0.001). The TWT group also showed a similar decreasing trend (Figures 2J,K). Quantitative polymerase chain reaction (qPCR) results further confirmed that ASC mRNA levels in the synovial tissues were significantly reduced in the NBTL-H, and TWT groups (p < 0.0001) (Figure 2L).
3.3 Gut microbiota structure and diversity analysis under NBTL-H treatmentIn this study, we employed PLS-DA to deeply analyze the gut microbiota structure across various taxonomic levels: order (Figure 3A), family (Figure 3B), genus (Figure 3C), species (Figure 3D), and operational taxonomic units (OTU) (Figure 3E). Experimental data points are marked in purple, red, and green to represent the control group (control), model group (model), and high-dose new bitongling treatment group (NBTL-H), respectively. Each subplot reveals the main directions of data variation through the first and second principal components, with the corresponding variance percentages labeled on the axes. The principal component analysis results clearly demonstrate the distribution characteristics of the three groups within the principal component space, with the NBTL-H treatment group showing significant separation at multiple taxonomic levels.
留言 (0)