Ethics approval and consent to participate
The study was conducted following the ethical guidelines issued by the Japanese Ministry of Health, Labor and Welfare, the 1964 Declaration of Helsinki, and its amendments. The protocol was approved by the Research Ethics Committee of the Graduate School of Information Sciences, Tohoku University, Japan (approved number 23 A-02). Written informed consent was obtained from all subjects.
Subjects
Participants were adults who underwent overnight PSG at Takaoka Clinic, Nagoya, Japan, between August 25, 2023, and November 13, 2023. Inclusion criteria were age 20 years or older, with exclusions for acute illness or recent hospitalization, pregnancy, or breastfeeding.
Protocol
Subjects stayed overnight in a PSG testing chamber equipped with an Embla N7000 PSG amplifier. They wore an Apple Watch SE (40 mm, version 9.5.2, 20T571, model A2722, Apple Inc, Cupertino, California, USA)) on their left wrist to continuously record 3-axis acceleration and gyroscope signals from its inertial measurement unit (IMU). Data were transferred to a secure cloud environment via a smartphone (iPhone®, model MMYD3J/A, iOS version 16.6.1, Apple Inc) connected to the watch.
Measurements
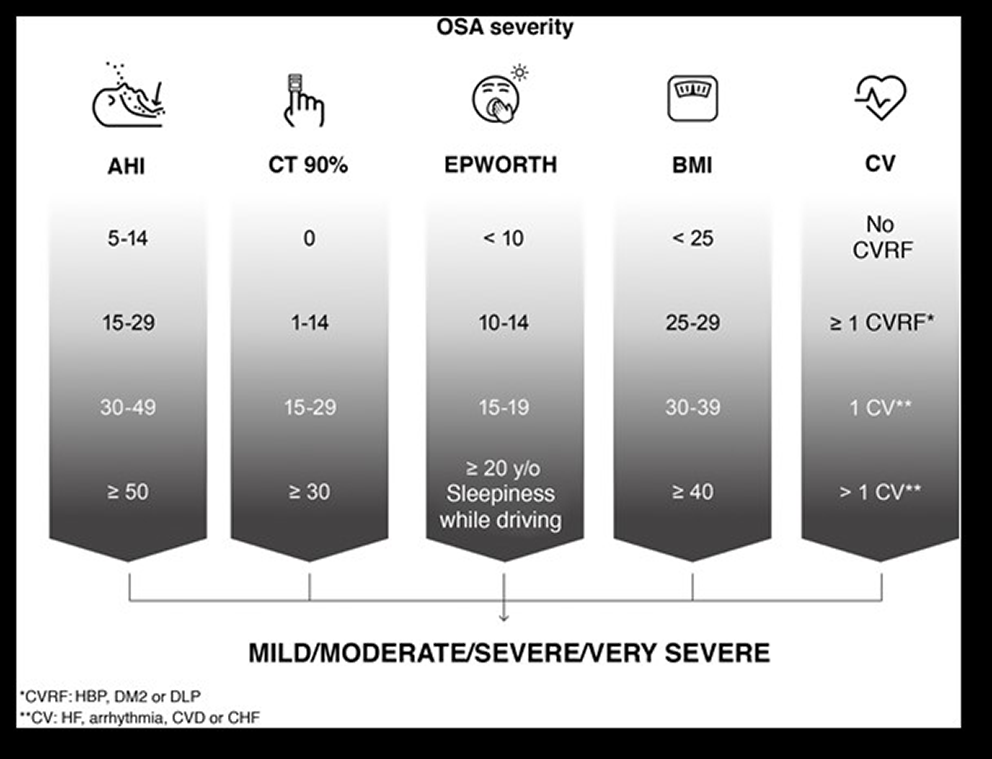
PSG recordings included standard electroencephalograms, electrooculograms, electromyograms, respiratory sensors, and a modified electrocardiogram. Sleep-disordered breathing events were scored based on the American Academy of Sleep Medicine (AASM) Manual for the Scoring of Sleep and Associated Events, version 2.5 [18]. The severity of sleep apnea was classified as follows: AHI < 5 was classified as normal, 5–15 as mild, 15–30 as moderate, and 30 or more as severe. IMU data were sampled at 60 Hz. The resolutions of acceleration and gyroscope were 0.0153 mG and 0.0000153 degrees per sec (dps), respectively. Synchronization between IMU and PSG data was achieved using timestamps.
Signal processing and feature extraction
An algorithm was developed to extract features from IMU data reflecting mechanocardiogram (MCG), respiratory wrist motion (RM), and gross body movement (BM) to detect sleep apnea/hypopnea episodes (Figs. 1 and 2).
Mechanocardiogram (MCG)
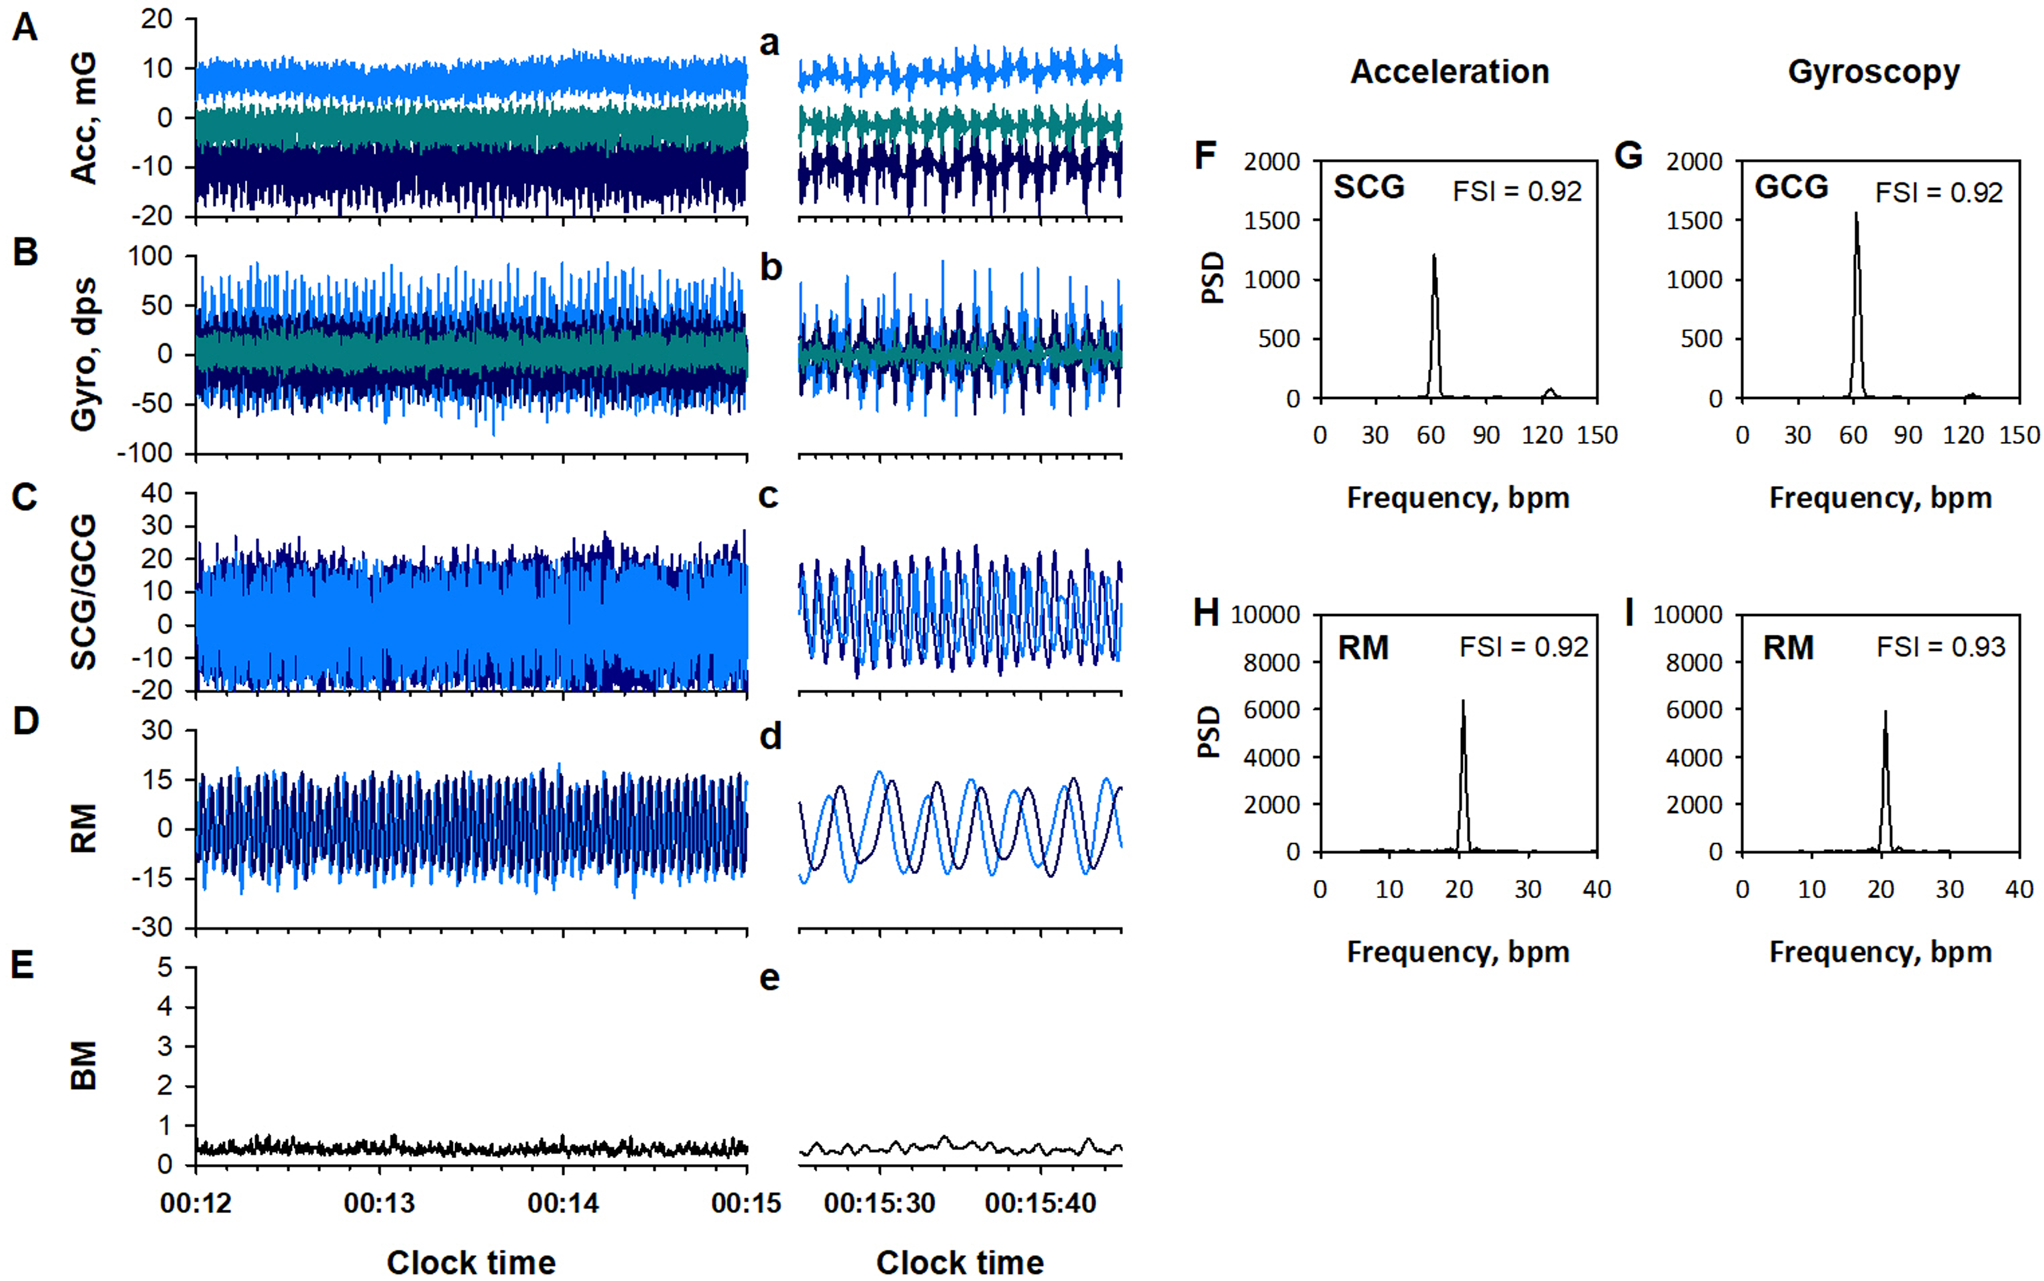
MCG is a physiological measure of body surface vibration linked to cardiac cycle, including seismocardiogram (SCG) and gyrocardiogram (GCG), which are measured with an accelerometer and a gyroscope, respectively [19, 20]. To extract the MCG components from acceleration and gyroscope data, the X-, Y-, and Z-axis signals of each data were processed separately with a finite impulse response (FIR) band-pass filter set at 4–11 Hz (panels C and c in Figs. 1 and 2). The filtered triaxial signals of acceleration and gyroscope were combined into scalar time series.
To quantify the disruption of SCG and GCG frequency structures with sleep apnea (panels Fand G in Fig. 2), a frequency stability index (FSI) was introduced (Appendix). FSIs for SCG and GCG were calculated for every 32-sec-long segment, moving in 30-sec steps and overlapping by 2 s at each end. Since our goal was to capture MCG instability due to sleep apnea episodes, we compared the FSIs of SCG and GCG signals for each epoch and adopted the larger of the two as the FSI value of MCG (MCG_FSI) for that epoch.
Respiratory wrist motion (RM)
IMU data also include RM component [16, 17]. To extract the RM component from acceleration and gyroscope data, the X-, Y-, and Z-axis signals of each data were processed with an FIR band-pass filter set at 0.13–0.70 Hz. The RM components of acceleration and gyroscope were analyzed separately.
The RM components were processed in two ways. First, the X-, Y-, Z-axis data were divided into 30-s segments. In each segment, the data with the largest interquartile (25th-75th percentiles) width among X, Y, and Z axes was selected for that epoch (panel D in Figs. 1 and 2). The disruption of RM signal frequency structure (panels H and I in Fig. 2) was quantified with FSI. The FSI was calculated for every 64-sec-long segment, moving in 30-sec steps and overlapping by 34 s at each end. The FSI of acceleration and gyroscope RM signals were compared for each 30-sec epoch, and the larger of the two was adopted as the FSI value (RM_FSI) for that epoch.
Second, the filtered triaxial RM components were combined into scalar time series (RMS) (Fig. 3). According to a previous study [17], the fast and slow envelopes of RMS were calculated as 95th-percentile values within moving windows of 3- and 20-sec width, respectively (Fig. 3B). Transient dips in RMS were detected as periods when the fast envelope dropped below the slow envelope (Fig. 3C). The characteristics of each RMS dip were quantified using six features: width (W), area between the slow and fast envelopes relative to area under the slow envelope (rABE), the height of the envelopes at the beginning and end of the RMS dip (h1 and h2), and the maximum depth in absolute value (aD) and relative value to the slow envelope (rD). The h1 and h2 were converted to h_max, the higher value between h1 and h2. The features of RMS dips were calculated for both acceleration and gyroscope RM components.
Gross body movement (BM)
BM component was extracted from the IMU acceleration and gyroscope signals (panels E and e in Figs. 1 and 2). The X-, Y-, and Z-axes data of acceleration and gyroscope were processed with band-pass filter set at 2.0–3.0 Hz. The triaxial BM components from both the acceleration and gyroscope were combined into single scalar and the maximum value in each 30-sec epoch was adopted as the BM feature of that epoch.
Machine learningMachine learning setup
We developed machine learning models to identify 30-second epochs containing respiratory events (REs), defined as apnea/hypopnea episodes identified by PSG. Each epoch was labeled as either RE-positive or RE-negative. A feature dataset was created, consisting of 15 features including MCG_FSI, RM_FSI, six features of RMS dips in acceleration and gyroscope signals, and maximum BM values during the epoch.
RMS dips were considered if the dip ended within the epoch; in cases with multiple dips, the one with the greatest ABE was used. If no dips were identified, specific features were set to zero. We aligned PSG-derived apnea/hypopnea episodes with RMS dip features within the same 30-second epoch to account for any time discrepancies.
Data partitioning
Subjects were divided into training (67%) and test (33%) groups, ensuring balanced sleep apnea severity between groups. All data were pooled into respective training and test datasets containing feature values and ground-truth labels. There was no missing data in either dataset.
Variable selection and model training
Machine learning was conducted on a PC with Core i9 processors using R (version 4.4.0) and RStudio. Variable selection was performed using Recursive Feature Elimination (RFE) in the caret library package [21] with a Naïve Bayes classifier and bootstrap resampling to ensure result generalizability. Five classifiers were trained: Logistic Regression, Random Forest, Gradient Boosting Machine, k-Nearest Neighbor, and Multilayer Perceptron, using the caret package. To address class imbalance, Synthetic Minority Oversampling (SMOTE) was applied, and hyperparameters were automatically tuned.
Model training evaluation and final model selection
Model performance was assessed on the training dataset based on per-epoch classification and per-subject apnea-severity estimation. For per-epoch classification performance, metrics included area under the receiver operating characteristic curve (AUC), accuracy, sensitivity, specificity, positive predictive accuracy (PPA), negative predictive accuracy (NPA), and F1 score. For per-subject apnea-severity estimation performance, the correlation between the hourly frequency of RE-positive epochs, respiratory event index (REI), and PSG-derived AHI were evaluated. The final model was chosen based on its overall performance across these metrics.
Validation in the test group
The final model’s performance was validated using the test group, with evaluation parameters identical to those in the training phase. Feature importance in the final model was determined using the varImp function from the caret library.
Statistical analysis
Differences in quantitative and categorical variables between two groups were assessed using the Wilcoxon rank sum test and χ2 test, respectively. The correlation between two variables were examined through linear regression analysis and Pearson’s correlation coefficient. Statistical significance was defined as P < 0.05.


留言 (0)