
記住我
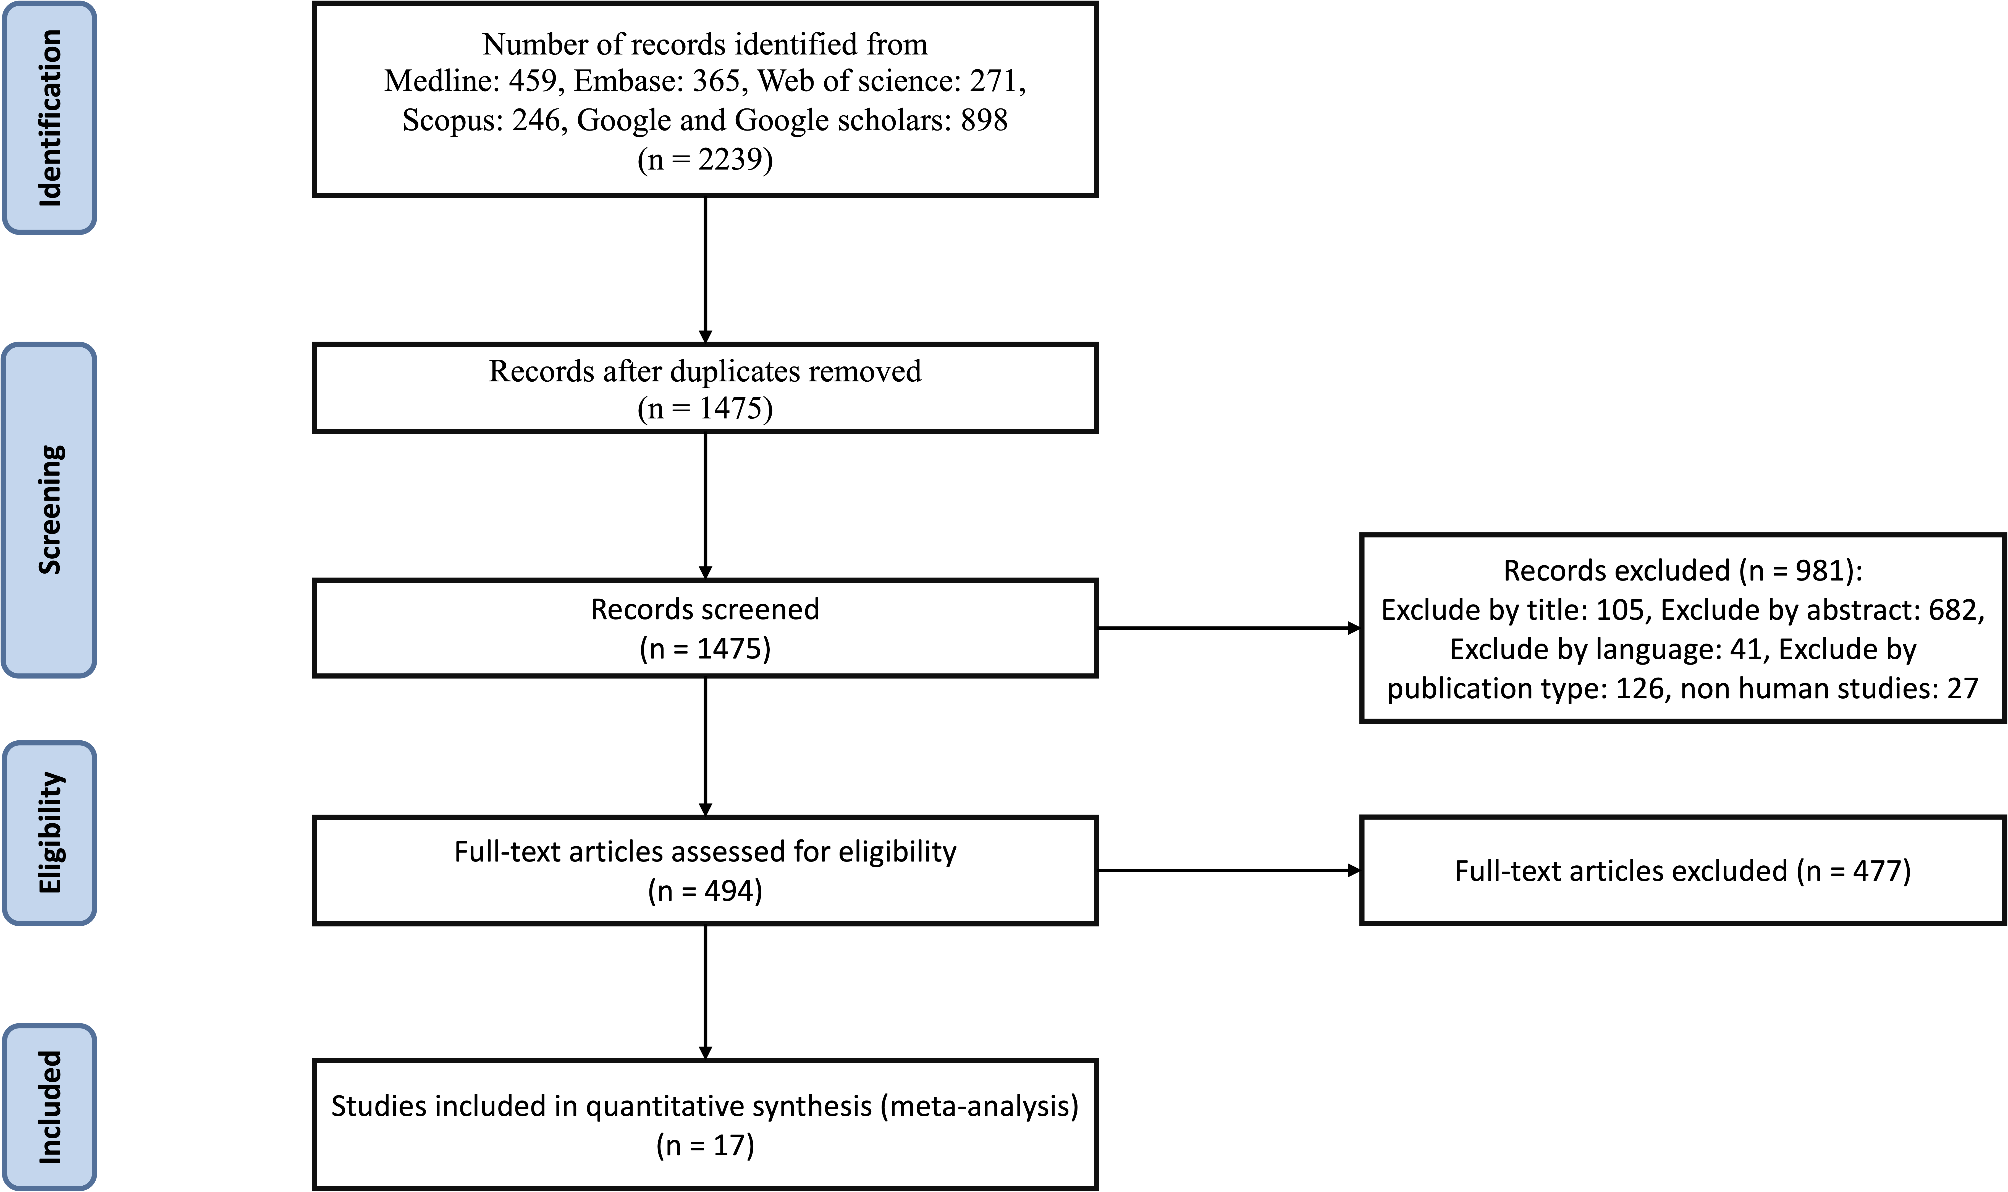
Out of the 642 patients who were screened for eligibility, 151 met the inclusion criteria and were enrolled in this study. The majority of the study cohort were male (67.6%), aged 51.8 ± 12.4 years, 29% were active smokers, 13.9% were former smokers, 81.5% were obese, 25.3% had a family history of coronary heart disease, 49% had hypertension, 55% had diabetes, 13.2% had familial hypercholesteremia (FH), had a mean of 3.04 ± 1.25 ASCVD risk factors, 67% had established ASCVD, and 49% had a prior revascularization intervention, (Table 1) illustrate further details on the baseline characteristics. Additional comorbidities noted in the cohort included heart failure with reduced ejection fractions (HFrEF) (15.2%), anemia (15.2%), asthma (7.3), chronic kidney disease (CKD) (8.6%), and hypothyroidism (12.6%).
Table 1 Baseline CharacteristicsCommon concomitant cardiac medications include aspirin (70.2%), angiotensin-converting enzyme inhibitors and angiotensin receptor blockers (62.3%), beta-blockers (56.3%), clopidogrel (31.1%), calcium channel blockers (22.5%), and isosorbide dinitrate (15.9%). The most commonly prescribed non-insulin diabetes medication at baseline was metformin (88%). Other frequently prescribed diabetes medications included gliclazide MR (39.8%), dapagliflozin (43.4%), sitagliptin (50.6%), semaglutide (21.7%), liraglutide (3.6%), dulaglutide (1.2%), pioglitazone (3.6%), and insulin (60.2%). It's important to note that some patients without diabetes were prescribed these medications at the beginning of the study for non-diabetes reasons. For example, 14.7% of patients were prescribed metformin for prediabetes, 5.9% were prescribed semaglutide for obesity to help with weight reduction alongside lifestyle and dietary interventions, and 10.3% were prescribed dapagliflozin for cardiac (i.e., HFrEF) or renal (i.e., CKD) conditions. Further details are presented in (Supplementary Table S1).
Lipid-lowering therapy at baselineThe majority of the study cohort (57%) was prescribed high-intensity rosuvastatin dosing at baseline, while only 3.3% were on high-intensity atorvastatin dosing. 17.9% were on moderate-intensity rosuvastatin dosing, 14.6% were on moderate-intensity atorvastatin, and 7.3% were on either low-intensity atorvastatin or rosuvastatin. There were statistical differences in statin prescriptions at baseline between diabetic patients and nondiabetic patients (P = 0.321) (Supplementary Table S1). The mean duration of statin use before evolocumab initiation was 49.15 months for the entire cohort, 46.88 months for non-diabetic patients, and 50.58 months for diabetic patients. The average duration of ezetimibe use prior to evolocumab was 24.23 months, 26.37 months, and 22.47 months for the entire cohort, non-diabetic patients, and diabetic patients, respectively. The mean duration of evolocumab exposure throughout the follow-up was 23.17 months, with a mean of two follow-up visits after the baseline visit where evolocumab was initiated. The mean follow-up period length was 13.17 months for the entire cohort, 14.13 months for non-diabetics, and 12.39 months for diabetics.
LDL-C levels measurements at baselineIn the overall cohort, 88.1% of patients had LDL-C above 2.6 mmol/L (100 mg/dL), 98.7% had LDL-C above 1.8 mmol/L (70 mg/dL), and all patients had LDL-C above 1.4 mmol/L (55 mg/dL). The average LDL-C level at baseline for the overall study cohort was 4.56 ± 2.46 mmol/L (176.34 ± 95.13 mg/dL), 5.13 ± 3.26 mmol/L (198.38 ± 126.1 mg/dL) for patients with no diabetes, and 4.09 ± 1.37 mmol/L (158.16 ± 52.98 mg/dL) for patients with diabetes.
Efficacy outcomesAfter an average follow-up of 13.17 months, the mean LDL-C levels decreased to 3.00 ± 2.54 mmol/L (116.01 ± 98.22 mg/dL), 3.66 ± 3.34 mmol/L (141.53 ± 129.16 mg/dL), and 2.47 ± 1.45 mmol/L (95.52 ± 56.1 mg/dL) for the entire cohort, non-diabetic patients, and diabetic patients, respectively. The percent reduction in LDL-C from baseline was − 34.21, − 28.66, and − 39.61% for the overall cohort, non-diabetic patients, and diabetic patients, respectively.
A substantial reduction in LDL-C levels of more than 50% from baseline was achieved by 52.32% of the overall cohort, 51.47% of non-diabetic patients, and 53% of diabetic patients. In the overall cohort, 24.5 and 34.4% reached the target LDL-C levels of less than 1.4 mmol/L (55 mg/dL) and less than 1.8 mmol/L (70 mg/dL), respectively (Fig. 1). Among non-diabetic patients, 22.1 and 30.9% attained these targets, while among diabetic patients, 26.5 and 37.3% achieved the respective LDL-C targets (Table 2).
Fig. 1
% LDL-C Target Achievement by the End of Follow-up. G: Goal; DM: diabetes mellitus; NDM: none diabetes mellitus
Table 2 Changes from baseline in lipid measures following evolocumabPotential determinants of LDL-C target levels attainmentIn the overall study cohort, hypertensive patients had approximately significantly higher odds of attaining the target LDL-C levels of < 2.6 mmol/L (< 100 mg/dL) (OR 2.8, P-value = 0.002) and < 1 mmol/L (< 40 mg/dL) (OR 2.6, P-value = 0.027) compared to those without hypertension. Similarly, Patients with a history of NSTEMI had significantly higher odds of achieving the target LDL-C levels of < 2.6 mmol/L (< 100 mg/dL) (OR 2.44, P-value = 0.011), < 1.8 mmol/L (< 70 mg/dL) (OR 2.03, P-value = 0.043). Additionally, a history of prior PCI was significantly associated with higher odds of achieving target LDL-C levels of < 2.6 mmol/L (< 100 mg/dL) (OR 3.14, P-value = 0.002), < 1.8 mmol/L (< 70 mg/dL) (OR 3.57, P-value = < 0.001), and < 1 mmol/L (< 40 mg/dL) (OR 2.43, P-value = 0.021) (Table 3).
Table 3 Association (OR) between demographic and clinical factors with achievement of target LDL-C level at follow-upPatients with a baseline LDL-C level > 4.9 mmol/L (> 190 mg/dL) were less likely to achieve LDL-C targets of < 2.6 mmol/L (< 100 mg/dL) (OR 0.223, P-value = < 0.001), < 1.8 mmol/L (< 70 mg/dL) (OR 0.201, P-value = < 0.001), or < 1.4 mmol/L (< 55 mg/dL) (OR 0.372, P-value = < 0.038). Conversely, patients with a baseline LDL-C level < 2.6 mmol/L (< 100 mg/dL) had nearly three times the odds of achieving LDL-C targets of < 1.8 mmol/L (< 70 mg/dL) (OR 2.708, P-value = 0.045) and < 1.4 mmol/L (< 55 mg/dL) (OR 2.869, P-value = 0.045) compared to those with a baseline LDL-C level ≥ 2.6 mmol/L (≥ 100 mg/dL) (OR 1.644, P-value = 0.344).
For patients with diabetes, the use of rosuvastatin was associated with higher odds of attaining LDL-C targets of < 1.8 mmol/L (< 70 mg/dL) (OR 5.374, P-value = 0.007) and < 1.4 mmol/L (< 55 mg/dL) (OR 11.03, P-value = 0.006) compared to those taking atorvastatin. Patients with a baseline LDL-C level < 2.6 mmol/L (< 100 mg/dL) had approximately six times (OR 5.681, P-value = 0.016) the odds of achieving the LDL-C target of < 1.8 mmol/L (< 70 mg/dL) compared to those with a baseline LDL-C level ≥ 2.6 mmol/L (≥ 100 mg/dL) (Table 4).
Table 4 Association (OR) between demographic and clinical factors with achievement of target LDL-C level at follow-up ContinueWorsening of glycemic controlThe mean baseline HbA1C of 7.41 ± 2.09, 5.68 ± 0.46, and 8.83 ± 1.81, for the overall cohort, patients with no diabetes, and patients with diabetes, respectively and remained almost unchanged with a mean HbA1C at follow-up of 7.40 ± 2.15, 5.72 ± 0.48, and 8.77 ± 2.01, for the overall cohort, patients with no diabetes, and patients with diabetes, respectively. Worsening of glycemic control, defined as an increase in HbA1C by > 0.5 observed at least once throughout follow-up, was observed in 25.83, 16.18, and 33.74% of patients among the overall cohort, patients with no diabetes, and with diabetes, respectively. A worsening of glycemic control, defined as an increase in HbA1C by > 1, was observed at least once throughout follow-up in 13.25, 2.94, and 21.69% of patients among the overall cohort, patients with no diabetes and with diabetes, respectively. By the end of follow-up, the average number of diabetes medications was non-significantly different from baseline (1.3 vs. 1.5). While the number of insulin users slightly increased from 60.24 to 67.47% of patients. Among patients without diabetes diagnosis at baseline, NOD was observed in five patients (3.3%) following evolocumab initiation (Table 5).
Table 5 Worsening of Glycemic Control indicatorsRate of hepatic enzyme elevationAt a mean onset time of nearly one year following the initiation of evolocumab, ALT elevations of X2 UNL were observed in 3.3, 1.5, and 4.8% of patients in the overall study cohort, patients with no diabetes, and patients with diabetes, respectively. AST elevations of X2 UNL were observed in 2, 2.9, and 1.2% of patients in the overall study cohort, patients with no diabetes, and patients with diabetes, respectively.
Furthermore, ALT elevations of X3 UNL were observed in 1.3, 1.5, and 1.2% of patients in the overall study cohort, patients with no diabetes and patients with diabetes, respectively. AST elevations of X3 UNL were observed in 2, 1.5, and 2.4% of patients in the overall study cohort, patients with no diabetes, and patients with diabetes, respectively. (Supplementary Table S2).
留言 (0)