
記住我
The NHANES, conducted by the National Center for Health Statistics (NCHS) under the Centers for Disease Control and Prevention (CDC) in the United States, was the basis for our study. Our study enrolled patients with DKD spanning from 1999 to 2018. Dietary data were sourced from the Food Patterns Equivalents Database (FPED). NHANES mortality data were obtained from the National Death Index (NDI), with causes of death coded using International Classification of Diseases (ICD) codes.
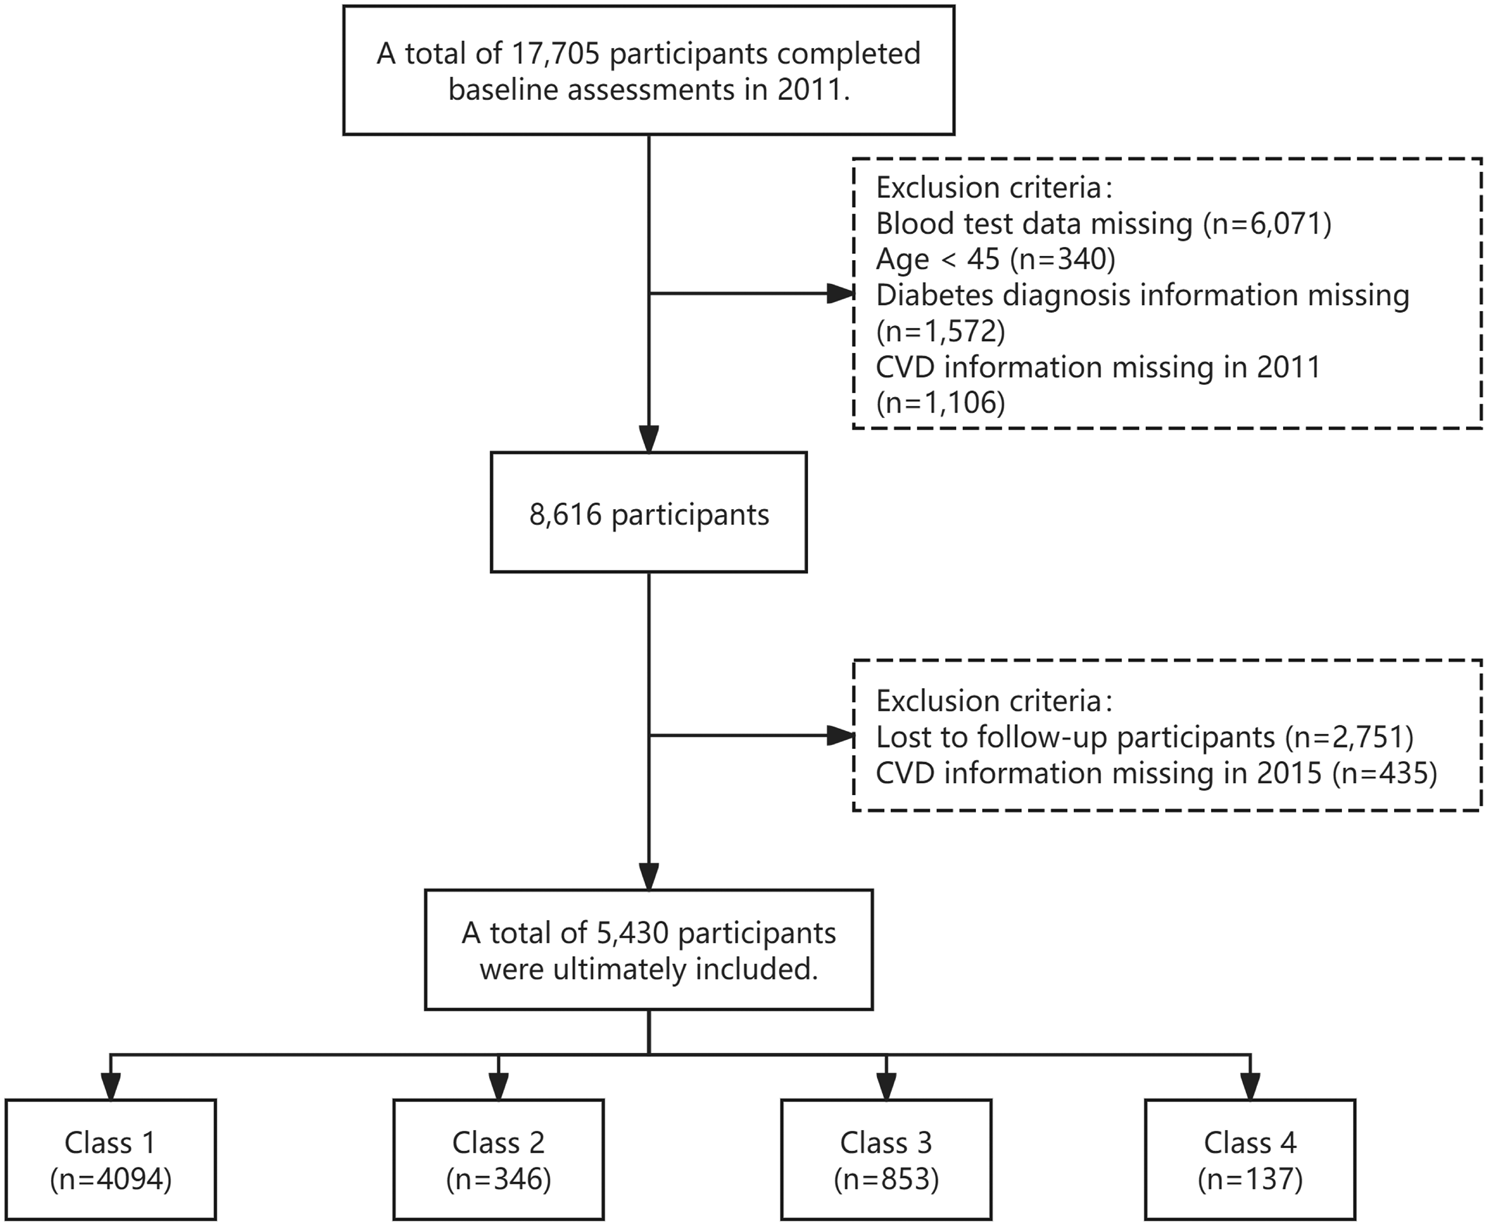
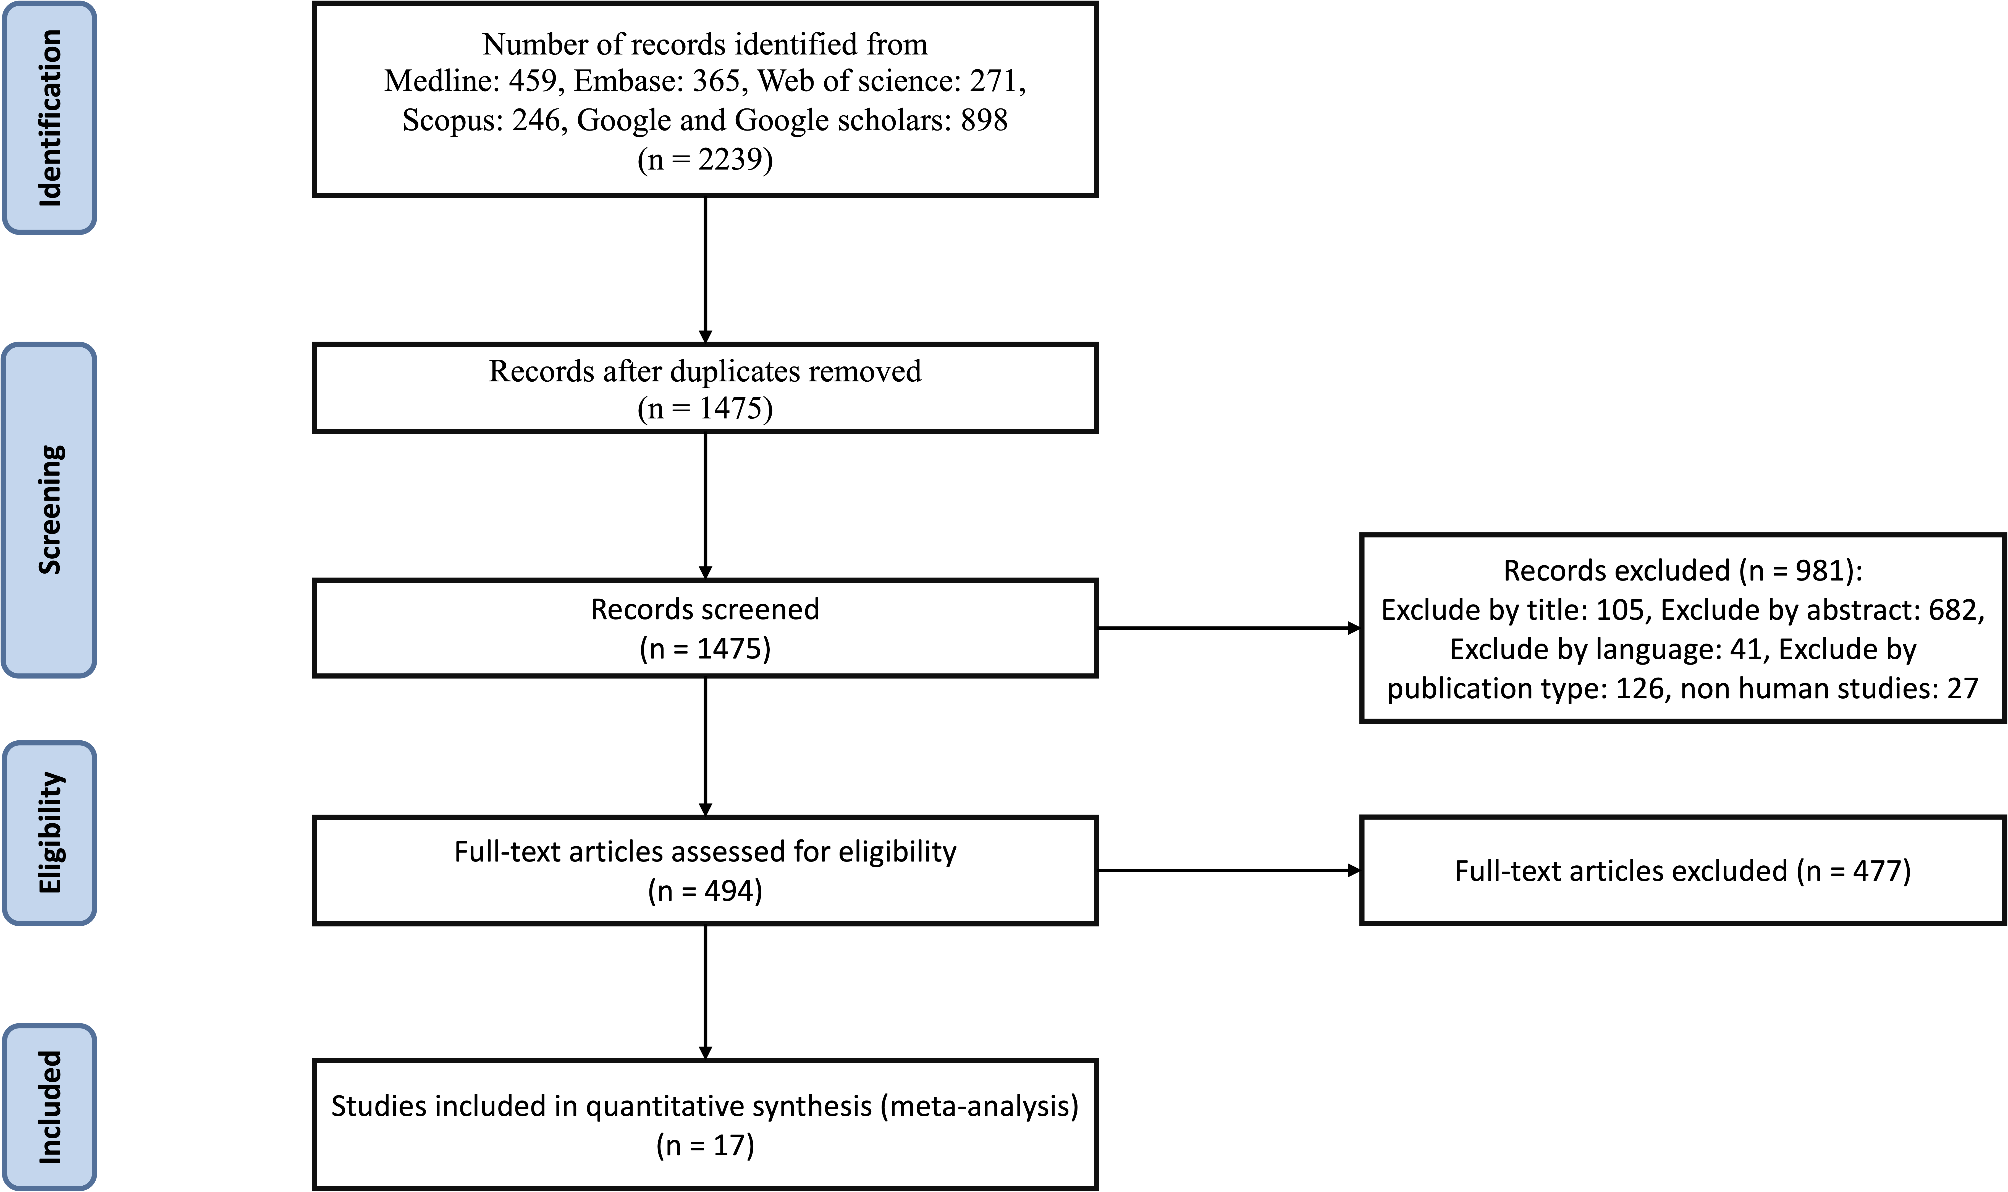
Part 1: We included participants with DKD from 10 cycles of NHANES (1999–2018). After excluding those with pregnant, 3665 participants with DKD remained. Following further exclusions due to age under 20 (n = 28), lack of MDS (n = 280), lack of eGFR score (n = 153), lack of diuretic score (n = 5), a total of 3199 participants were finally included in the study. And we exclude missing CVD diagnosis (n = 2), missing coronary heart disease (CHD) diagnosis (n = 49), missing congestive heart failure (CHF) diagnosis (n = 19), missing heart attack diagnosis (n = 8), missing stroke diagnosis (n = 6), and missing angina diagnosis (n = 24), 3,091 participants were finally included in the Part 1 (Fig. 1). We explored the cross-sectional association between MDS and CVD in participants with DKD.
Fig 1.
Flowchart of the DKD participants from the National Health and Nutrition Examination Survey 1999 to 2018
Part 2: Subsequently, we excluded 4 individuals with missing survival data among 3199 participants. As of 31 December 2019, 497 cardiovascular deaths and 1,373 all-cause deaths were recorded in 3195 patients with DKD (Fig. 1). The association of MDS and mortality was explored in our study.
Definition of outcomesPart I: Five self-reported subtypes were used to determine the CVD, including CHF, CHD, angina, heart attack, or stroke [14, 15]. Each respondent aged 20 was asked by a trained interviewer using a standard questionnaire: “Has a doctor or other health professional ever told you that you had CHF/CHD/angina/heart attack/stroke?" Any of the above questions answered yes were diagnosed with CVD.
Part II: The primary outcome is all-cause death and cardiovascular death. CVD mortality was determined by the International Classification of Diseases 10th Edition (ICD-10), including codes I00 to I09, I11, I13, I20 to I51, and I60 to I69. Follow-up time was calculated from the date of the NHANES interview to the date of death or 31 December 2019.
MDS definitionMDS, a clinical indicator for assessing magnesium deficiency in vivo, was calculated by summing the following four scores: 1. Use of diuretics: 1 point for "yes", 0 points for "no". 2. Use of proton pump inhibitors (PPIs): 1 point for "yes", 0 points for "no". 3. Renal function: Estimated glomerular filtration rate (eGFR) of 90 points: 0 points. 1 point for eGFR between 60 and 90 ml/min/1.73 m2. 2 points for eGFR less than 60 ml/min/1.73 m216. 4. Heavy drinking: 1 point for consumption greater than 1 cup/day for women and greater than 2 cups/day for men [17]. All other drinking habits (none, mild, moderate) scored zero. In this study, MDS was categorized into four groups: MDS = 0, MDS = 1, MDS = 2, and MDS ≥ 3.
DKD definitionDiabetes Diagnosis: Participants were classified as having diabetes if they met one or more of the following criteria: 1. Self-reported physician diagnosis of diabetes. 2.Use of antidiabetic medications. 3.HbA1c level ≥ 6.5%. Nephropathy Indicators: Evidence of nephropathy was determined by the presence of albuminuria: Albuminuria, defined as a urine albumin-to-creatinine ratio (UACR) ≥ 30 mg/g. Reduced kidney function, defined as an estimated glomerular filtration rate (eGFR) < 60 mL/min/1.73 m2, calculated using the CKD-EPI equation. Patients meeting both the diabetes and nephropathy criteria were classified as having DKD.
CovariatesThe covariates encompassed demographic characteristics (age, gender, marital status, race or ethnicity, education, household poverty income ratio, and body mass index), lifestyle behaviors (smoking and drinking status), dietary factors (fiber intake, fat intake, magnesium intake, calcium intake, energy intake, and the Healthy Diet Index-2015 (HEI-2015)), comorbidities (hypertension and hyperlipidemia), and laboratory data (glycated hemoglobin A1c [HbA1c], serum creatinine, and urine albumin-to-creatinine ratio (uACR)). Dietary data were collected through a 24-h dietary recall survey. Hypertension was identified through self-report, use of antihypertensive medications, or systolic/diastolic blood pressure of ≥ 140/90 mmHg. Hyperlipidemia was diagnosed by self-report, triglyceride levels of ≥ 150 mg/dL, total cholesterol levels of ≥ 200 mg/dL, high-density lipoprotein cholesterol levels of > 40 mg/dL in men or > 50 mg/dL in women, or low-density lipoprotein cholesterol levels of ≥ 130 mg/dL. BMI was classified into three categories: BMI < 25 kg/m2, 25–30 kg/m2, and > 30 kg/m2.
Statistical analysisTo ensure national representativeness, this study accounted for the complex sampling design of the NHANES, incorporating sample weighting, clustering, and stratification in all analyses. Baseline characteristics of individuals with DKD were described using weighted means (standard deviation, SD) or medians (interquartile range, IQR) with corresponding confidence intervals (CIs) for continuous variables, and weighted percentages for categorical variables. Group comparisons were conducted with t-tests or Mann–Whitney U tests for continuous variables, and Chi-squared tests or Fisher's exact tests for categorical variables.
To address the issue of missing data, a specialized multilevel approach for survey data was used with the R package "mice" [18]. The “mice” package employs "cart" methods and sets the seed to 1234 to predict the missing values. Each imputed dataset is generated using different random variations or assumptions in the interpolation method. Statistical analysis was then performed using a complete case approach.
To establish the independent correlation between MDS and the risks of CVD in DKD, survey-weighted univariable and multivariable logistic regression analyses were performed. Meanwhile, we explored the possible correlation between composition of MDS (diuretic use, PPI use, alcohol use, eGFR) and incidence of CVD in DKD patients. Furthermore, to investigate the relationship between MDS and the prevalence of five CVD (heart failure, CHD, angina, heart attack, and stroke), a survey-weighted multiple logistic regression analysis was conducted.
Stratified analyses were conducted to examine whether the association between MDS and CVD persisted across different subgroups defined by age, sex, smoking status, body mass index, magnesium intake, and complications.
Weighted Kaplan–Meier curves and log-rank tests were used to assess cumulative survival in different MDS levels. Survey-weighted cox proportional hazards regression analysis examined the relationship between MDS and both all-cause and CVD mortality in multivariable models. Stratified analysis investigated whether the association between MDS and mortality persisted across age, sex, smoking status, body mass index, magnesium intake, and complications. The area under the receiver operating characteristic (ROC) [19] curve (AUC) was used to evaluate the performance of MDS in predicting longitudinal mortality in patients with DKD.
In order to evaluate the robustness of our results, sensitivity analyses were performed. Initially, to account for the relationships between blood lipids, eGFR, and mortality, we adjusted for triglycerides and serum creatinine in the fully adjusted model. Additionally, to reduce potential dietary bias, we used 2-day mean values for calculating dietary data. For the final data analysis, we used interpolated data instead of missing data. Statistical analyses were performed using R version 4.3.1 (R Foundation for Statistical Computing, Vienna, Austria), with statistical significance defined as a P-value of less than 0.05 in all two-tailed tests.
留言 (0)