2.1 Patients and tissue specimens
GC tissues and paired adjacent normal tissues were collected from patients diagnosed with GC who underwent surgical resection at the First Affiliated Hospital of Sun Yat-sen University. All tissue specimens were confirmed by pathologic examination and were separated and frozen at -80 °C or formalin-fixed. Written informed consents were obtained from all the patients, and the study was approved by the Ethics Committee of the First Affiliated Hospital of Sun Yat-sen University.
2.2 Cell lines, cell culture, and reagents
Human GC cell lines (AGS, MKN1, MKN28, HGC-27 and MGC803) and normal human gastric epithelial cells-1 (GES-1) were purchased from the Chinese Academy of Sciences, Shanghai Branch Cell Bank. All human cell lines have been authenticated using STR profiling within the last three years, and all experiments were performed with mycoplasma-free cells. AGS cells were cultured in DMEM/F12 (Gibco, Waltham, MA, USA), and MKN1, MKN28, HGC-27, MGC803, and GES-1 cells were cultured in RPMI-1640 (Gibco).
BA (B8936, Sigma Aldrich, St. Louis, MO, USA) was dissolved in DMSO (Sigma Aldrich) as a 20 mM stock solution and stored at -20 °C. LY294002 (HY-10108, MCE, Shanghai, China) was dissolved in DMSO as a 5 mM stock solution and stored at -80 °C. MG-132 (HY-13259, MCE) was dissolved in DMSO as a 10 mM stock solution and stored at -80 °C.
2.3 Construction of stable cell lines and transfection
For the construction of stable overexpression and knockdown GC cell lines, we purchased lentivirus from iGene Biotechnology (Guangzhou, Guangdong, China) and infected GC cells with it. Subsequently, complete media containing 3 µg/mL puromycin (Sigma-Aldrich) were used to screen stably overexpressing and knocked down GC cell lines. Overexpression plasmids were constructed using pEZ-Lv201 (iGene Biotechnology), and knockdown plasmids were constructed using LVRU6GP (iGene Biotechnology). All plasmids and siRNAs were constructed from iGene Biotechnology (Supplementary Table 2). Plasmids and siRNAs transfection were performed using Lipofectamine 3000 (Invitrogen, Carlsbad, CA, USA) according to the manufacturer’s instructions.
2.4 Cell viability assay
For the proliferation assays, GC cells (1 × 10³/well) were seeded in 96-well plates with six replicates. Proliferation rates were determined using the Cell Counting Kit-8 (CCK-8, Boster Biological Technology, Wuhan, Hubei, China), and measure was performed on a microplate reader (Bio-TEK, Winooski, VT, USA). For the cell viability assay, 5 × 10³ cells per well were inoculated into 96-well plates. After attaching for about 24 h, the culture medium was replaced with complete media containing different concentrations of BA and LY294002 for 24 h. Finally, the absorbance was measured at 450 nm.
2.5 5-Ethynyl-2’-deoxyuridine (EdU) incorporation assay
5 × 10³ cells per well were inoculated into 96-well plates. The EdU incorporation assay was conducted using an EdU Staining Kit (RiboBio, Guangzhou, Guangdong, China) according to the manufacturer’s instructions. Finally, the cell nucleus was visualized using DAPI, and fluorescence signals were acquired using a fluorescence microscope (Leica, Wetzlar, Germany).
2.6 Colony-forming assays
Cells were seeded separately in 6-well plates at a density of 500/well. The medium was changed twice per week. After 14 days, cells were fixed in 4% paraformaldehyde for 30 min, stained with 0.5% crystal violet for 15 min, rinsed three times with PBS to remove excess dye, photographed, and counted.
2.7 Transwell cell migration and invasion assay
5 × 10⁴ cells resuspended in 400 µL serum-free medium were plated in the upper chamber, while the lower chamber was filled with the complete culture medium. Finally, the cells were fixed with 4% paraformaldehyde and stained with 0.5% crystal violet. Images were acquired using a microscope (Olympus, Tokyo, Japan).
2.8 Cell apoptosis analysis
Cell apoptosis was evaluated by flow cytometric analysis using annexin V-FITC/PI staining (BD Biosciences, San Jose, CA, USA). Apoptotic cells were analyzed using FACSCalibur flow cytometry (BD Biosciences), and FlowJo software (Tree Star Corp, Ashland, WI, USA) was used to analyze the results.
2.9 RNA isolation and quantitative real-time PCR (qRT-PCR)
Total RNA was extracted from tissues and cells using TRIzol reagent (Takara, Beijing, China) according to the manufacturer’s protocol. cDNA was generated using the Master Mix cDNA Synthesis Kit (Accurate Biotechnology, Changsha, Hunan, China). qPCR was performed using SYBR Green I (Accurate Biotechnology). The expression levels of the target genes were measured using the 2–ΔΔCt method and normalized to GAPDH as a reference. Each experiment was performed in triplicate and qPCR primers are listed in Supplementary Table 3.
2.10 Protein extracting and western blot (WB)
Western blot was performed as described by Liu [21]. Proteins were extracted from tissues and cells using RIPA lysis buffer (Beyotime, Guangzhou, Guangdong, China) following the manufacturer’s protocol and quantified with the bicinchoninic acid protein assay kit (Beyotime). GAPDH was used as a loading control. The antibodies are listed in Supplementary Table 4.
2.11 Phospho-proteomic profiling
ZBTB10-overexpression AGS cells and control cells were washed thrice with PBS and solubilized in lysis buffer. The lysates were resuspended at 4 °C for 30 min by gently pipetting and rocking. Then, the lysates were centrifuged at 14,000 ×g for 10 min and transfer the supernatant into a clean test tube. After quantifying the protein concentration with the BCA assay kit (Beyotime), cell lysates containing 400 µg of total protein were firstly diluted and then detected in Proteome Profiler Human Phospho-Kinase Array (R&D Systems, Minneapolis, MN, USA) according to the manufacturer’s instructions.
2.12 Enzyme-linked immunosorbent assay (ELISA)
Concentrations of p-PI3K in AGS and MKN1 cell lysates with ZBTB10 overexpression and knockdown were measured by the ELISA Kits (ml060625, Mlbio, Shanghai, China) according to the manufacturer’s instructions.
2.13 Chromatin immunoprecipitation (ChIP)
The ChIP assay was performed using a ChIP assay kit (Cell Signaling Technology, Boston, MA, USA) according to the manufacturer’s instructions. Briefly, GC cells were crosslinked with 1% formaldehyde and quenched with glycine (Solarbio, Beijing, China) at room temperature, after which they were collected, washed and resuspended in lysis buffer (Cell Signaling Technology). The digested chromatin was incubated with anti-IgG (DIA-AN, Wuhan, Hubei, China) and anti-ZBTB10 (Abcam) for immunoprecipitation. DNA was purified and analyzed by qRT-PCR.
2.14 Luciferase reporter assay
Plasmid preparation was completed by Genechem (Shanghai, China). AGS and MKN1 cells were transfected with corresponding plasmids using Lipofectamine 3000 (Invitrogen). After 48 h, 20 µM BA was added to the medium and treated for 24 h. Luciferase activity was detected by the Multifunctional enzyme marker (Thermo).
2.15 Co-immunoprecipitation (Co-IP)
The cells were collected and were lysed on ice with IP lysate. Lysates were centrifuged for 10 min (12,000 ×g, 4 °C), and the supernatant was collected. Subsequently, the supernatant was incubated with corresponding primary antibodies overnight at 4 °C. The next day, protein A/G Magnetic Beads were added to the samples and incubated for 4 h at 4 °C. The beads were washed five times and then denatured at 97 °C for 7 min prior to WB analysis.
2.16 MG-132 treatment
For the ubiquitination assay, the GC cells were pretreated with the indicated plasmids for 48 h. After treated with 20 µM MG-132 for 6 h, the cells were lysed by IP lysis buffer. Next, immunoprecipitation against the corresponding protein was performed. Finally, the immunoprecipitants were subjected to WB.
2.17 Cellular immunofluorescence (IF)
AGS cells with stable ARRDC3 overexpression and negative control were seeded onto the chamber slides. After attaching for about 24 h, the cells on chamber slides were washed with PBS and fixed in 4% paraformaldehyde for 15 min at room temperature, followed by exposure to 0.3% Triton X-100 for 20 min. Subsequently, the cells were blocked in 2% goat serum for 1 h and incubated with specific primary antibodies overnight at 4 °C. The next day, cells were incubated fluorescent secondary antibodies corresponding to the species in dark for 2 h and DAPI was used for nuclear staining. Finally, images were acquired using a confocal microscope (FV3000, Olympus).
2.18 Immunohistochemistry (IHC)
The tissues were fixed with 10% paraformaldehyde and embedded in paraffin. After deparaffinization, rehydration, and antigen retrieval, the samples were incubated with primary antibodies using the corresponding antibodies. Images were taken with an Axio Scope.A1 398 vertical microscope (Leica). The final immunoreactive score (IRS) was obtained by multiplication of the intensity score and the quantity score. Briefly, two investigators independently scored the percentage of positive-stained cells (%PC) from 0 to 4 (0: no positive cells; 1: <10%; 2: 10–50%; 3: 51–80%; 4: >80%) and the staining intensity from 0 to 3 (0: no staining; 1: weak staining; 2: moderate staining; 3: strong staining). The IRS was then calculated as the product of these two scores (range, 0–12). We defined an IRS score of less than 6 as low expression and the rest as high expression.
2.19 Animal studies
Female BALB/c nude mice (5 weeks old) were obtained from Specific Pathogen-Free Biotechnology Co., Ltd. (Beijing, China) and housed under specific pathogen-free conditions. All animal experiments were performed with the approval of the Animal Care and Use Committee of the Sun Yat-sen University.
For the xenograft model, MGC803 cells (5 × 10⁶ in 100 µL PBS) with ZBTB10 overexpression and negative control were subcutaneously injected into each flank of nude mice (six mice/group). Tumor size was measured every 3 days (volume = length × width2 × 1/2). The mice were sacrificed 21 days after tumor cell implantation. The tumors were weighed, imaged, fixed in 4% paraformaldehyde. To investigate the function of BA, xenograft models were established using MGC803 cells with knockdown ZBTB10 and negative control according to the methods in previous studies [17]. Seven days later, the tumors grew to approximately 100 mm3, and tumor-bearing mice were randomly assigned to four groups.
For the lung metastasis model, MGC803 cells (1 × 10⁶ in 100 µL PBS) overexpressing ZBTB10 and the negative control were injected into the tail vein of nude mice. The mice were sacrificed 8 weeks after GC cell injection and pulmonary metastatic nodules were counted. Finally, the lungs were resected, photographed, and fixed in 4% paraformaldehyde for further analyses. Similarly, we explored the effect of BA on lung metastasis according to a previous study [22].
For the popliteal lymph node metastasis model, MGC803 cells (1 × 10⁶ in 20 µL PBS) with ZBTB10 overexpression and negative control were injected into the left footpad of mice (twice in 3 days). The mice were sacrificed after 8 weeks, and the lymph node transfer ratio was determined. The footpad and popliteal lymph nodes of the left leg were resected, photographed, and fixed in 4% paraformaldehyde for further analyses.
2.20 Statistical analysis
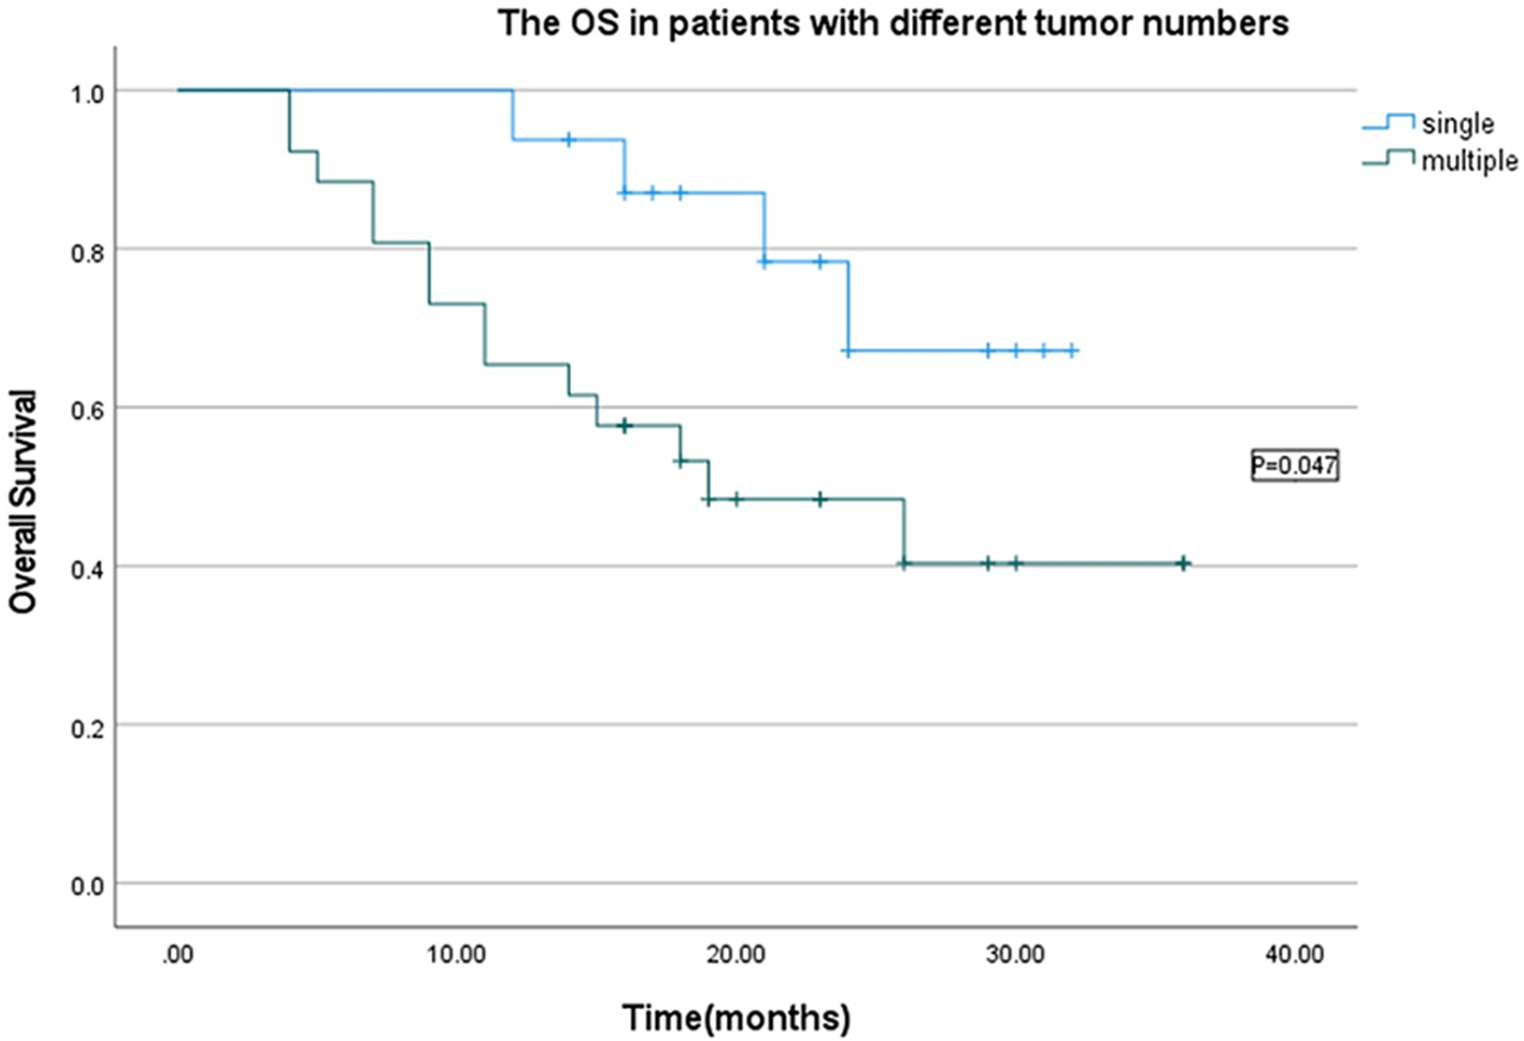
All statistical analyses were performed using SPSS 22.0 (IBM, Chicago, IL, USA) and GraphPad Prism 8.0 (GraphPad, La Jolla, CA, USA). All results were presented as the mean ± standard deviation (SD) of data from independent bio-triplications. Data analysis in each group was performed using Student’s t-test, and one-way or two-way analysis of variance. Kaplan-Meier analysis was used to determine the survival differences. P < 0.05 was considered to indicate a statistically significant difference.


留言 (0)