
記住我
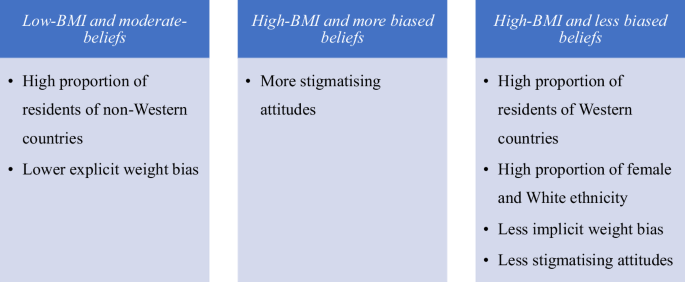
Table 1 shows participant characteristics. Of 683 participants recruited, 146 did not complete any survey items and 23 failed attention check questions and were removed, leaving a final sample of 514. Mean (M) age was 49 years (standard deviation (SD) 17.7). The majority of the sample were female (n = 316; 61.5%) and White (n = 310; 60.1%). Overall, 47.2% of the participants reported a BMI of 25 kg/m2 or above, which was associated with country of residence (χ2 = 51.4; p < 0.001); a greater proportion of participants from the US had a BMI of ≥30 kg/m2 compared to other countries.
Table 1 Participant demographic characteristics and difference across country of residence.Magnitude of weight biasSupplementary Tables S2 and S3 present descriptive information and correlations regarding weight bias and related measures. Fat phobia, ATOP, and IAT scores differed by country of residence but not gender. The BAOP, empathy, and SATAQ scores were not statistically significantly different by country of residence. Empathy scores differed by gender. There was no statistically significant correlation between FPS and IAT.
Factors associated with explicit weight biasThe final model to predict FPS (fat phobia; model 4) was statistically significant (R2 = 0.22, F = 7.625, p < 0.001), explaining 22% of the variance in FPS scores. Scores differed by country of residence and employment status, explaining 17% of variance in FPS. Residents of Australia, Canada, and the UK reported the highest FPS scores, while the residents of India (B = −0.45, p = 0.02) reported the lowest. After accounting for demographics, BMI, and weight self-perception, a stronger belief that weight is not controllable (less biased) was associated with lower FPS scores (B = −0.13, p < 0.01) while a greater awareness of sociocultural standards of body ideals (more biased) was associated with higher FPS scores (B = 0.03, p < 0.01; Supplementary Table S4).
Factors associated with attitudes towards PPP women living with overweight or obesityThe full model to predict ATOP (model 4) was statistically significant (R2 = 0.29, F = 7.625, p < .001) explaining 29% of the variance in ATOP scores (Supplementary Table S5). Older people (B = 0.09, p = 0.04) and individuals with higher BMI (B = 0.30, p = 0.02) held less stigmatising attitudes. After accounting for demographic variables, BMI, and weight self-perception, a stronger belief that weight is not controllable (less biased) was associated with less stigmatising attitudes (B = 0.73, p < 0.01) while a greater awareness of sociocultural standards of body ideals (B = −1.20, p < 0.01) was associated with more stigmatising attitudes. BAOP and SATAQ scores explained 14% and 8% of the variance in ATOP score, respectively.
Factors associated with implicit weight biasThe full model to predict implicit weight bias (model 2) was statistically significant (R2 = 0.14, F = 5.43, p < 0.001). Multivariable analyses (Supplementary Table S6) revealed that IAT scores differed by country of residence with residents of Australia (B = −0.14, p = 0.04) and the UK (B = −0.16, p = 0.02) reporting the lowest scores, but no statistically significant difference was observed for Malaysia (p = 0.67) and India (p = 0.67). Individuals with higher educational status (B = −0.20, p < 0.01) exhibited lower implicit weight bias. Older people (B = 0.01, p < 0.01) and individuals with White ethnicity (B = 0.18, p = 0.04) exhibited higher implicit weight bias, explaining 13% of the variance in IAT score. A stronger belief that weight is not controllable (less biased) (B = −0.01, p = 0.01) was associated with lower implicit weight bias.
Latent profilesResults from the latent profile analysis (LPA) analyses are presented in Supplementary Table S7. A series of 4 profile models were estimated and fit indices evaluated. All of the information criteria (-2LL, AIC, BIC, and aBIC) continued to decrease through the 4-profile solution, except for BIC which increased for the 4-profile model – indicating the 3-profile solution was a better model. That said, likelihood ratio tests initially indicated that 2 profile solution was a better fit than the 3-profile solution (VLMR: p = 0.12, LMR: p = 0.12); however, the BLRT indicated that 3 profiles were better than 2 profiles. When inconsistencies in likelihood ratio tests arise, the recommendation is to use BIC to make final determinations [28]. As such, the 3-profile solution was retained. The three groups differed primarily in terms of average BMI, BAOP scores, and self perception of living with obesity. SATAQ scores were generally comparable across groups (range: 3.2–3.442).
Profile 1 (n = 326, 63.4%) – we labelled this profile ‘low-BMI and moderate-beliefs’. It was characterised by individuals with an average BMI of 22.89 kg/m2 (SE = 0.20), moderate BAOP (M = 16.11, SE = 0.39), and zero individuals self-perceived to be living with obesity. Profile 2 (n = 110, 21.4%) – we labelled this profile ‘high-BMI and more biased beliefs’. This profile was characterised by individuals with an average BMI of 30.26 kg/m2 (SE = 0.97), low BAOP (M = 13.77, SE = 0.84), and 86% of individuals self-perceived to be living with overweight or obesity. Profile 3 (n = 78, 15.2%) – was labelled ‘high-BMI and less biased beliefs’. It was characterised by individuals with an average BMI of 30.33 kg/m2 (SE = 0.89), the highest BAOP (21.66, SE = 2.55), and 100% of individuals self-perceived to be living with overweight or obesity.
Differences on sociodemographic characteristicsProfile descriptives for sociodemographic characteristics and dependent variables are presented in Table 2 and Fig. 1. Figure 1 is provided to support the interpretation of the findings. Individuals with high-BMI and less biased beliefs, compared to low-BMI and moderate-beliefs, were more likely to be female (81% vs 56%), White (76% vs 54%), and living in Western countries (Australia: 26% vs 20%, USA: 19% vs 13%, UK: 21% vs 14%). With regard to education, individuals with high-BMI and more biased beliefs, compared to low-BMI and moderate-beliefs, were marginally more likely to have technical or vocational training (33% vs 21%) and less likely to have a master’s degree and above (8% vs 21%). There were no differences in age, employment, or marital status.
Table 2 Means, standard errors, and statistical results for latent profile analyses.Fig. 1
Summary of latent profile analyses incorporating sociodemographic and weight bias measures across three distinct profiles.
OutcomesCompared to low-BMI and moderate-beliefs, individuals with high-BMI and more biased beliefs had significantly higher FPS scores (i.e. more explicit weight bias). Individuals with high-BMI and less biased beliefs had marginally lower IAT scores (i.e. lower implicit weight bias) compared to those with low-BMI and moderate-beliefs. Additionally, individuals with high-BMI and less biased beliefs had marginally higher ATOP scores (i.e. less stigmatising attitudes) compared to low-BMI and moderate-beliefs and high-BMI and more biased beliefs.
Generally, the profile of low-BMI, moderate-beliefs compared to High-BMI, more biased beliefs and High BMI, less biased beliefs was characterised by lower explicit weight bias and constitutes a high proportion of participants from developing countries. High-BMI, less biased belief, on the other hand, constitutes high proportion of female, White ethnic group and participants from Western countries. Also, this profile was characterised by low implicit weight bias and less stigmatising attitudes compared to either low-BMI, moderate beliefs or High-BMI, more biased beliefs groups (Fig. 1).
留言 (0)