Diabetic retinopathy (DR) is one of the most serious ocular complications of diabetes and a serious blinding eye disease (1–3). According to the World Diabetes Federation, the total number of patients with diabetes worldwide was 536.6 million in 2022, and it is estimated that it will reach 783 million in 2045. Early DR typically does not cause symptomatic visual loss, and while chronic hyperglycemia is the main risk factor for visual loss due to DM, it does not always result in visual loss. The existence of proliferative diabetic retinopathy (PDR) at the first visit is usually related to delayed DM diagnosis or inadequate screening protocols.
In order to evaluate the degree of fundus lesions in patients with DR, ophthalmoscopy, fundus photography, optical coherence tomography (OCT), and fundus fluorescein angiography (FFA) are usually used. If the changes of retinal microcirculation can be found and intervened in time in the early stage, the visual quality prognosis of DR may be improved.
In recent years, optical coherence tomography angiography (OCTA) has provided a new tool for the early screening of DR. OCTA has been shown to be more sensitive than a doctor’s examination or fundus imaging, and capillary loss is detected earlier when the clinical lesions of DR become apparent (4–7). OCTA utilizes the contrast of light reflectance between blood and tissue to extract the blood flow signal and generate the image of vascular structure. It has a built-in quantitative analysis index to measure vascular morphology and density, which can provide detailed retinal blood flow and thickness information (8). In the past, most studies were limited to the early changes of macular blood flow density and FAZ in patients with DR or DR at different stages, while there were few studies on the changes of optic disc area in patients with early DR (9, 10). The purpose of this study was to compare the changes of capillary density and thickness of pRNFL within early DR, DM, and healthy individuals in order to achieve the purpose of early diagnosis of NPRD so as to provide guidance for clinical practice.
Materials and methodsParticipantsThis was a prospective cross-sectional study. This study recruited 113 subjects who came to the Department of Ophthalmology or Endocrinology of Chenzhou Hospital affiliated to University of South China from August to December 2023 and conformed to the tenet of the Declaration of Helsinki and was approved by the hospital’s ethics committee (no. 2023144). Written informed consent was provided by all patients before joining the study.
Inclusion criteria: (1) diagnosed with type 2 DM (DM was diagnosed according to the criteria set by the American Diabetes Association (11)), (2) older than 18 years, and (3) agrees to and cooperates with relevant ophthalmic examinations.
Exclusion criteria: (1) optical media opacities, myopia with spherical equivalent < -1.50 DS, (2) glaucoma or binocular IOP difference greater than 5 mmHg, (3) has a history of ocular trauma or has received fundus treatment, such as retinal laser photocoagulation, intravitreal injection, fundus retinal surgery, etc., (4) nystagmus, strabismus, amblyopia, and other eye gaze function is poor, (5) has a history of serious hypertension, heart disease, blood system diseases, and other diseases affecting the blood flow of the optic disc, and (6) there are age-related macular degeneration, uveitis, retinal detachment, and other fundus diseases other than DR.
Demographic data and ophthalmic examinationData available for all patients included patient characteristics, duration of diabetes, type of diabetes, and treatment. The ocular examination performed included best corrected visual acuity (BCVA), intraocular pressure (IOP), computerized optometry, OCT, OCTA, and fundus photography. All patients included in the DM and NPDR groups completed laboratory tests including fasting blood glucose (FBG), glycated hemoglobin A1c (HbA1c), and fasting C-peptide. After mydriasis, fundus examination was performed by two experienced ophthalmologists. The subjects were divided into three groups: normal control (NC), diabetes mellitus without DR (DM), and mild nonproliferative diabetic retinopathy (NPDR).
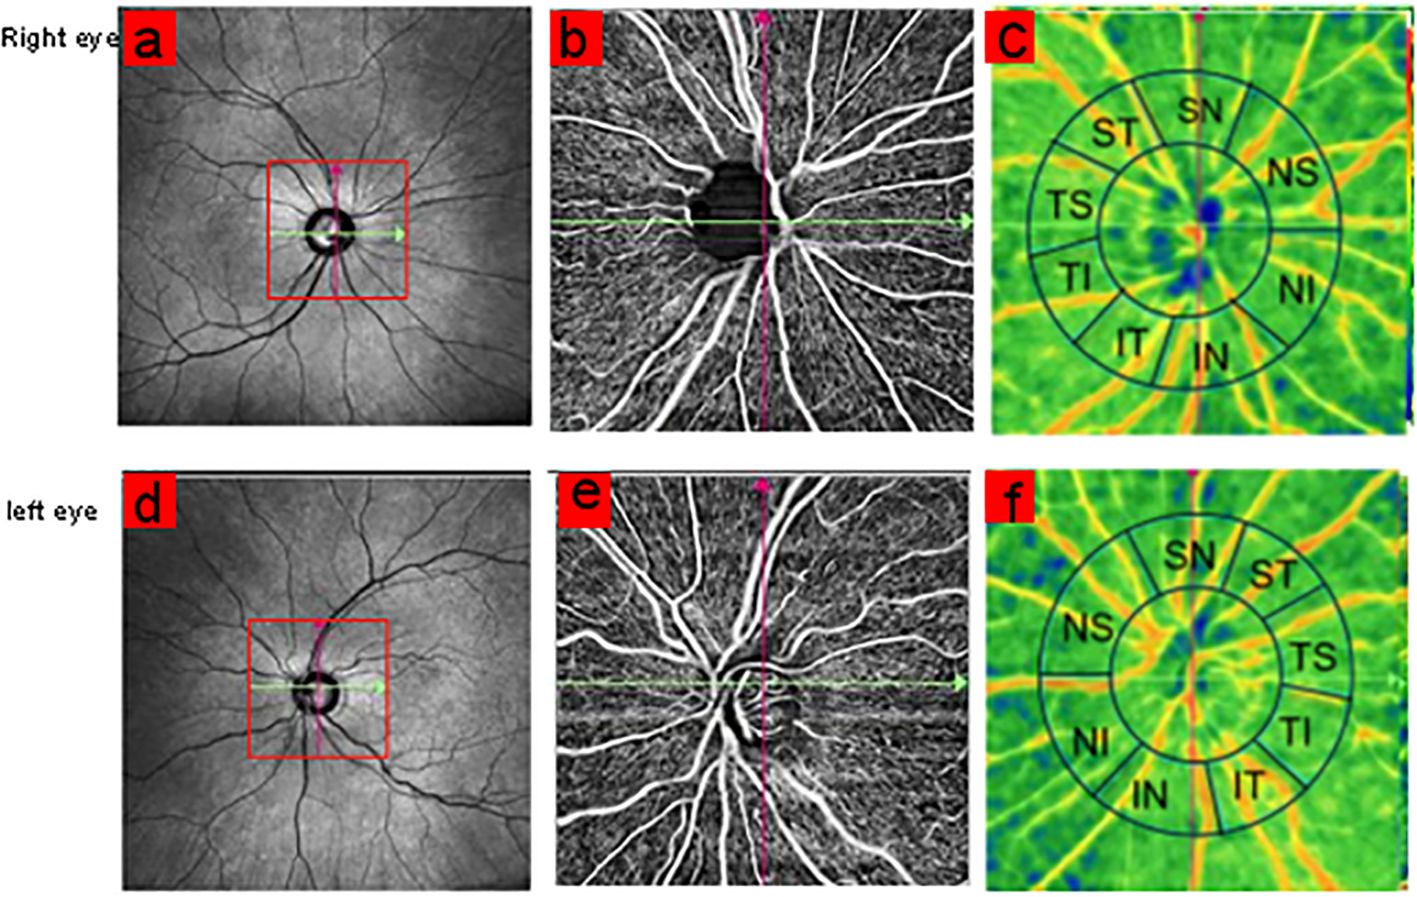
OCTA examinationThe patients were examined using TowardPi high-speed octa system (YG100k Yalkaid, TowardPi Medical Technology Co., Ltd., Beijing, China). The device is equipped with a swept-source vertical-cavity surface-emitting-laser (VCSEL) with a wavelength of 1,060 nm and has a scanning rate of up to 400,000 A/scans per second. The scan area was 6.0 mm × 6.0 mm (centered on the optic disc) (Figure 1). The boundary of the optic disc is automatically determined by the computer system. The RNFL of the annular area 1 mm wide outside the optic disc boundary is defined as the peripapillary retinal nerve fiber layer (pRNFL) and is divided into eight sectors: nasal superior (NS), nasal inferior (NI), inferior nasal (IN), inferior temporal (IT), temporal superior (TS), temporal inferior (TI), superior temporal (ST), and superior nasal (SN). The RNFL blood flow density and RNFL thickness of each sector are independently analyzed and calculated by the system’s built-in software. Each eye was measured at least twice, and the images were graded 1–10 by OCTA platform. The scanned images with quality less than 8 were excluded, and the image with the highest quality was selected for data analysis.

Figure 1. Scan centered on optic disc with 6 × 6 mm size area (A, D). The annular region outside the optic disc boundary was divided into eight sectors: NS, NI, IN, IT, TS, TI, ST, and SN (C, F).
Statistical analysisAll statistical analyses in this study were performed using SPSS software (version 25.0 SPSS, Inc, Chicago, IL, USA). The Kolmogorov–Smirnov test is used for normality test, and normally distributed variables are expressed as mean and standard deviation (SD). Nonparametric variables were expressed as median and interquartile range (IQR). Finally, the differences between groups were evaluated by ANOVA or Kruskal–Wallis test with Bonferroni correction, respectively. A p-value <0.05 was considered statistically significant. Receiver operating characteristic (ROC) analysis was used to determine the effect of OCTA index in diagnosing early DR, and the curve was drawn and the area under the curve (AUC) was calculated.
ResultsBaseline dataThe general characteristics of the 113 patients are shown in Table 1. There were no significant differences in gender composition, age, IOP, and fasting C-peptide among the three groups. There were significant differences in blood glucose (p = 0.005) and HbA1c (p = 0.006) between DM and NPDR groups (Table 1).

Table 1. Basic characteristics of the 113 patients.
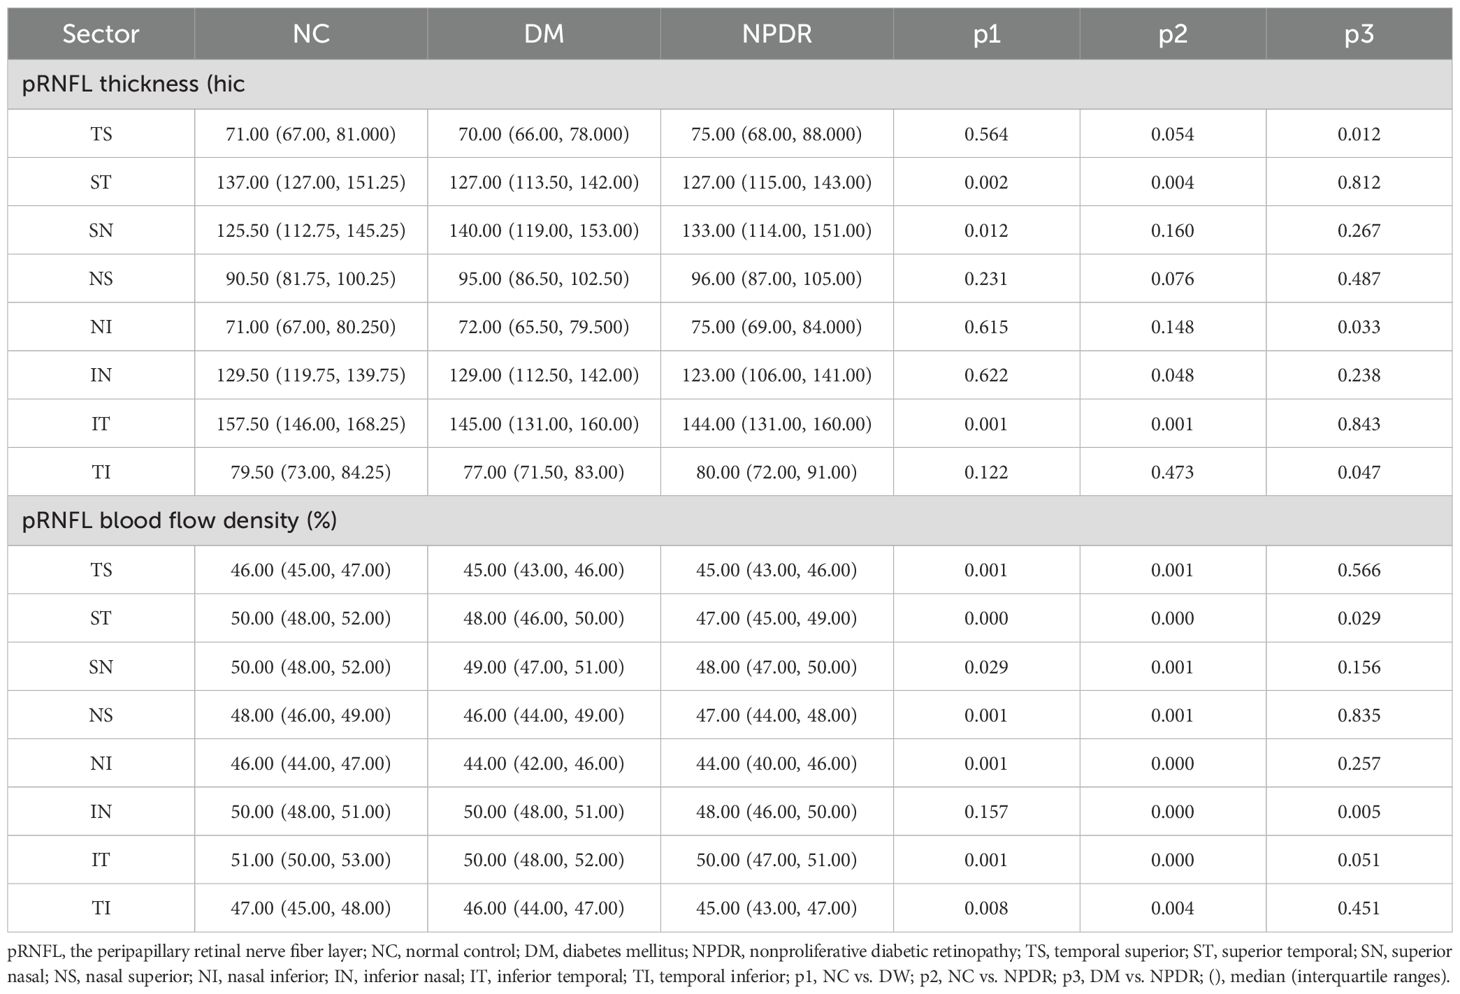
Capillary density and thickness analysis of eight sectorsThe thickness and blood flow density parameter values of the eight areas around the disc in each group are shown in Table 1. Compared with the control group, RNFL thickness was significantly different in the ST, SN, and IT sectors in the DM group (p < 0.05) and significantly different in the ST, IN, and IT sectors in the NPDR group (p < 0.05). Comparing between DM and NPDR groups, only the TI, NI and TS regions showed a significant increase in thickness, and the blood flow density in the ST and IN regions significantly decreased. Compared with the blood flow density of the eight sectors in the NC group, the blood flow density in all seven areas, except the IN area in the DM group, was significantly decreased (p < 0.05), and the blood flow density in all areas in the NPDR group was significantly decreased (p < 0.05) (Table 2).

Table 2. pRNFL blood flow density and thickness analysis of eight sectors in NC, DM, and NPDR.
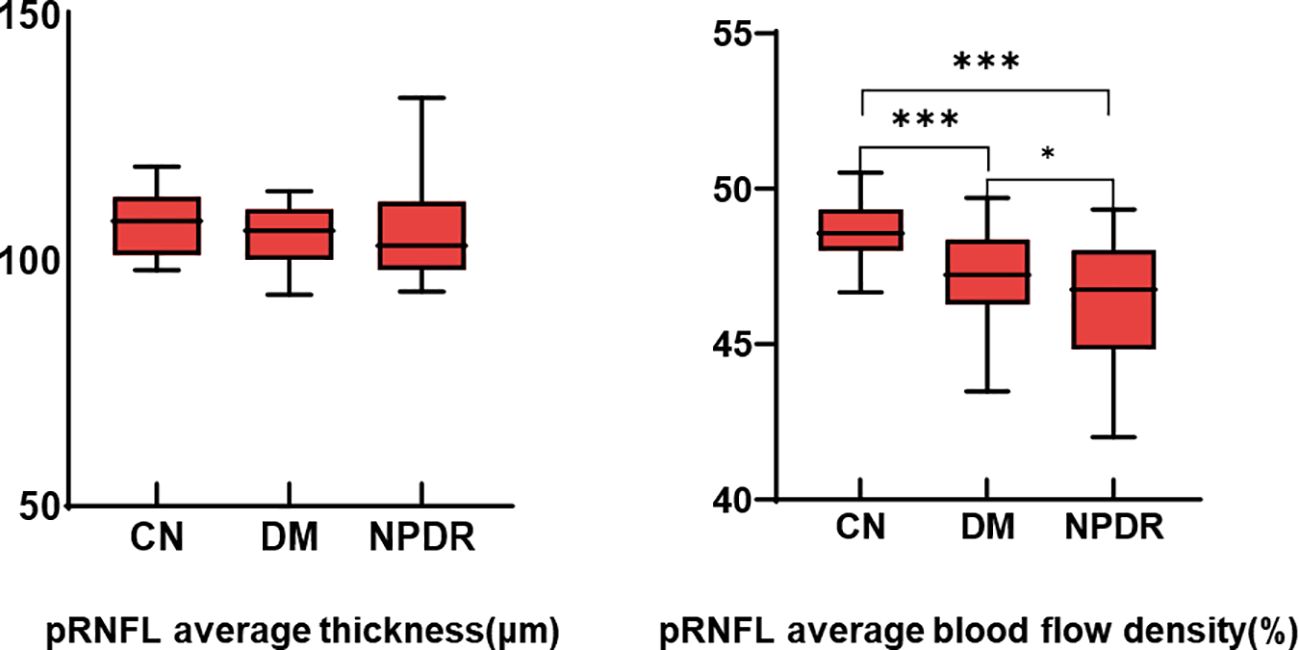
pRNFL average capillary density and thickness analysis of eight sectorsThe mean RNFL thickness was not statistically different among the three groups. Compared with the NC group, the average blood flow in the DM and NPDR groups decreased significantly (p < 0.001), and there was also a statistical difference between the DM and NPDR groups (p < 0.05) (Table 3 and Figure 2).

Table 3. pRNFL average blood flow density and thickness analysis of eight sectors.

Figure 2. Comparison of pRNFL average thickness and average blood flow density. *:p<0.05, ***:p<0.001.
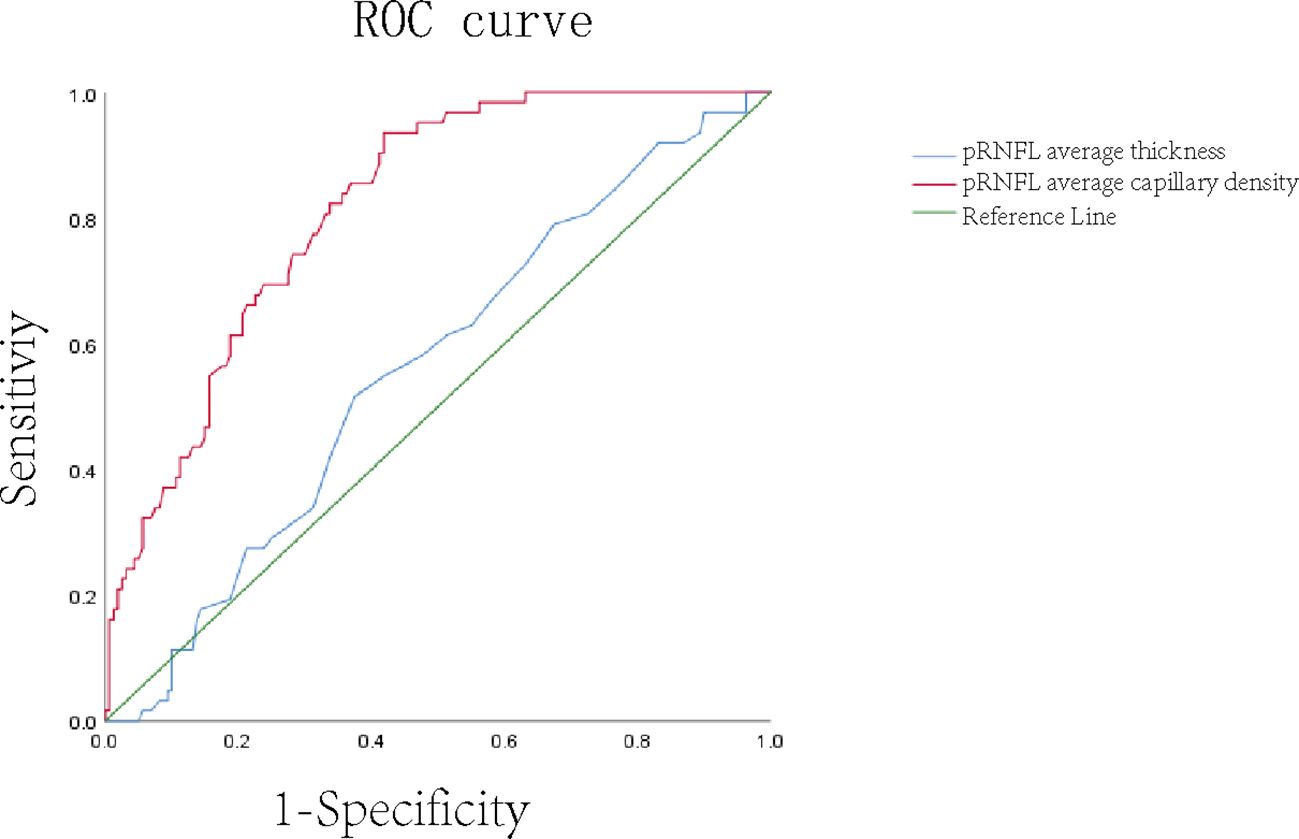
ROC curves in the NC and DR groupsThe ROC curve analysis with an AUC of 0.852 showed the ability of pRNFL average capillary density to distinguish normal eyes from DR eyes, while the AUC of pRNFL average thickness was only 0.572 (Figure 3).

Figure 3. ROC curve of average thickness and average blood flow density of pRNFL.
DiscussionIn the past, the research on early DR patients mainly focused on the fundus macular area and peripheral retinal and choroidal thickness. Previous studies have shown that the FAZ area of the retinal macula in patients with early DR is expanded (12), the retinal capillary density is decreased (13–15), and the choroidal vascular index (CVI) and choroidal thickness (CHT) are also significantly reduced (16). However, there are few studies on the early changes of the optic disc in DR patients. In this study, an optic-disc-centered, 6 × 6-mm area scan was performed, revealing the changes of pRNFL blood flow and thickness in early DR. Compared with the control group, the average blood flow density in each sector or annular area in the DM group and the NPDR group decreased significantly. The ROC curve analysis showed the predictive value of pRNFL average blood flow density for early DR, but the diagnostic significance of average thickness was not significant. It shows that pRNFL mean blood flow density is a very meaningful biomarker, which provides ideas for the development of new diagnostic and follow-up methods. In diabetic patients, hyperglycemia will produce free radicals and advanced glycation end products by triggering metabolic pathways such as polyol and hexosamine pathways, leading to inflammation and ischemia (17, 18). The nutrition of pRNFL is supplied by a unique capillary plexus (19, 20), which mainly comes from the branches of the central retinal artery (21, 22), and the high energy demand for unmyelinated axons located in pRNFL makes them extremely vulnerable to ischemic injury (23–25). The decrease of pRNFL blood flow density can be observed in the early stage of DR, which is confirmed by our results, and is similar to the research of Zhang et al. (26). Previous studies have shown that the RNFL thickness is higher in the inferior sector, followed by the superior and nasal sector, and the thinnest in the temporal sector (27, 28), and there is a positive correlation between pRNFL blood flow density and RNFL thickness (29, 30). It is also positively correlated with each sector (31), so it is expected that the density of retinal ganglion cells (RPCs) and the RNFL thickness distribution are similar. Li et al. (32) and others also showed that pRNFL thickness became thinner in the early stage of DR, but this was different from our results. Although the average thickness among the three groups showed a downward trend, it did not show significant statistical differences. We only observed that the thickness of ST and IT in the DM group and the NPDR group was significantly lower than that in the NC group. RPCs located in the superior or inferior temporal maculae send their axons in an arcuate manner to the superior temporal and inferior temporal portions of the optic nerve, respectively (33), making these locations abnormal earlier than the other regions in the early stage of the disease. RNFL thinning at the edge of the optic disc in the early stage of glaucoma usually also occurs first in the superior temporal and inferior temporal regions (34).
There are still some limitations in this study. Firstly, the sample size of this study is relatively small, which may affect the reliability and generalizability of the results. Future studies can expand the sample size to increase the reliability of the results. Secondly, this study adopts a cross-sectional design, and further research can adopt a longitudinal tracking design with long-term follow-up to observe the blood flow density and thickness of pRNFL so as to better observe its relationship with the development of DR. Moreover, we cannot explore the relationship between the changes of blood flow density and thickness around the optic disc and the risk of cardiovascular disease and the level of diabetes control in diabetic patients. Future studies can further study these related factors and comprehensively analyze their predictive value for retinopathy. A further study on these related factors and validation of the utility of these parameters as biomarkers of diabetic retinopathy are of great significance for the diagnosis and treatment of DR.
In conclusion, the results of this study showed that pRNFL capillary density was significantly changed in patients with early DR. There was no significant difference in the average thickness of pRNFL between the groups. Only the thickness of ST and IT, respectively, in the DW group and the NPDR group were significantly lower than those in the control group. These findings suggest that there are changes in the blood vessels and structure of the optic disc in the early stage, which may have important significance for the early detection of DR. It also confirms that the average blood flow density of pRNFL is a very meaningful biological parameter, which provides ideas for the development of new diagnostic methods and follow-up methods for mild nonproliferative diabetic retinopathy.
Data availability statementThe raw data supporting the conclusions of this article will be made available by the authors, without undue reservation.
Ethics statementThe studies involving humans were approved by The First People's hospital’s ethics committee (No. 2023144). The studies were conducted in accordance with the local legislation and institutional requirements. The participants provided their written informed consent to participate in this study
Author contributionsZC: Data curation, Formal analysis, Investigation, Methodology, Project administration, Software, Validation, Writing – original draft, Writing – review & editing. TT: Investigation, Methodology, Project administration, Resources, Writing – review & editing. RL: Investigation, Resources, Software, Writing – review & editing. JP: Data curation, Resources, Validation, Visualization, Writing – review & editing. GK: Conceptualization, Funding acquisition, Investigation, Methodology, Project administration, Resources, Supervision, Validation, Writing – review & editing.
FundingThe author(s) declare financial support was received for the research, authorship, and/or publication of this article. This study was supported by the Natural Science Foundation of Hunan Province (grant No. 2023JJ50370) and Clinical Medical Technology Innovation Guidance Project of Hunan Province (grant no. 2021SK50307).
Conflict of interestThe authors declare that the research was conducted in the absence of any commercial or financial relationships that could be construed as a potential conflict of interest.
Publisher’s noteAll claims expressed in this article are solely those of the authors and do not necessarily represent those of their affiliated organizations, or those of the publisher, the editors and the reviewers. Any product that may be evaluated in this article, or claim that may be made by its manufacturer, is not guaranteed or endorsed by the publisher.
References1. Lin KY, Hsih WH, Lin YB, Wen CY, Chang TJ. Update in the epidemiology, risk factors, screening, and treatment of diabetic retinopathy. J Diabetes Invest. (2021) 12:1322–5. doi: 10.1111/jdi.13480
PubMed Abstract | Crossref Full Text | Google Scholar
4. Hwang TS, Jia Y, Gao SS, Bailey ST, Lauer AK, Flaxel CJ, et al. Optical coherence tomography angiography features of diabetic retinopathy. Retina (Philadelphia Pa.). (2015) 35:2371–6. doi: 10.1097/IAE.0000000000000716
PubMed Abstract | Crossref Full Text | Google Scholar
5. Rosen RB, Romo JSA, Krawitz BD, Mo S, Fawzi AA, Linderman RE, et al. Earliest evidence of preclinical diabetic retinopathy revealed using optical coherence tomography angiography perfused capillary density. Am J Ophthalmol. (2019) 203:103–15. doi: 10.1016/j.ajo.2019.01.012
PubMed Abstract | Crossref Full Text | Google Scholar
6. Alibhai AY, Moult EM, Shahzad R, Rebhun CB, Moreira-Neto C, McGowan M, et al. Quantifying microvascular changes using OCT angiography in diabetic eyes without clinical evidence of retinopathy. Ophthalmology. Retina. (2018) 2:418–27. doi: 10.1016/j.oret.2017.09.011
PubMed Abstract | Crossref Full Text | Google Scholar
7. Schottenhamml J, Moult EM, Ploner S, Lee B, Novais EA, Cole E, et al. An automatic, intercapillary area-based algorithm for quantifying diabetes-related capillary dropout using optical coherence tomography angiography. Retina (Philadelphia Pa.). (2016) 36:S93–S101. doi: 10.1097/IAE.0000000000001288
PubMed Abstract | Crossref Full Text | Google Scholar
8. Spaide RF, Fujimoto JG, Waheed NK, Sadda SR, Staurenghi G. Optical coherence tomography angiography. Prog retinal eye Res. (2018) 64:1–55. doi: 10.1016/j.preteyeres.2017.11.003
PubMed Abstract | Crossref Full Text | Google Scholar
9. Finn M, Baldwin G, Garg I, Wescott HE, Koch T, Vingopoulos F, et al. Comparative study of widefield swept-source optical coherence tomography angiography in eyes with concomitant age-related macular degeneration and diabetic retinopathy. Br J Ophthalmol. (2023) 108(7):963–70. doi: 10.1136/bjo-2023-323792
PubMed Abstract | Crossref Full Text | Google Scholar
10. Li Z, Alzogool M, Xiao J, Zhang S, Zeng P, Lan Y. Optical coherence tomography angiography findings of neurovascular changes in type 2 diabetes mellitus patients without clinical diabetic retinopathy. Acta diabetologica. (2018) 55:1075–82. doi: 10.1007/s00592-018-1202-3
PubMed Abstract | Crossref Full Text | Google Scholar
12. Ahmed MAA, Abdelhaleem AS. Evaluation of microvascular and visual acuity changes in patients with early diabetic retinopathy: optical coherence tomography angiography Study. Clin Ophthalmol (Auckland N.Z.). (2022) 16:429–40. doi: 10.2147/OPTH.S353426
PubMed Abstract | Crossref Full Text | Google Scholar
13. Wang XN, Cai X, Li SW, Li T, Long D, Wu Q. Wide-field swept-source OCTA in the assessment of retinal microvasculature in early-stage diabetic retinopathy. BMC Ophthalmol. (2022) 22:473. doi: 10.1186/s12886-022-02724-0
PubMed Abstract | Crossref Full Text | Google Scholar
14. Xu F, Li Z, Gao Y, Yang X, Huang Z, Li Z, et al. Retinal microvascular signs in pre- and early-stage diabetic retinopathy detected using wide-field swept-source optical coherence tomographic angiography. J Clin Med. (2022) 11:4332. doi: 10.3390/jcm11154332
PubMed Abstract | Crossref Full Text | Google Scholar
15. Zeng Y, Liu M, Li M, Wei D, Mao M, Liu X, et al. Early changes to retinal structure in patients with diabetic retinopathy as determined by ultrawide swept-source optical coherence tomography-angiography. Front Endocrinol. (2023) 14:1143535. doi: 10.3389/fendo.2023.1143535
PubMed Abstract | Crossref Full Text | Google Scholar
16. Qi Z, Si Y, Feng F, Zhu J, Yang X, Wang W, et al. Analysis of retinal and choroidal characteristics in patients with early diabetic retinopathy using WSS-OCTA. Front Endocrinol. (2023) 14:1184717. doi: 10.3389/fendo.2023.1184717
PubMed Abstract | Crossref Full Text | Google Scholar
17. Kusari J, Zhou S, Padillo E, Clarke KG, Gil DW. Effect of memantine on neuroretinal function and retinal vascular changes of streptozotocin-induced diabetic rats. Invest Ophthalmol Visual Sci. (2007) 48:5152–9. doi: 10.1167/iovs.07-0427
PubMed Abstract | Crossref Full Text | Google Scholar
19. Jia Y, Simonett JM, Wang J, Hua X, Liu L, Hwang TS, et al. Wide-field OCT angiography investigation of the relationship between radial peripapillary capillary plexus density and nerve fiber layer thickness. Invest Ophthalmol Visual Sci. (2017) 58:5188–94. doi: 10.1167/iovs.17-22593
PubMed Abstract | Crossref Full Text | Google Scholar
20. Yu PK, Cringle SJ, Yu DY. Correlation between the radial peripapillary capillaries and the retinal nerve fibre layer in the normal human retina. Exp eye Res. (2014) 129:83–92. doi: 10.1016/j.exer.2014.10.020
PubMed Abstract | Crossref Full Text | Google Scholar
21. Cerdà-Ibáñez M, Duch-Samper A, Clemente-Tomás R, Torrecillas-Picazo R, Del Río NR, Manfreda-Dominguez L. Correlation between ischemic retinal accidents and radial peripapillary capillaries in the optic nerve using optical coherence tomographic angiography: observations in 6 patients. Ophthalmol eye Dis. (2017) 9:1179172117702889. doi: 10.1177/1179172117702889
PubMed Abstract | Crossref Full Text | Google Scholar
22. Ávila-Marrón E, Liscombe-Sepúlveda JP, Manfreda-Dominguez L, RoChina-Pérez P, Duch-Samper A. Purtscher's retinopathy case report: short posterior ciliary arteries contribution to radial peripapillary capillary system observed with optical coherence tomography angiography. Int Ophthalmol. (2019) 39:2661–5. doi: 10.1007/s10792-019-01086-9
PubMed Abstract | Crossref Full Text | Google Scholar
23. Mansoori T, Sivaswamy J, Gamalapati JS, Balakrishna N. Topography and correlation of radial peripapillary capillary density network with retinal nerve fibre layer thickness. Int Ophthalmol. (2018) 38:967–74. doi: 10.1007/s10792-017-0544-0
PubMed Abstract | Crossref Full Text | Google Scholar
24. Yu DY, Cringle SJ, Balaratnasingam C, Morgan WH, Yu PK, Su EN. Retinal ganglion cells: Energetics, compartmentation, axonal transport, cytoskeletons and vulnerability. Prog retinal eye Res. (2013) 36:217–46. doi: 10.1016/j.preteyeres.2013.07.001
PubMed Abstract | Crossref Full Text | Google Scholar
25. Wang L, Dong J, Cull G, Fortune B, Cioffi GA. Varicosities of intraretinal ganglion cell axons in human and nonhuman primates. Invest Ophthalmol Visual Sci. (2003) 44:2–9. doi: 10.1167/iovs.02-0333
PubMed Abstract | Crossref Full Text | Google Scholar
26. Zhang M, Jia F, Li N, Song C, Yang J, Yang K, et al. Quantitative analysis of the RPC vessel density and the RNFL thickness in patients with type 2 diabetes mellitus by using OCT angiography. Ophthalmic Res. (2021) 64:951–9. doi: 10.1159/000517145
PubMed Abstract | Crossref Full Text | Google Scholar
28. Poon LY, Valle DSD, Turalba AV, Falkenstein IA, Horsley M, Kim JH, et al. The ISNT rule: how often does it apply to disc photographs and retinal nerve fiber layer measurements in the normal population? Am J Ophthalmol. (2017) 184:19–27. doi: 10.1016/j.ajo.2017.09.018
PubMed Abstract | Crossref Full Text | Google Scholar
29. Yu PK, Balaratnasingam C, Xu J, Morgan WH, Mammo Z, Han S, et al. Label-free density measurements of radial peripapillary capillaries in the human retina. PLoS One. (2015) 10:e0135151. doi: 10.1371/journal.pone.0135151
PubMed Abstract | Crossref Full Text | Google Scholar
30. Scoles D, Gray DC, Hunter JJ, Wolfe R, Gee BP, Geng Y, et al. In-vivo imaging of retinal nerve fiber layer vasculature: imaging histology comparison. BMC Ophthalmol. (2009) 9:9. doi: 10.1186/1471-2415-9-9
PubMed Abstract | Crossref Full Text | Google Scholar
31. Liu G, Wang Y, Gao P. Distributions of radial peripapillary capillary density and correlations with retinal nerve fiber layer thickness in normal subjects. Med Sci monitor: Int Med J Exp Clin Res. (2021) 27:e933601. doi: 10.12659/MSM.933601
PubMed Abstract | Crossref Full Text | Google Scholar
32. Li Z, Wen X, Zeng P, Liao Y, Fan S, Zhang Y, et al. Do microvascular changes occur preceding neural impairment in early-stage diabetic retinopathy? Evidence based on the optic nerve head using optical coherence tomography angiography. Acta diabetologica. (2019) 56:531–9. doi: 10.1007/s00592-019-01288-8
PubMed Abstract | Crossref Full Text | Google Scholar
33. Shoch DE. Histology of the human eye: an Atlas and textbook. JAMA. (1972) 219:221–1. doi: 10.1001/jama.1972.03190280059024
Crossref Full Text | Google Scholar
34. Mwanza JC, Durbin MK, Budenz DL, Sayyad FE, Chang RT, Neelakantan A, et al. Glaucoma diagnostic accuracy of ganglion cell-inner plexiform layer thickness: comparison with nerve fiber layer and optic nerve head. Ophthalmology. (2012) 119:1151–8. doi: 10.1016/j.ophtha.2011.12.014
留言 (0)