
記住我
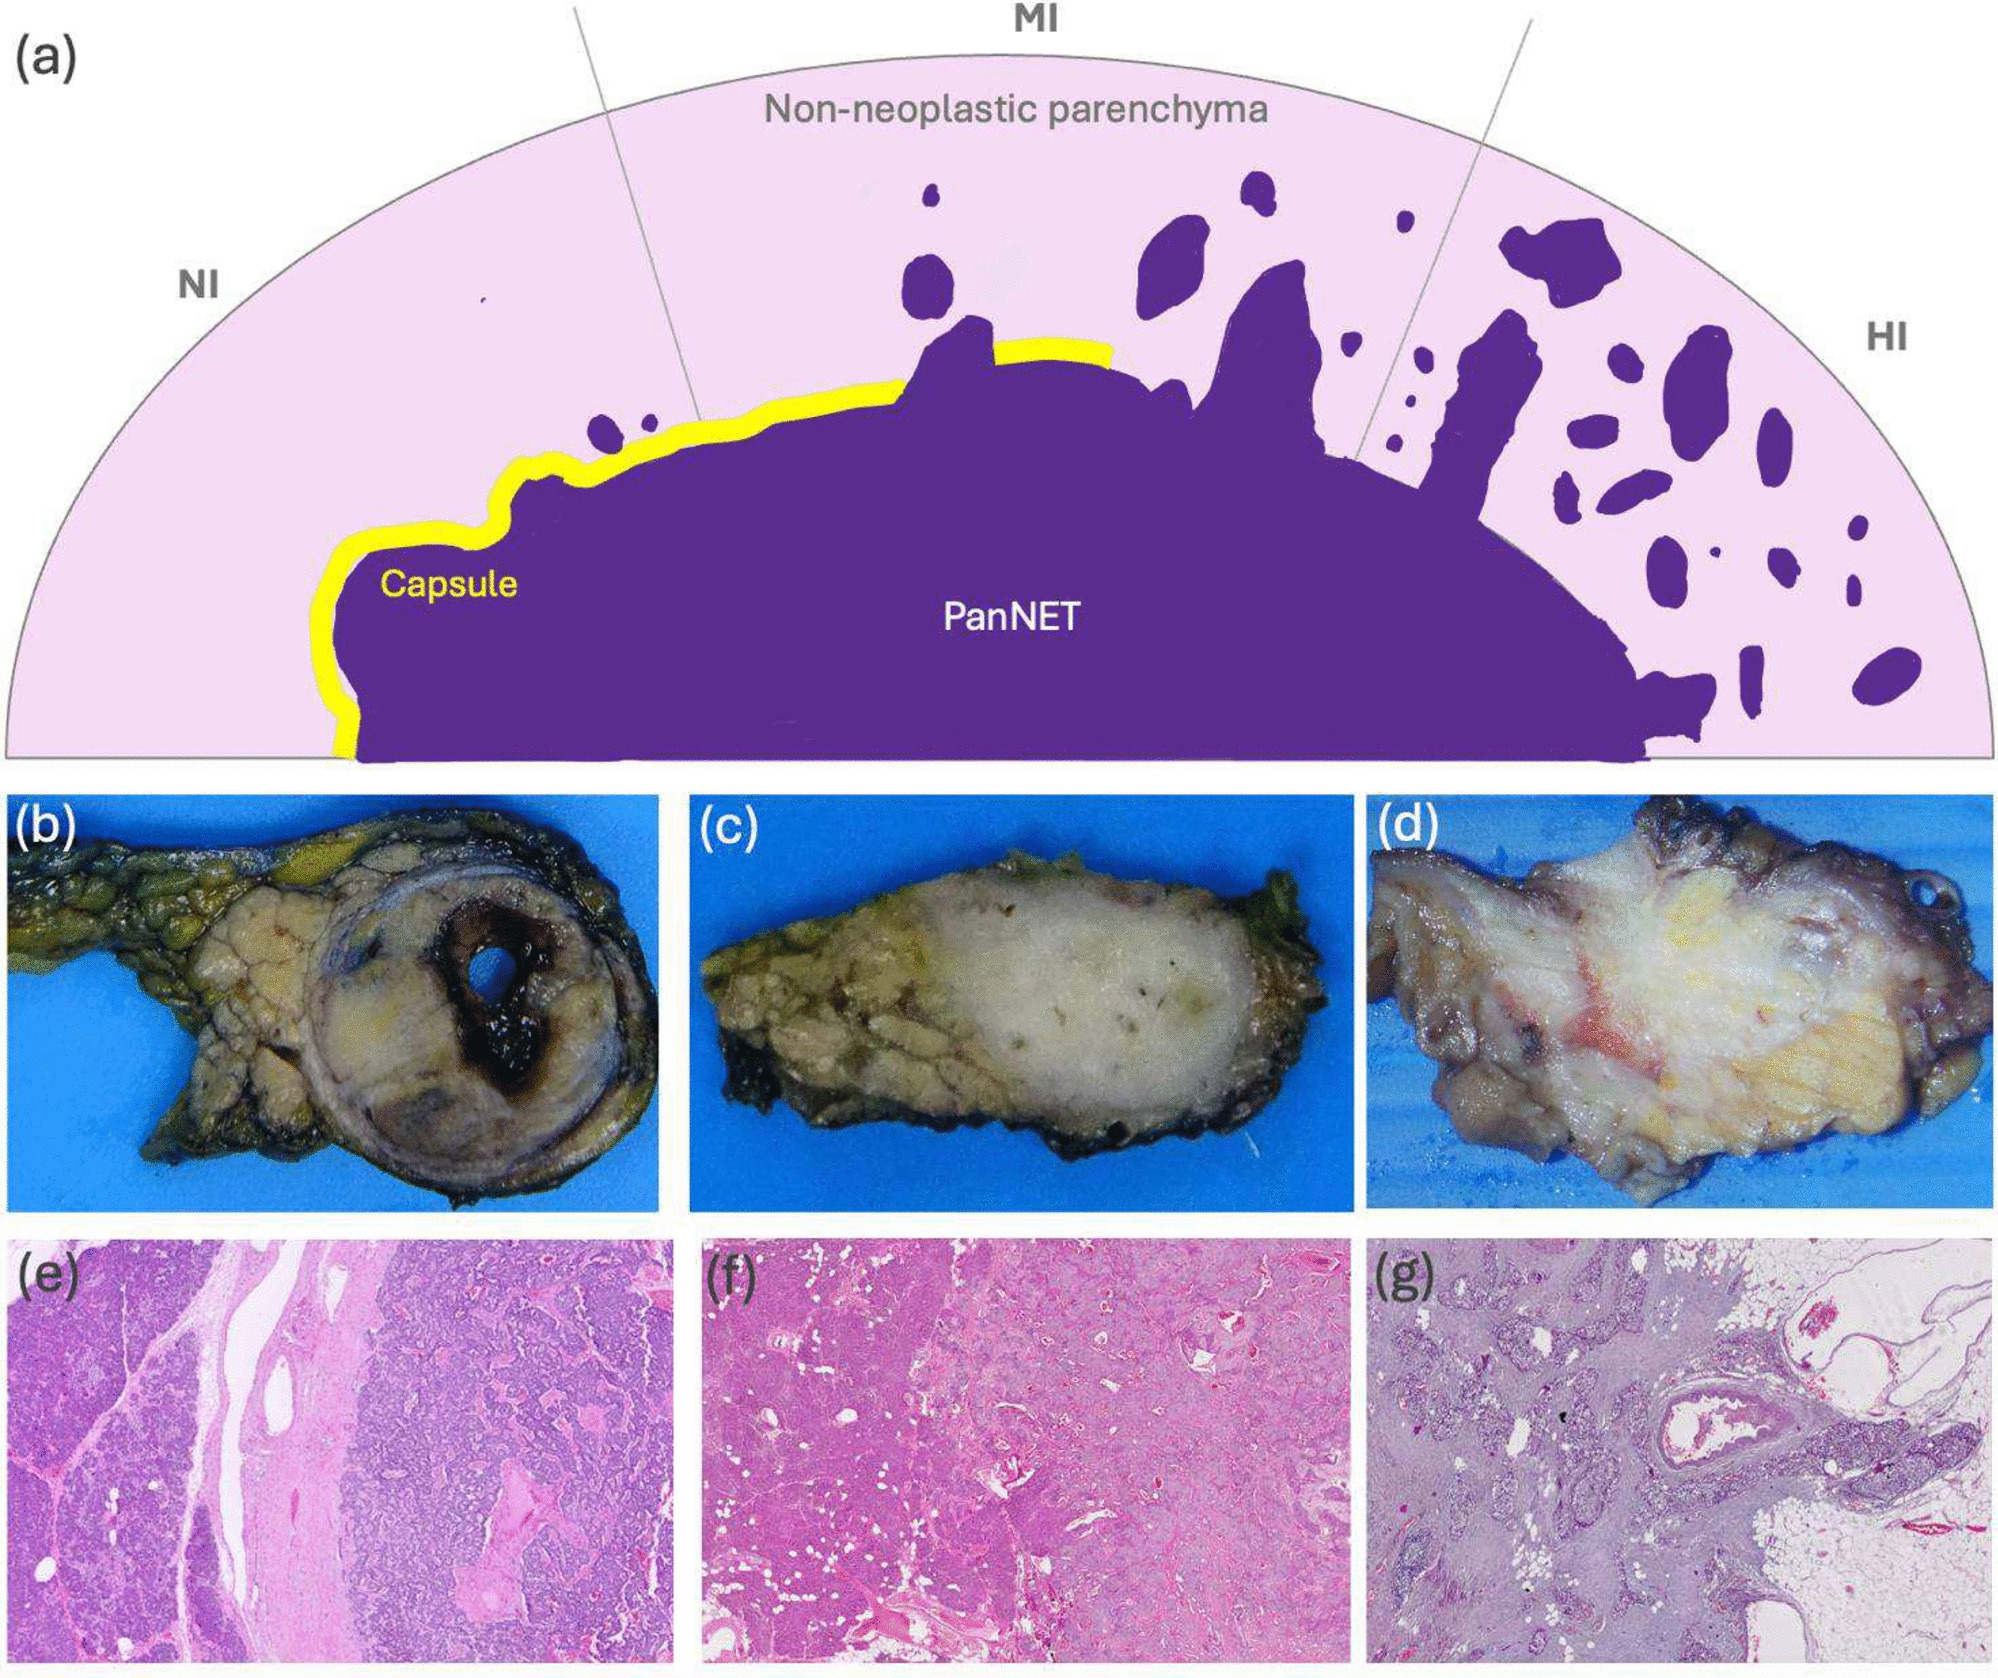


The cohort used in this study (n = 35) was derived from a bigger cohort of surgical resections of PanNETs as explained previously [3] whose characteristics are summarized in Table 1. Briefly, the cohort consisting of 105 HE-stained WSIs was collected from 35 cases, three WSIs for each case, and digitized with a whole slide scanner at 0.25 µm/pixel resolution. Each case was annotated with an infiltration pattern score (IPS), from IPS1 to IPS3, as explained in the previous study [4]. In this scoring, three tumor-containing slides were selected for each case, representing the tumor sites with the lowest, intermediate, and highest degrees of infiltration. Then, each slide was subjected to histopathological examination and individually scored from 1 to 5 according to the infiltration patterns observed at its tumor-NNP interface. Afterward, the case was assigned an infiltration pattern score based on the total score of the three slides: The case was labeled as “non/minimally infiltrative (IPS1)” if the total score was from 3 to 6, “moderately infiltrative (IPS2)” if it was from 7 to 9, and “highly infiltrative (IPS3)” if it was from 10 to 15. A schematic representation of infiltration patterns “NI” (non/minimally infiltrative), “MI” (moderately infiltrative), and “HI” (highly infiltrative), as well as macroscopic and microscopic correlates, are illustrated in Fig. 1.
Table 1 Clinicopathological characteristics of the PanNET cohort used in this study. Note that infiltration pattern scores were assigned by following the recently proposed scoring methodology [4]Fig. 1
a Diagram of infiltration patterns NI (non/minimally infiltrative), MI (moderately infiltrative), and HI (highly infiltrative). b, e Macroscopic and microscopic examples of categories IPS1/NI; c, f IPS2/MI, and d, g IPS3/HI
In the proposed pipeline, the first step trains a CNN classifier to select representative tumor-NNP interface patches from a WSI, and the second step trains a GNN classifier to categorize these selected patches. The case-level infiltration pattern score (IPS1, IPS2, or IPS3) was used as the ground truth label for all representative patches of this case to train the GNN. Additionally, a small subset of WSIs were patch-level annotated for training the CNN classifier at the first step (see Supplementary Figure S1).
Model DevelopmentThe proposed pipeline consists of two steps: selection of representative tumor-NNP interface patches from a WSI and infiltration pattern scoring of the WSI based on the selected patches. The schematic overview of this pipeline is shown in Fig. 2 and the details are provided in the following subsections.
Fig. 2
Overview of the proposed infiltration pattern scoring pipeline. After extracting image patches from the three stain-normalized WSIs of a given case, they are fed to the CNN classifier to select representative tumor-NNP interface patches from the WSIs. Then, each patch is modeled by constructing a cell-graph on its nuclei, and its infiltration pattern score was estimated by the GNN classifier. At the end, estimated scores of all selected patches from the three WSIs are voted to predict the case-level infiltration pattern score
Representative Patch SelectionIn this step, a CNN classifier is trained to distinguish PanNET regions from the others. Later, for any WSI, this trained classifier is used to identify its PanNET regions, and a subset of these regions is selected as the representative tumor-NNP interface. The patches belonging to this interface are then used for PanNET categorization in the next step (see Supplementary Sect. 1.2.1 for extended details).
The trained CNN classifier is used to predict the classes of patches in each WSI and to generate a PanNET prediction map to identify the largest tumor region of interest (TRoI) in the WSI (Fig. 3). Afterward, the patch selector identifies PanNET patches in the largest TRoI that are most likely to belong to the tumor-NNP interface. To do this, it first takes all PanNET patches on the border of the largest TRoI, i.e., if the patch belongs to the largest TRoI and is adjacent to another patch that the CNN classifier labeled with the NNPP or stroma class. To enrich the training dataset with more samples from the tumor-NNP interface, this step extends the patch selection up to maximum distance hops towards the tumor center in the prediction map (see Supplementary Figure S2). This subset of patches, together with their hop distances (used to weight their contributions in the deep learning model) serves as the input for the next step, infiltration pattern scoring.
Fig. 3
Visual results on three example WSIs. a Original WSIs with IPS1, IPS2, and IPS3 categorization, respectively. b Pathologist annotations for the largest PanNET region in each WSI. c PanNET regions predicted by the trained CNN classifier in the first step. d UMAP projection of the features used by the CNN classifier after training it to differentiate between three classes of stroma, NNPP, and PanNET. e Example patches selected from the focus of the CNN tissue classifier
Infiltration Pattern Scoring of PanNETsThe proposed pipeline relies on modeling infiltration patterns at the tumor-NNP interface by making use of a cell-graph representation and learning these patterns through a graph neural network (GNN) that is optimized with our proposed pathology domain knowledge integrated loss function, which we call InfiltrationLoss (see Supplementary Sect. 1.2.2).
A cell-graph is intended to represent the microenvironment of cells, where graph nodes symbolize the cell nuclei, capturing their morphological features, and graph edges represent cellular interactions, reflecting both histomorphological and spatial relationships between the cells. Its construction involves three main steps: nucleus detection for node identification, feature extraction for node (cell nuclei) embeddings, and topology representation for edge assignment among cells. In this work, cell locations are detected using Hover-Net, a nucleus segmentation network [14, 15]. The centroids of the nuclei detected by the Hover-Net model are used as the coordinates of the nodes in the cell-graph.
The selected PanNET patches are then classified into the three infiltration pattern scores (namely, IPS1, IPS2, and IPS3) by making an inference on their corresponding cell-graphs using a GNN classifier. Then, the GNN is trained to minimize the proposed domain knowledge integrated loss function, InfiltrationLoss. See Supplementary Figure S4 for further graph-based classifier details and analysis of the effectiveness of these selections on the performance. Note that the infiltration pattern scoring methodology [4] uses three WSIs to characterize a case. Thus, the representative PanNET patches selected for all three WSIs are put into the same bag, the grades of these patches are estimated by the trained GNN, and then they are voted over the bag to predict the case-level infiltration pattern score.
The proposed InfiltrationLoss prioritizes learning the patterns of the training patches as they get closer to the tumor-NNP interface. Thus, it introduces a distance-based regularization term in the loss function. This term gives the highest importance to the border patches and exponentially decreases that importance as patches move away from the tumor-NNP interface. The exponential decrease provides a better focus on smaller distances, which correspond to the patches closer to the tumor-NNP interface (see Supplementary Figure S3). Training the GNN to optimize this modified loss over all training patches enhances the training focus on the edges of the tumor-NNP interface, which is consistent to the practice of pathologists for infiltration pattern scoring of PanNETs [4]. Extended details about the graph construction and proposed InfiltrationLoss are provided in Supplementary Sect. 1.2.2.
Evaluation MetricsFor the quantitative evaluation of the classification tasks in our pipeline, we employed the weighted F1-score metric, which balances precision and recall. True positive (TP), false positive (FP), and false negative (FN) instances were identified at the appropriate level, either patch-level for tissue classification or case-level for PanNET classification. Precision was calculated as TP/ (TP + FP), recall as TP/(TP + FN), and F1-score as (2 × precision × recall)/(precision + recall). In order to account for class imbalance often encountered in histopathological datasets, we computed the weighted F1-score by averaging the F1-scores of individual classes weighted by their frequency in the dataset.
留言 (0)