
記住我


The average age was 28.4 ± 4.0 years, and 56% (n = 57) was female. Demographic factors did not differ across groups.
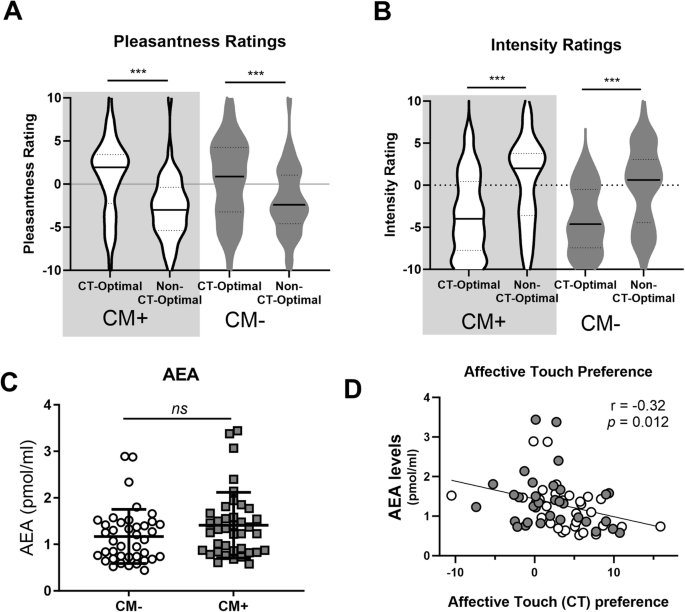
Biological samplesThere were no significant group differences in AEA (p = 0.10; Figs. 1C), 2-AG (p = 0.66), or cortisol (p = 0.54) between Groups (CM+, CM−). Oxytocin levels were not measured in Study 1.
Fig. 1: Preference for affective, CT-optimal touch is inversely related to anandamide levels.
All participants rated CT-optimal touch as more pleasant (A) and less intense (B), but these ratings did not differ between CM+ and CM− Groups (A, B). There were no significant differences in basal AEA levels between CM+ and CM− Groups (C). Across all participants, higher AEA levels were associated with reduced preference for socially relevant, affective touch, calculated as [(pleasantness of CT-optimal touch) – (pleasantness of CT-non-optimal touch)] (D). *** p < 0.001.
Observed touch task Pleasantness ratingsThere was a main effect of Touch Type (F(1,63) = 23.40, p < 0,001, partial η2 = 0.27; Fig. 1A), a significant interaction between Touch Type and AEA levels (F(1,63) = 7.13, p = 0.01, partial η2 = 0.10) but no between-subjects effect of AEA (p = 0.54). Post-hoc tests revealed that, as expected, slow, CT-optimal touch was rated as significantly more pleasant as fast, non-optimal touch (t(82) = 6.64, p < 0.001). This effect was not impacted by CM type as indicated on the Childhood Trauma Questionnaire (CTQ; emotional abuse, physical abuse, sexual abuse, emotional neglect, or physical neglect; p’s = 0.21 – 0.77).
To explore the relationship between touch perception and AEA levels, we calculated CT-Touch Preference as done previously [6]. We found a significant correlation between AEA levels and preference for CT-optimal touch (r(63) = 0.32, p = 0.012; Fig. 1D), such that those with lower AEA had greater preference for CT-optimal touch. There was no relationship between Touch Preference and 2-AG (p = 0.32) or Cortisol (p = 0.39), nor was there a correlation between Intensity Preference scores and any biological measure (all p > 0.05).
Intensity ratingsThere was a main effect of Touch Type (F(1,68) = 14.1, p < 0.001, partial η2 = 0.17; Fig. 1B) on intensity ratings. Post-hoc testing revealed that slow, CT-optimal touch as significantly less intense than fast, non-optimal touch (t(87) = 6.209, p < 0.001). There was no significant interaction between Touch Type and AEA (p = 0.18), nor was there a between-subjects effect of AEA (p = 0.39).
Affective picture task Valence ratingsThere was a main effect of Image Type (F(2,154) = 172, p < 0.001, partial η2 = 0.69; Fig. 2A), but no effect of AEA (p = 0.22) or Image Type × AEA interaction (p = 0.66). Post hoc follow-up tests revealed that Positive pictures were rated more positively than Neutral (t(1,99) = 28.6, p < 0.001) and Negative (t(1,99) = 37.8, p < 0.001) images, while Neutral images were rated more positive than Negative images (t(1,99) = 23.2, p < 0.001).
Fig. 2: Ratings of affective images are not impacted by CM status or AEA levels.
All participants rating positive images as more positive than neutral, and negative as more negative than neutral (A). Positive and negative images were rated as more arousing than neutral (B). There was no effect of CM status (CM+, CM−) or AEA levels on responses to affective images.
Arousal ratingsThere was a main effect of Image Type (F(2,154) = 9.14, p < 0.001, partial η2 = 0.11; Fig. 2B) but no significant effect of AEA (p = 0.63) or AEA x Image Type interaction (p = 0.83). Ratings of Arousal were greater for Positive (t(1,98) = 10.8, p < 0.001) and Negative (t(1,98) = -9.80, p < 0.001) images compared to Neutral, but were not significantly different from each other (p = 0.22).
Study 2 results—pharmacological elevation of AEADemographicsThe average age was 25 ± 7.7 years old and 45% of the sample was female. Groups (PBO, FAAHi) did not differ in age, gender, or any other demographic factor.
Biochemical measuresAs expected, AEA levels were significantly higher in the FAAHi group compared to PBO (F(1,38) = 82.3, p < 0.001, partial η2 = 0.68; Fig. 3A). There were no group differences in peripheral levels of 2-AG (p = 0.14), Cortisol (p = 0.40), or Oxytocin (p = 0.76).
Fig. 3: FAAH inhibition is associated with reduced preference for CT-optimal, affective touch.
A FAAH inhibition significantly elevated basal AEA levels. B There is an interaction between treatment (PBO, FAAHi) and touch type. C The placebo group shows a significant preference for CT-optimal affective touch; this effect is absent in the FAAHi group. D There is no group difference in ratings of touch intensity. ***p < 0.002.
Observed touch task Pleasantness ratingsThere was a main effect of Touch Type (F(1,42) = 17.0, p < 0.001, partial η2 = 0.29; Fig. 3B) and a Touch Type × Treatment interaction (F(1,42) = 10.5, p = 0.002, partial η2 = 0.20), but no main effect of Treatment (p = 0.29). Post-hoc follow-up tests revealed that CT-optimal touch was rated as more Pleasant in the PBO group (t(27) = 5.25, p < 0.001; Fig. 2C), as would be expected. However, there was no preference for CT-optimal touch in the FAAHi group (p = 0.19).
Intensity ratingsThere was a main effect of Touch Type (F(1,42) = 10.8, p = 0.002; Fig. 3D), such that CT-optimal touch was rated as less intense than non-optimal (t(43) = 3.56, p < 0.001). There was no effect of treatment (p = 0.93), nor was there a treatment x Touch Type interaction (p = 0.68).
Affective Image Task Valence ratingsThere was a main effect of stimulus type (F(2,86) = 613, p < 0.001, partial η2 = 0.93; Fig. 4A), but no effect of treatment (p = 0.26) or treatment × stimulus interaction (0.47). Post hoc tests revealed that Positive images were rated more positively than Neutral (t(44) = 22.9, p < 0.001) and Negative images (t(44) = 18.3, p < 0.001), and Negative images were rated more negatively than Neural (t(44) = 18.3, p < 0.001).
Fig. 4: FAAH inhibition does not impact responses to affective images.
Across all individuals, Positive images were rating more positively and Negative images were rated more negatively (A). Positive and Negative images were rated as more arousing than Neutral images (B). There was no effect of FAAH inhibition on ratings of Valence or Arousal.
Arousal ratingsThere was a main effect of stimulus type (F(2,86) = 63.3 p < 0.001, partial η2 = 0.60; Fig. 4B) such that Positive (t(44) = 8.09, p < 0.001) and Negative (t(44) = 12.2, p < 0.001) images were rated as more arousing than Neutral images. There was no effect of Treatment (p = 0.49) or Treatment × Stimulus interaction (p = 0.94).
留言 (0)