Endophytes are a group of living microorganisms that can successfully colonize various plant tissues without causing disease symptoms (Adeleke and Babalola, 2021; Santoyo et al., 2016). Plants develop complex coexistence and mutualistic relationships with various endophytes (Battu and Ulaganathan, 2020; Harman and Uphoff, 2019) due to the essential functions provided by these endophytes, such as nutrient acquisition (Bolan, 1991; Burragoni and Jeon, 2021; Xie et al., 2024), stress tolerance (Ali et al., 2014; Battu and Ulaganathan, 2020; Harman and Uphoff, 2019; Zhang et al., 2024), and disease suppression (Adeleke et al., 2021; Card et al., 2016; Omomowo and Babalola, 2019; Sena et al., 2024). The mutualistic benefits between plants and endophytes also depend on the genetic and environmental conditions of the host (Meng et al., 2022). In particular, plant root endophytes are inherited through host genes and successfully colonize after filtrating through rhizosphere microorganisms (Meng et al., 2022; Xie et al., 2024). Hence, plant root endophytes exhibit survival strategies similar to those of rhizosphere soil microorganisms, offering significant benefits for healthy plant growth and improved yield (Guo et al., 2024; Harman and Uphoff, 2019). Root endophyte symbiosis, which improves plant adaptability under stress conditions, is increasingly important. Notably, some root endophytes have developed strategies to adapt to the unique soil dynamic environments (Beltran-Garcia et al., 2021; Byregowda et al., 2022; Collavino et al., 2020; Edwards et al., 2015). For instance, root endophytic fungi play fundamental ecological roles in substituting phosphorus strategies in non-mycorrhizal crops or nitrogen availability (Mehta et al., 2019; Sindhu et al., 2024; Sun et al., 2022; Xie et al., 2024). These root endophytes served as a more accurate and effective microbial indicators for evaluating plant resistance to environmental disturbances (Rani et al., 2022; Sun et al., 2021). Although the understanding of microbial community composition in different soil environments has rapidly increased, it remains unclear whether the resistance of root endophytic bacteria and fungi to soil environments influences their beneficial effects on crop yield.
In the natural ecosystem, local microbial communities generally comprise a few dominant species (abundant taxa) and numerous low-abundance species (rare taxa) (Ma et al., 2024; Zheng et al., 2021). The assembly dynamics of abundant and rare taxa in different ecosystems are complex and inconsistent (Gschwend et al., 2021), especially in the context of soil nutrient imbalance in agricultural ecosystems, where they exhibit different distribution patterns and functional characteristics (Jiao et al., 2019a; Ma et al., 2022a; Wu et al., 2023). These differences are attributed to varying microbial survival strategies and substrate preferences (Long and Yao, 2020; Wan et al., 2021). Understanding community assembly process is vital for elucidating the coexistence status among soil microorganisms and preserving species diversity (Chen et al., 2020; Liu et al., 2024). The community assembly process has been categorized into deterministic process, including homogeneous and variable selection, and stochastic process, including homogenizing dispersal, dispersal limitation, and undominated (Chase and Myers, 2011; Stegen et al., 2015). Due to diverse ecological functions and collaborative capabilities of species, the assembly of abundant taxa communities often shows greater stochasticity (Xiong et al., 2020), which underpins the overall stability of the microbial community (Wan et al., 2021). Rare taxa, with high genetic diversity, can adapt to specific environments and play key roles in stabilizing microbial communities and ecosystem functions (Cui et al., 2023; Jia et al., 2022; Ma et al., 2024; Xue et al., 2020; Yu et al., 2024; Zhang et al., 2023). Some key taxa variations of the rare subcommunity have shown ecological potential for mediating microbial interactions, dominating community stability, and contributing to the complexity of symbiotic networks (Jousset et al., 2017; Liang et al., 2020; Xiong et al., 2020). Changes in the proportion and diversity of abundant and rare endophytic subcommunities inevitably affect the stability and ecological function of endophytic communities (Xi et al., 2024; Xiong et al., 2020; Zhang et al., 2024). Thus, understanding the distribution characteristics, assembly processes, and symbiosis patterns of abundant and rare subcommunities is crucial for examining how long-term fertilization affects endophytic microbial diversity and ecological stability.
The use of excessive inorganic nitrogen and phosphorus fertilizers in greenhouse cultivation, driven by yield and economic benefit, is a widespread practice (Wang et al., 2022; Zhang et al., 2017). This practice has led to excessive nutrient accumulation in the soil (Han et al., 2015; Tian et al., 2022) and exacerbated the negative effects on soil microbial community assembly (Bai et al., 2022; Banerjee et al., 2019; Liu et al., 2023b). Traditionally, manure has helped mitigate the harmful effects of chemical fertilizers on microbial communities, thereby contributing to the yield (Zhang et al., 2021). This positive and effective agronomic practice may be key to determining facility crop yield and maintaining agricultural sustainability. Increasing evidence suggests that environmental changes, such as variations in soil nitrogen and phosphorus levels, play a significant role in driving niche variation of root endophytic microbial species and determining the assembly process of root endophytic microbial communities (Bai et al., 2022; Long and Yao, 2020; Sindhu et al., 2024). Appropriate nitrogen levels are conducive to the dominant characteristics of endophytic fungi and endophytic bacterial communities, as well as higher diversity and richness (Liu et al., 2023b; Miranda-Carrazco et al., 2022; Sindhu et al., 2024). The composition and structural changes of rice root endophytic bacterial communities are affected by chemical phosphorus fertilizer (Long and Yao, 2020). Differences in the community structure of root endophytic bacteria and fungi in response to fertilization may be closely related to the host’s nutrient utilization. Therefore, it is essential to identify external environmental factors, particularly nitrogen and phosphorus availability, that influence the assembly of abundant and rare root endophytic subcommunities and their contribution to the yield. Understanding these factors can shed light on the co-evolution of different niche endophytic subcommunities with plants and help develop targeted strategies to manipulate key subcommunities and species to improve crop yields. In this study, we conducted a long-term experiment with nitrogen, phosphorus, and organic manure application in a solar greenhouse. The aims of this study were to (i) identify the relative contributions of the environmental factors in shaping root endophytes and assess how deterministic and stochastic processes influence abundant and rare subcommunities; and (ii) explore the species traits, ecological functions, and co-occurrence patterns of abundant and rare endophytic microbial taxa. We hypothesized the following: (i) The availability of nitrogen and phosphorus in the rhizosphere soil are potential key environmental variables driving stochastic process (dispersal limitation) in endophytic bacterial and fungal assembly, causing structural changes in subcommunities. (ii) Phosphorus-adapting endophytic fungi may occupy niches that complement nitrogen-adaption endophytic bacterial subcommunities, each contributing to main ecological functions. (iii) Rare bacterial subcommunities provide core species that maintain the stability of the endophytic microbial network and complement the functions of abundant bacterial subcommunities, ultimately enhancing crop yield potential.
2 Materials and methods 2.1 Field site and experimental designThe long-term targeted fertilization experiment was designed in 1996 as a solar greenhouse field at the Shenyang Agricultural University of Liaoning Province, China (41°480 N, 123°250 E). The experimental soil was classified as Glesol (FAO and ISRIC, 1988). The initial basic chemical properties were as follows: pH = 6.75, soil organic matter (SOM) = 24.30 g·kg−1, total P (TP) = 1.37 g·kg−1, available P (AP) = 70.80 mg·kg−1, labile P (LP) = 333.90 mg·kg−1, moderately labile P (MLP) = 364.73 mg·kg−1, non-labile P (NLP) = 1163.38 mg·kg−1, and total N (TN) = 1.16 g·kg−1. The fertilization experiment site has a cropping system of continuous tomato cultivation in spring and autumn every year. The fertilization experiment consisted of six treatments arranged in a completely randomized block design (1.5 * 1.0 * 0.8 m3 for each pool): (1) CKP0 (unfertilized), (2) CKP1 (chemical phosphorus fertilizer), (3) CNP0 (chemical nitrogen fertilizer), (4) CNP1 (chemical nitrogen plus phosphorus), (5) ONP0 (organic manure), and (6) ONP1 (organic manure plus phosphorus). Each treatment was replicated in three independent cement pools. The fertilizers application rate per year are shown in Supplementary Table S1. Chemical nitrogen fertilizer was applied twice during the tomato whole growing season. Chemical phosphorus fertilizers and organic manure (horse manure obtained 8.69% organic matter, 0.45% total N, and 0.30% total phosphorus) were evenly spread on the surface and incorporated into the plow layer by manual hoeing before planting. The fertilization experiment was conducted in the autumn season of the 26th year from August 2022 to December 2022. Each tomato (“Meisheng”) plant had a single branch after pruning, and there were four clusters of fruits on the branch and five fruits per cluster.
2.2 Root and rhizosphere soil samplingFour rhizosphere soils were randomly collected from each pool and then merged into one rhizosphere soil sample (Bulgarelli et al., 2012). Four tomato root samples were randomly collected from each pool, washed, and merged into one root sample, which was stored in sterilized 1 × PBS (pH = 7.0). All samples were promptly transported to the laboratory. The rhizosphere soil samples were stored at −80°C, while root samples for processed further to prepare for the isolation of root endophytic fungi and bacteria. A total of 2.0 g mixed roots of each sample were surface sterilized in 75% ethanol (1 min), 3.25% sodium hypochlorite (3 min), and 75% ethanol (30 s), followed by three rinses in distilled water (Guo et al., 2000). Root samples were then stored in liquid nitrogen immediately. The key difference was that all solutions used were sterile and the last sterile washed water of each root sample was placed in a PDA medium for 1 week at 28°C to confirm the effectiveness of surface sterilization. A total of 36 experimental samples, including 18 rhizosphere soil samples and 18 root samples (6 treatments × 3 duplicates), were stored at −80°C for subsequent DNA extraction.
2.3 Soil chemical parameters determinationSoil pH was measured using 1:2.5 (w/v) soil-to-water suspension. Soil organic carbon (SOC) was determined using the H2SO4-K2Cr2O7 oxidation capacity method (Mebius, 1960). Available phosphorus (AP) was determined through 0.5 M NaHCO3 extraction, while total phosphorus (TP) was measured through H2SO4-HClO4 digestion. Soil phosphorus fractions were prepared and analyzed as reported by Hedley et al. (1982) and Tiessen and Moir (1993). These phosphorus fractions were classified into LP (resin-Pi, NaHCO3-Pi, and NaHCO3-Po), MLP (NaOH-Pi and NaOH-Po), and NLP (HCl-Pi, concentrated HCl-Pi, concentrated HCl-Po, and residual P) (Maranguit et al., 2017; Shi et al., 2023). Total nitrogen (TN) was quantified using an automatic Kjeldahl distillation–titration method (Cabrera and Beare, 1993). Available nitrogen (AN) was measured using the alkali-hydrolyzed diffusion method, while soil nitrate (NO3−-N) and ammonium (NH4+-N) were quantified using a flow-injection autoanalyzer (Skalar San++ CFA, Erkelenz, Germany) (Bornemisza et al., 1988).
2.4 DNA extraction and high-throughput sequencingTotal DNA was isolated from 0.5 g of pooled root samples (which were created by randomly collecting four surface-sterilized roots and mixing them into a single sample from each pool) using the CretMagTM Plant DNA Mini Kit: CretBiotech, Suzhou, China, following the manufacturer’s instructions. The DNA samples obtained from root samples were amplified using PCR with specific primer sets that included adaptors and barcodes. Fungal ITS1 region amplification was as follows: ITS1F (5′-CTTGGTCATTTAGAGGAAGTAA-3′) and ITS2 (5′- GCTGCGTTCTTCATCGATGC-3′). 16S rDNA gene V5-V7 region amplification was as follows: 799F (5′- AACMGGATTAGATACCCKG-3′) and 1193R (5′-ACGTCATCCCCACCTTCC-3′) (Liu et al., 2023b). Additionally, to ensure efficiency and accuracy, PCR amplification was performed using TaKaRa Premix Taq® Version 2.0 (TaKaRa Biotechnology Co., Dalian, China), and the reactions took place in the thermocycler PCR system BioRad S1000 (Bio-Rad Laboratory, CA) under the following thermal cycling program for fungi: 95°C/3 min (initial denaturation) followed by 34 cycles of 95°C/20 s, 56°C/20 s, 72°C/30 s, 72°C/5 min (final extension), and lastly held at 12°C. The following thermal cycling program for bacteria is as follows: 98°C/30 s (initial denaturation) followed by 32 cycles of 98°C/10 s, 53°C/20 s, 72°C/30 s, 72°C/2 min (final extension), and lastly hold at 12°C. The PCR mixtures for fungi contain 25 μL of 2 × ES Taq MasterMix(Dye), 2 μL of forward primer (10 μM), 2 μL of reverse primer (10 μM), 50 ng of template DNA, and ddH2O added to a final volume of up to 50 μL. The PCR mixtures for bacteria contain 25 μL of Q5, 5 μL of forward primer (10 μM), 5 μL of reverse primer (10 μM), 50 ng of template DNA, and ddH2O added to a final volume of up to 50 μL. PCR reactions were performed in triplicate. DNA integrity of isolated DNA was visually inspected using 1.5% agarose gel electrophoresis, and DNA concentration and volume were determined using the NanoDrop2000 (Thermo Fisher Scientific, United States) (For detailed information, refer Supplementary Table S2). During the PCR process, negative controls with water and positive control tests were set. After comparing the concentration of PCR products, the required volume of each sample was calculated based on the principle of equal mass, and the PCR products were mixed accordingly. Target strips were cut and purified using the E.Z.N.A.® Gel Extraction Kit (Omega, United States) and quantified using GeneTools Analysis Software (Version4.03.05.0, SynGene), following the manufacturer’s instructions. The cDNA library was constructed using the NEBNext® Ultra™ II DNA Library Prep Kit for Illumina® (New England Biolabs, United States), according to the manufacturer’s instruction. Purified amplicons were pooled in equimolar and paired-end sequenced by the Shanghai Biotree Biotech Co., Ltd. (Shanghai, China) on the Illumina HiSeq PE250 sequencing platform. The resulting paired sequence reads were merged, trimmed, filtered, and clustered into zero-radius operational taxonomic units using USEARCH (version 0.2.7) with a sequence similarity threshold of 0.97 (Edgar, 2016a; Rognes et al., 2016). The UNITE (ITS) database and the Ribosomal Database Project (RDP) (16S) database were used for taxonomical alignment at a threshold of 0.8 using the SINTAX algorithm (Edgar, 2016b). These databases were used to align multiple sequences, remove annotation for chloroplasts or mitochondria, analyze the phylogenetic relationship between different operational taxonomic units (OTUs), and investigate the differences between the dominant microbial community species across different groups. All of raw reads data are available in the NCBI Sequence Read Archive (SRA) database (Accession Number: PRJNA1182544).
2.5 Data analysesA one-way ANOVA (p < 0.05) test was performed to analyze differences in the rhizosphere soil environment factors, yield, and the dominant microbial abundances among different fertilizations using IBM SPSS Statistics (version 22.0, IBM Corporation, Armonk, N.Y., United States) software. The analysis of microbial subcommunity characteristics were performed using R software (version 4.3.0), and some histograms were generated using Origin 2024. Abundant and rare OTUs were defined based on cutoffs above 0.1% and below 0.01% of total sequences, as described in previous studies (Jiao et al., 2017; Jiao and Lu, 2020; Zheng et al., 2021). The “abundant subcommunity” included OTUs with a mean relative abundance >0.1% in root endophytic bacterial and fungal communities across all samples, while the “rare subcommunity” included OTUs with a mean relative abundance <0.01%. The relative abundance of bacterial and fungal subcommunities at the phylum level was constructed using the “microtable” package in R (Liu et al., 2020). The Kruskal–Wallis test for α-diversity indexes (Shannon and Richness), non-metric multidimensional scaling (NMDS), and analysis of similarities (ANOSIM) were performed using the “vegan” package in R (Liu et al., 2015; Oksanen et al., 2012; Yu et al., 2024). The beta diversity was analyzed using the “betapart” package in R (Baselga and Orme, 2012). In this study, the Bray–Curtis-based Raup-Crick (RCbray) and the β-nearest taxon index (βNTI) were used to calculate the variations in phylogenetic and taxonomic diversity using the “comdistnt” function from the “picante” R package (Jiao and Lu, 2020). Quantitatively, the proportion of inferred bacterial and fungal subcommunity assembly ecological processes in root endophytes was analyzed using a phylogenetic bin-based null model analysis (with 999 randomizations), implemented via the “icamp.big” function in R (Ma et al., 2022a; Ning et al., 2020; Wu et al., 2023). Both homogeneous and variable selections were considered as forms of species sorting (deterministic process) (Jiao et al., 2019b). Based on the co-occurrence networks to explore the interrelationships of all OTUs in bacterial and fungal subcommunities, except for the rare and abundant subcommunities, the remaining OTUs were classified as “Others.” Robust correlations were identified using Spearman’s correlation coefficients (r) > 0.6 and false discovery rate-corrected p values <0.05 (p value corrected by FDR multiple test). These metrics were applied to construct random networks of root endophytes and four endophytic subcommunities using the “igraph” package in R (Hartman et al., 2018; Jiao et al., 2019b). The topological characteristics of the networks were calculated based on the following metrics: average clustering coefficient, average connectivity, average path distance, and modularity. Furthermore, the keystone species for endophytic subcommunity networks were identified based on the threshold values of Zi (measuring how well a node was connected to other nodes within its module) and Pi (measuring how well a node was connected to nodes between different modules), set at 2.5 and 0.62, respectively (Guimerà and Nunes Amaral, 2005; Lang et al., 2021; Liang et al., 2016; Wu et al., 2023). To identify the key root endophytic subcommunity and taxa predictors for yield, the “randomForest” package in R was used, and each predictor was assessed using the “rfPermute” package. A Mantel test was conducted to determine the correlation between community composition and rhizosphere soil environment factors. A structural equation model (SEM) was analyzed using IBM SPSS Amos 26 to quantify the direct and indirect effects of the rhizosphere environment factors (such as pH, AN, and MLP) and the α and β diversities of the bacterial subcommunities on the yield. All variables were standardized using Z transformation (mean = 0, standard deviation = 1) with the ‘scale’ function in the R package. The maximum likelihood method was employed to fit the model (Jin et al., 2020). The standardized total effects (STEs) of the rhizosphere soil nutrients and root endophytic bacterial subcommunities on the yield were calculated.
3 Results 3.1 Response of the rhizosphere soil physicochemical parameters to long-term fertilizationLong-term fertilization significantly increased the total nutrient content of the rhizosphere soil excluding NH4+-N (Table 1). The contents of SOC, TN, AN, and NO3−-N significantly increased in ONP0 and ONP1, by 175%–214%, 71%–84%, 362%–506%, and 956%–1,672%, respectively, compared with CKP0. Different fractions of phosphorus increased with the application of phosphorus and organic manure, with the highest increases in the contents of TP, AP, LP, and NLP observed in ONP1, by 284%, 426%, 330%, and 155%, respectively. The MLP content in ONP1, CKP1, and CNP1 significantly increased by 539%, 587%, and 756%, respectively, compared to CKP0. Soil pH significantly decreased across all treatments compared to CKP0, except in ONP0.
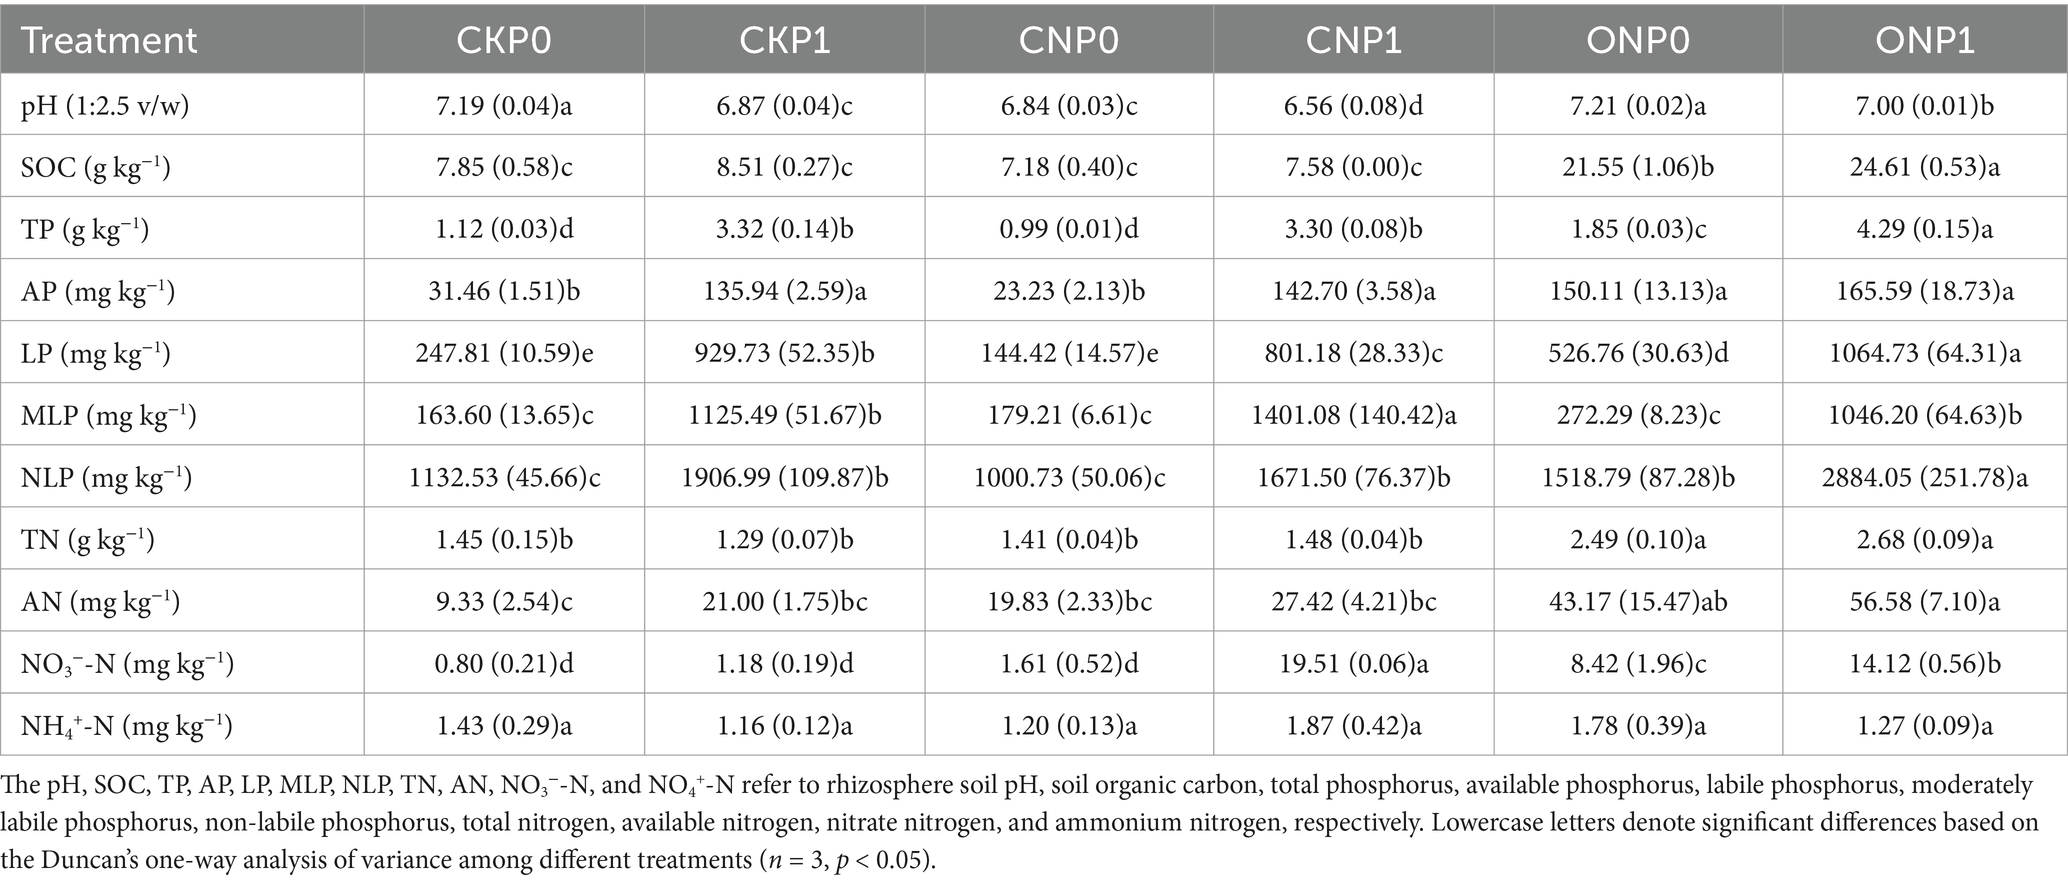
Table 1. Effects of long-term fertilization on rhizosphere soil physicochemical parameters.
3.2 Response of the endophytic microbial subcommunity characteristics to long-term fertilizationIn tomato roots, the total number of 3,122 bacterial OTUs and 487 fungal OTUs were observed (Supplementary Table S3). A high percentage of OTUs were recognized as rare taxa, constituting rare subcommunities of bacteria and fungi. These rare taxa represented an average of 84.30% and 55.44% of bacterial and fungal OTUs, respectively, but contributed only 6.04% and 0.91% to the average relative abundance in all samples. Conversely, abundant bacterial and fungal taxa constituted a small proportion of OTUs with mean values of 2.85% and 8.00% but accounted for 81.01% and 94.07% of the average relative abundance in all samples, respectively. The rare bacterial subcommunity exhibited higher α-diversity, in terms of both richness and Shannon indexes, compared to the abundant subcommunity under the same treatments. The rare fungal subcommunity showed only a higher Shannon index compared to abundant subcommunity under the same treatments (Figure 1). The Shannon index of abundant bacterial and fungal subcommunities significantly decreased in CNP0 and ONP0 compared to CKP0 (p < 0.05; Figures 1A,C). The richness of abundant and rare fungi in CNP1 and ONP0 also significantly decreased compared to CKP0 (p < 0.05; Figures 1G,H). There was no significant difference in the Shannon index of rare bacterial and fungal subcommunities or the richness of abundant and rare bacterial subcommunities across other treatments, compared to CKP0 (p < 0.05; Figures 1B,D–F).
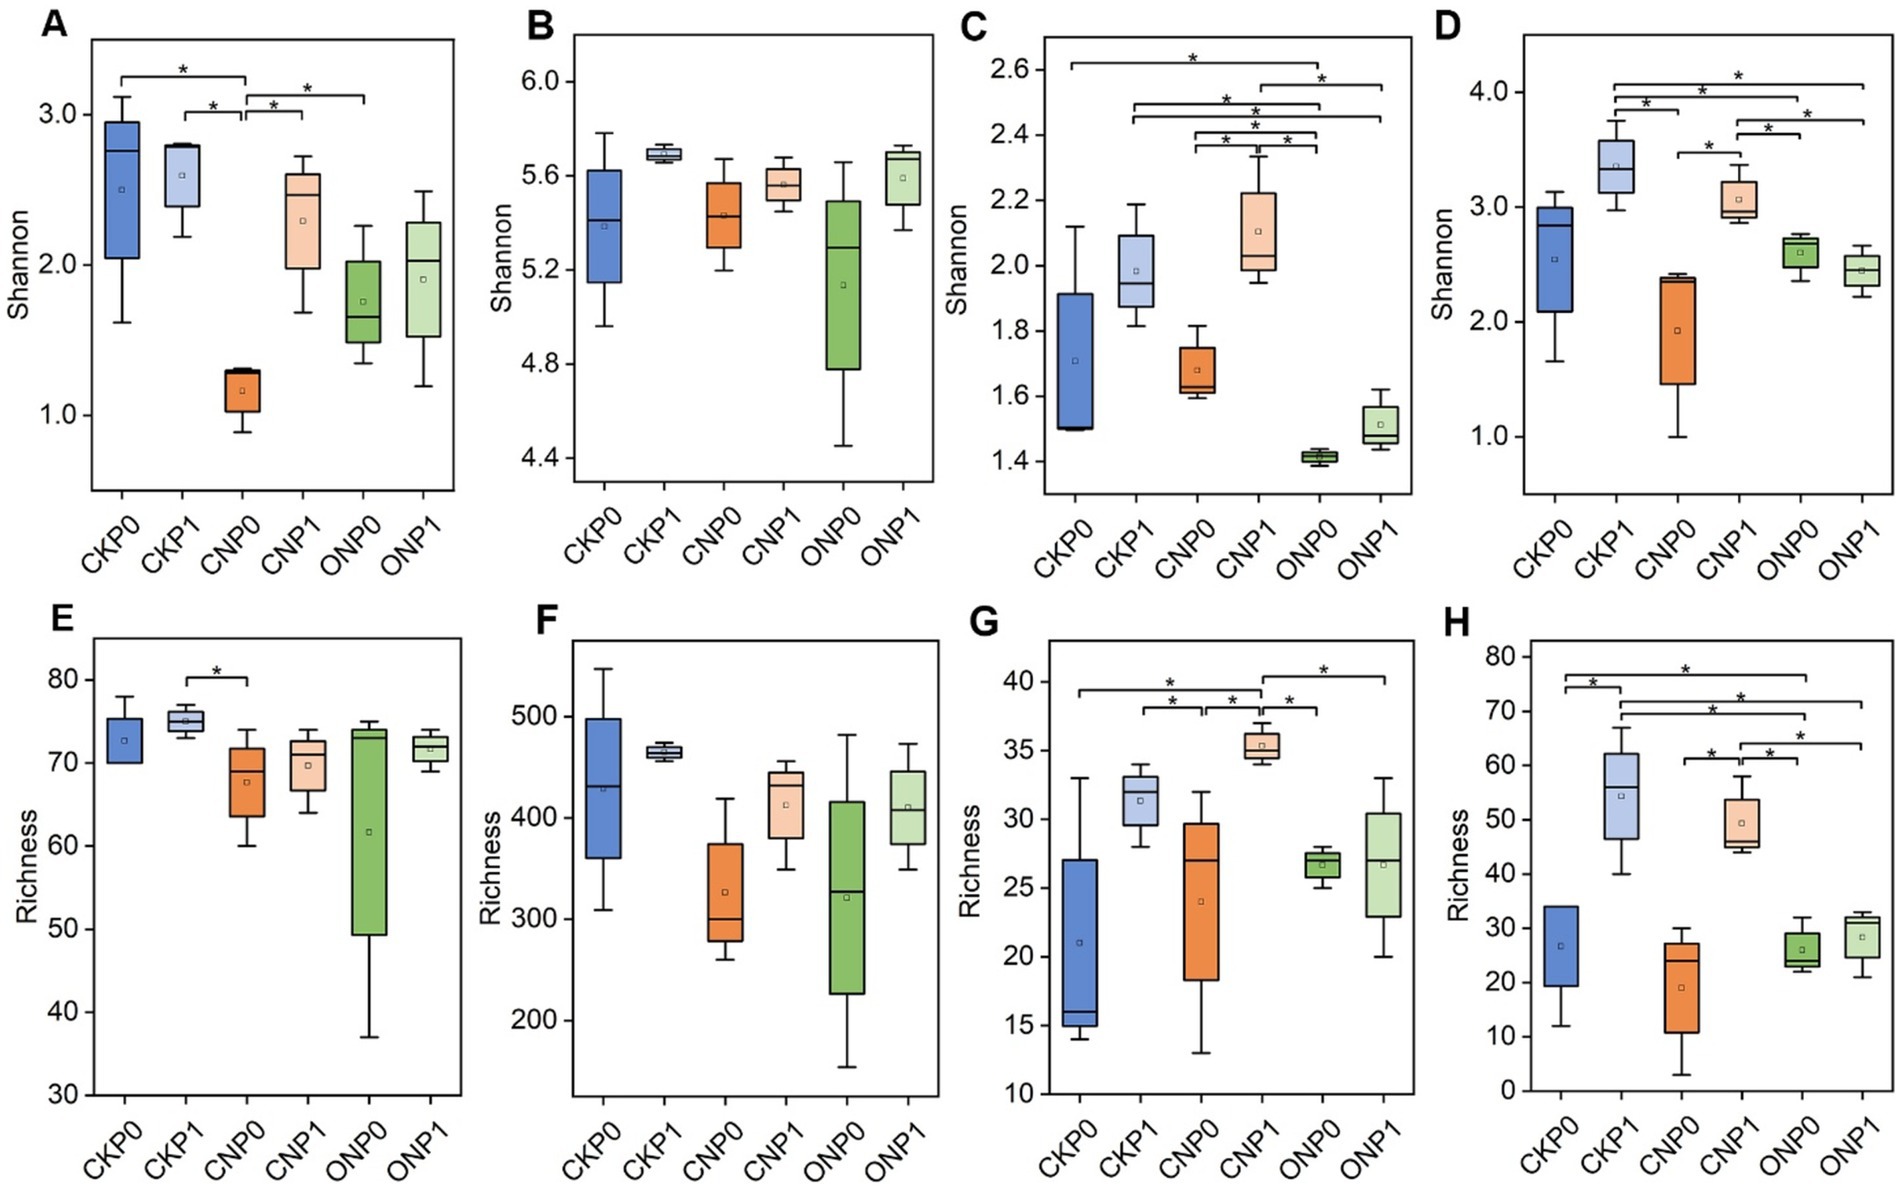
Figure 1. Shannon and richness indexes of root endophytic abundant bacteria (A,E), rare bacteria (B,F), abundant fungi (C,G), and rare fungi (D,H) under different treatments. CKP0, Unfertilized; CKP1, Chemical phosphorus applied; CNP0, Chemical nitrogen applied; CNP1, Chemical nitrogen plus phosphorus; ONP0, Organic manure supply nitrogen; ONP1, Organic manure supply nitrogen plus phosphorus. *p < 0.05, as tested by multiple comparisons using the Kruskal–Wallis test, and only significant differences are displayed. The treatment denotations are the same as those in Figure 1.
Root endophyte OTUs were classified into 10 bacterial and five fungal phyla, excluding unclassified sequences. The abundant bacterial subcommunity was predominantly Proteobacteria (2.81%–54.50%), whereas the rare bacterial subcommunity was also dominated by Proteobacteria (22.15%–36.75%) (Figures 2A,B). The relative abundance of Proteobacteria in the abundant bacterial subcommunity was significantly decreased by nitrogen application (CNP0 and ONP0) compared to CKP0 (p < 0.05; Supplementary Table S4). The relative abundance of Actinobacteriota, Chloroflexi, and Gemmatimonadota in rare bacterial subcommunity was significantly increased in ONP1, CNP1, and CNP1, respectively, compared to CKP0 (p < 0.05; Supplementary Table S4). The relative abundance of Acidobacteriota was significantly increased in CKP1, CNP0, and CNP1 compared to CKP0 (p < 0.05; Supplementary Table S4). The abundant fungal subcommunity was dominated by Ascomycota (0.8%–13.36%) (Figure 2C), while the rare fungal subcommunity was dominated by Ascomycota (25.23%–51.43%) and Basidiomycota (8.8%–29.63%) (Figure 2D). There was no significant difference in the relative abundance of endophytic fungal phyla among different treatments (p < 0.05; Supplementary Table S4). The NMDS analysis of Bray–Curtis distances revealed a distinct separation of all OTUs composition between treatments (beta-diversity). This revealed a clear separation between treatments of the bacterial and fungal subcommunities (Figures 2E–H). The ANOSIM analysis further indicated that the composition of bacterial subcommunity significantly varied with N levels, whereas the composition of the fungal subcommunity significantly varied with P levels rather than among different treatments (p ≤ 0.05; Supplementary Table S5).
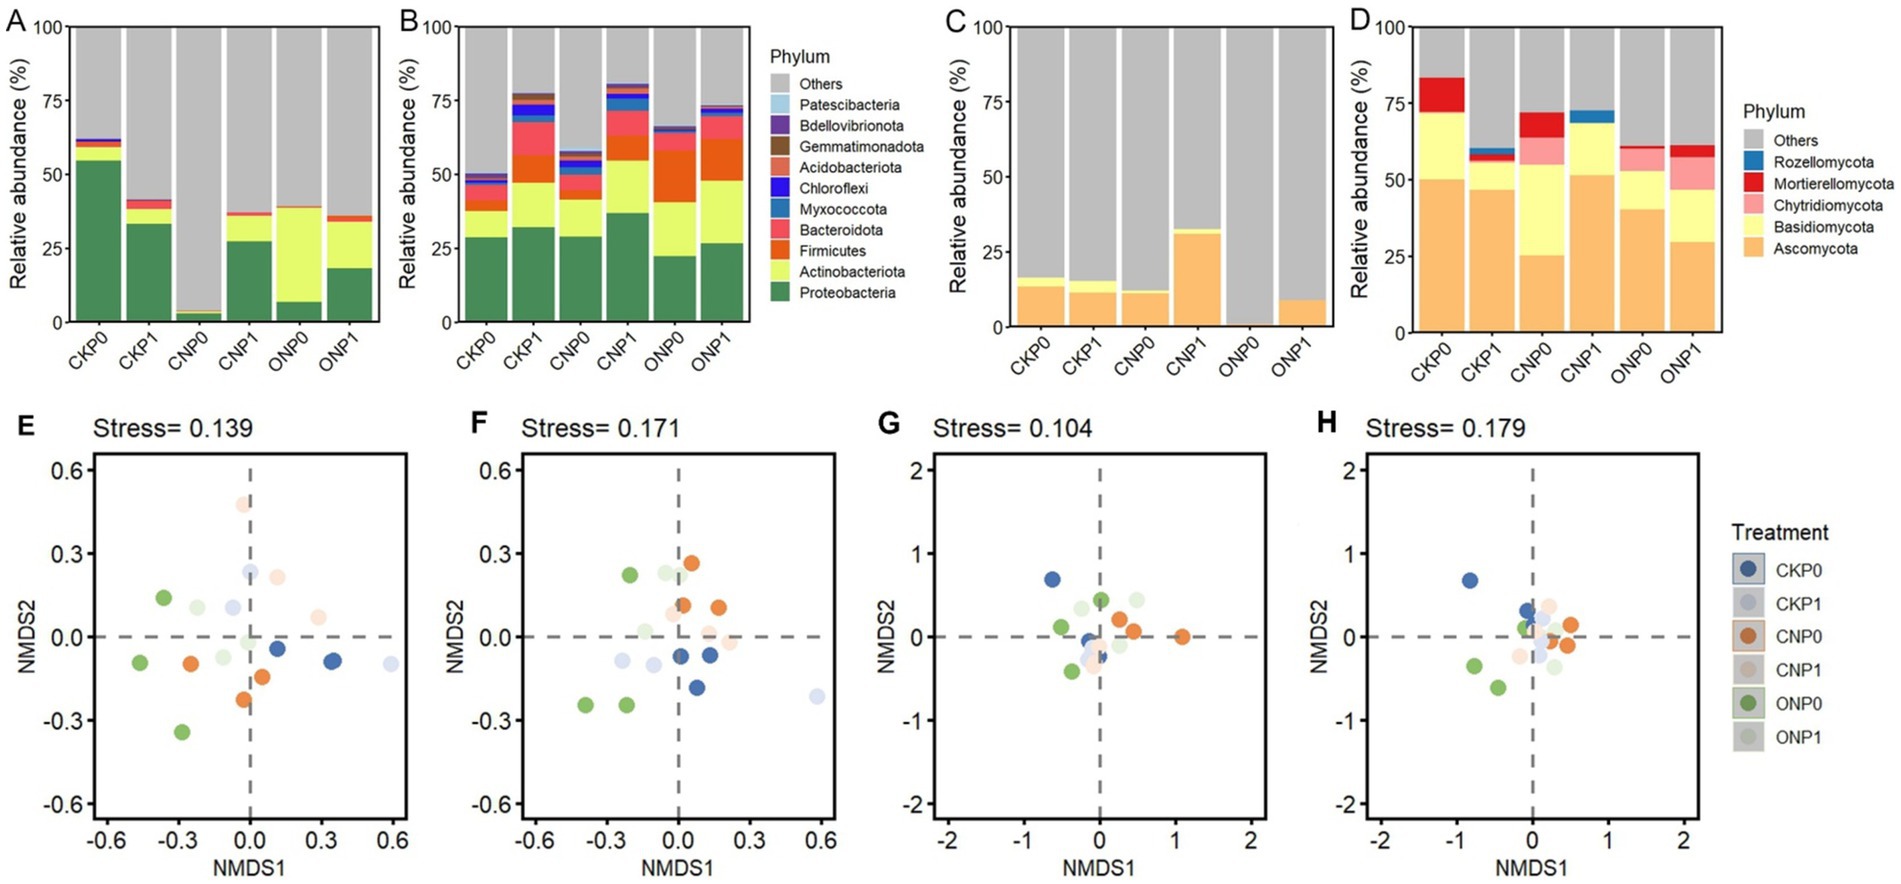
Figure 2. Subcommunity composition at the phylum level and non-metric multidimensional scaling (NMDS) plots of root endophytic abundant bacteria (A,E), rare bacteria (B,F), abundant fungi (C,G), and rare fungi (D,H) under different treatments. Unclassified bacterial and fungal OTUs were labeled as “Others.” The treatment denotations are the same as those in Figure 1.
3.3 Community assembly of root endophytic abundant and rare microbial subcommunitiesβ-nearest taxon index values were used to quantify the relative contributions of ecological processes in different fertilization treatments (Figures 3A–D). A significant discrepancy in βNTI values of rare fungal and abundant bacterial subcommunities was caused by different N and P levels, respectively (p ≤ 0.05). There was no significant discrepancy in βNTI of different microbial subcommunities under different treatments and were all between −2 and + 2. Furthermore, the null model analysis revealed that the ecological assembly of root endophytic abundant and rare subcommunities varied with different treatments. Phosphorus levels mainly governed the abundant bacterial subcommunity through dispersal limitation (23.42%–96.79%), which, and an undominated process (0%–76.58%), which gradually increased (p < 0.05; Figures 3A,E). Dispersal limitation (12.26%–50.22%) and undominated (39.82%–77.72%) processes mainly governed the rare bacterial subcommunity (Figure 3F). The abundant fungal subcommunity was entirely governed by stochastic processes, mainly shaped by the undominated process in CKP0, CNP0, and ONP0 and increase dispersal limitation process in P level (CKP1, CNP1, and ONP1) (Figure 3G). The rare fungal subcommunity was mainly governed by nitrogen levels through decreased dispersal limitation (13.73%–72.07%) and increased undominated process (24.82%–84.56%) (Figure 3H). In summary, the assembly of abundant bacterial, abundant fungal, and rare fungal subcommunities was governed by dispersal limitation and undominated processes, while stochastic processes dominated the rare bacterial subcommunity and gradually replaced deterministic processes completely under different treatments (Figure 3).
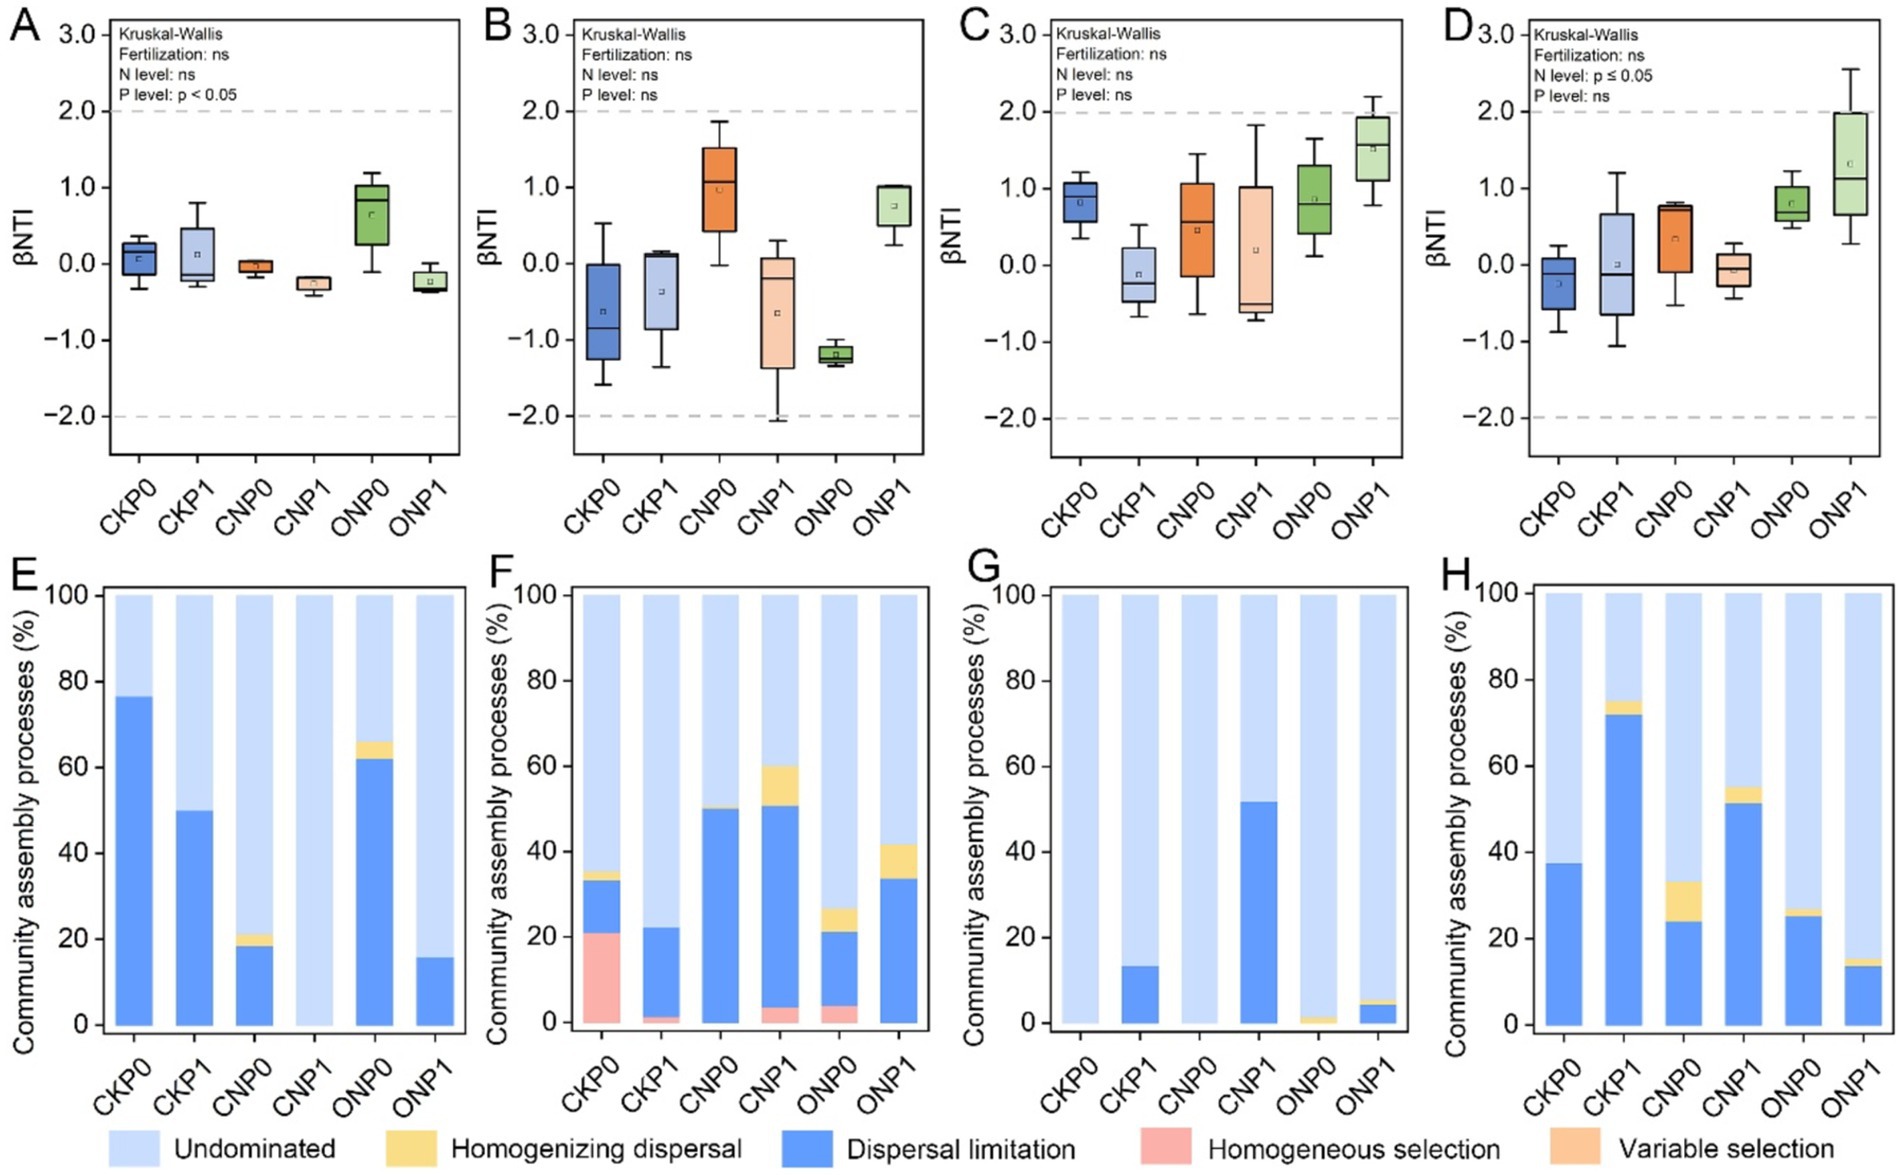
Figure 3. Root endophytic bacterial and fungal subcommunities assembly processes (based on βNTI and RCBray). βNTI of root endophytic abundant bacteria (A), rare bacteria (B), abundant fungi (C), and rare fungi (D) subcommunities. Proportions of deterministic and stochastic assembly processes in governing root endophytic abundant bacteria (E), rare bacteria (F), abundant fungi (G), and rare fungi (H) subcommunities under different treatments.
3.4 Keystone species and network topological properties of endophytic microbial subcommunitiesCo-occurrence networks under different treatments revealed that the endophytic rare subcommunities, with a higher number of nodes, played a more important role than abundant subcommunities (Figures 4A–F). Rare bacterial nodes accounted for 53.88% to 58.80%, whereas abundant bacterial nodes accounted for only 3.92% to 5.57%. Rare fungal nodes accounted for 4.02% to 7.50%, whereas abundant fungal nodes accounted for 2.10% to 3.03%. A co-occurrence network was also constructed for root endophytic abundant and rare subcommunities that conformed to the power-law distribution (Supplementary Figure S2). We observed that the numbers of nodes, edges, and average degree in the root endophytic microbial network decreased with nitrogen application (CNP0, CNP1, ONP0, and ONP1), while the modularity increased and the graph density decreased with phosphorus application (CKP1, CNP1, and ONP1) (Supplementary Figure S1). The observed potential interactions at root endophytes were predominantly positive, accounting for 78.12%–87.38% of the total linkages (Figure 4). The proportion of negative correlations in the root endophytic network of ONP1 was the highest (21.88%) compared to CKP0 (Figure 4F).
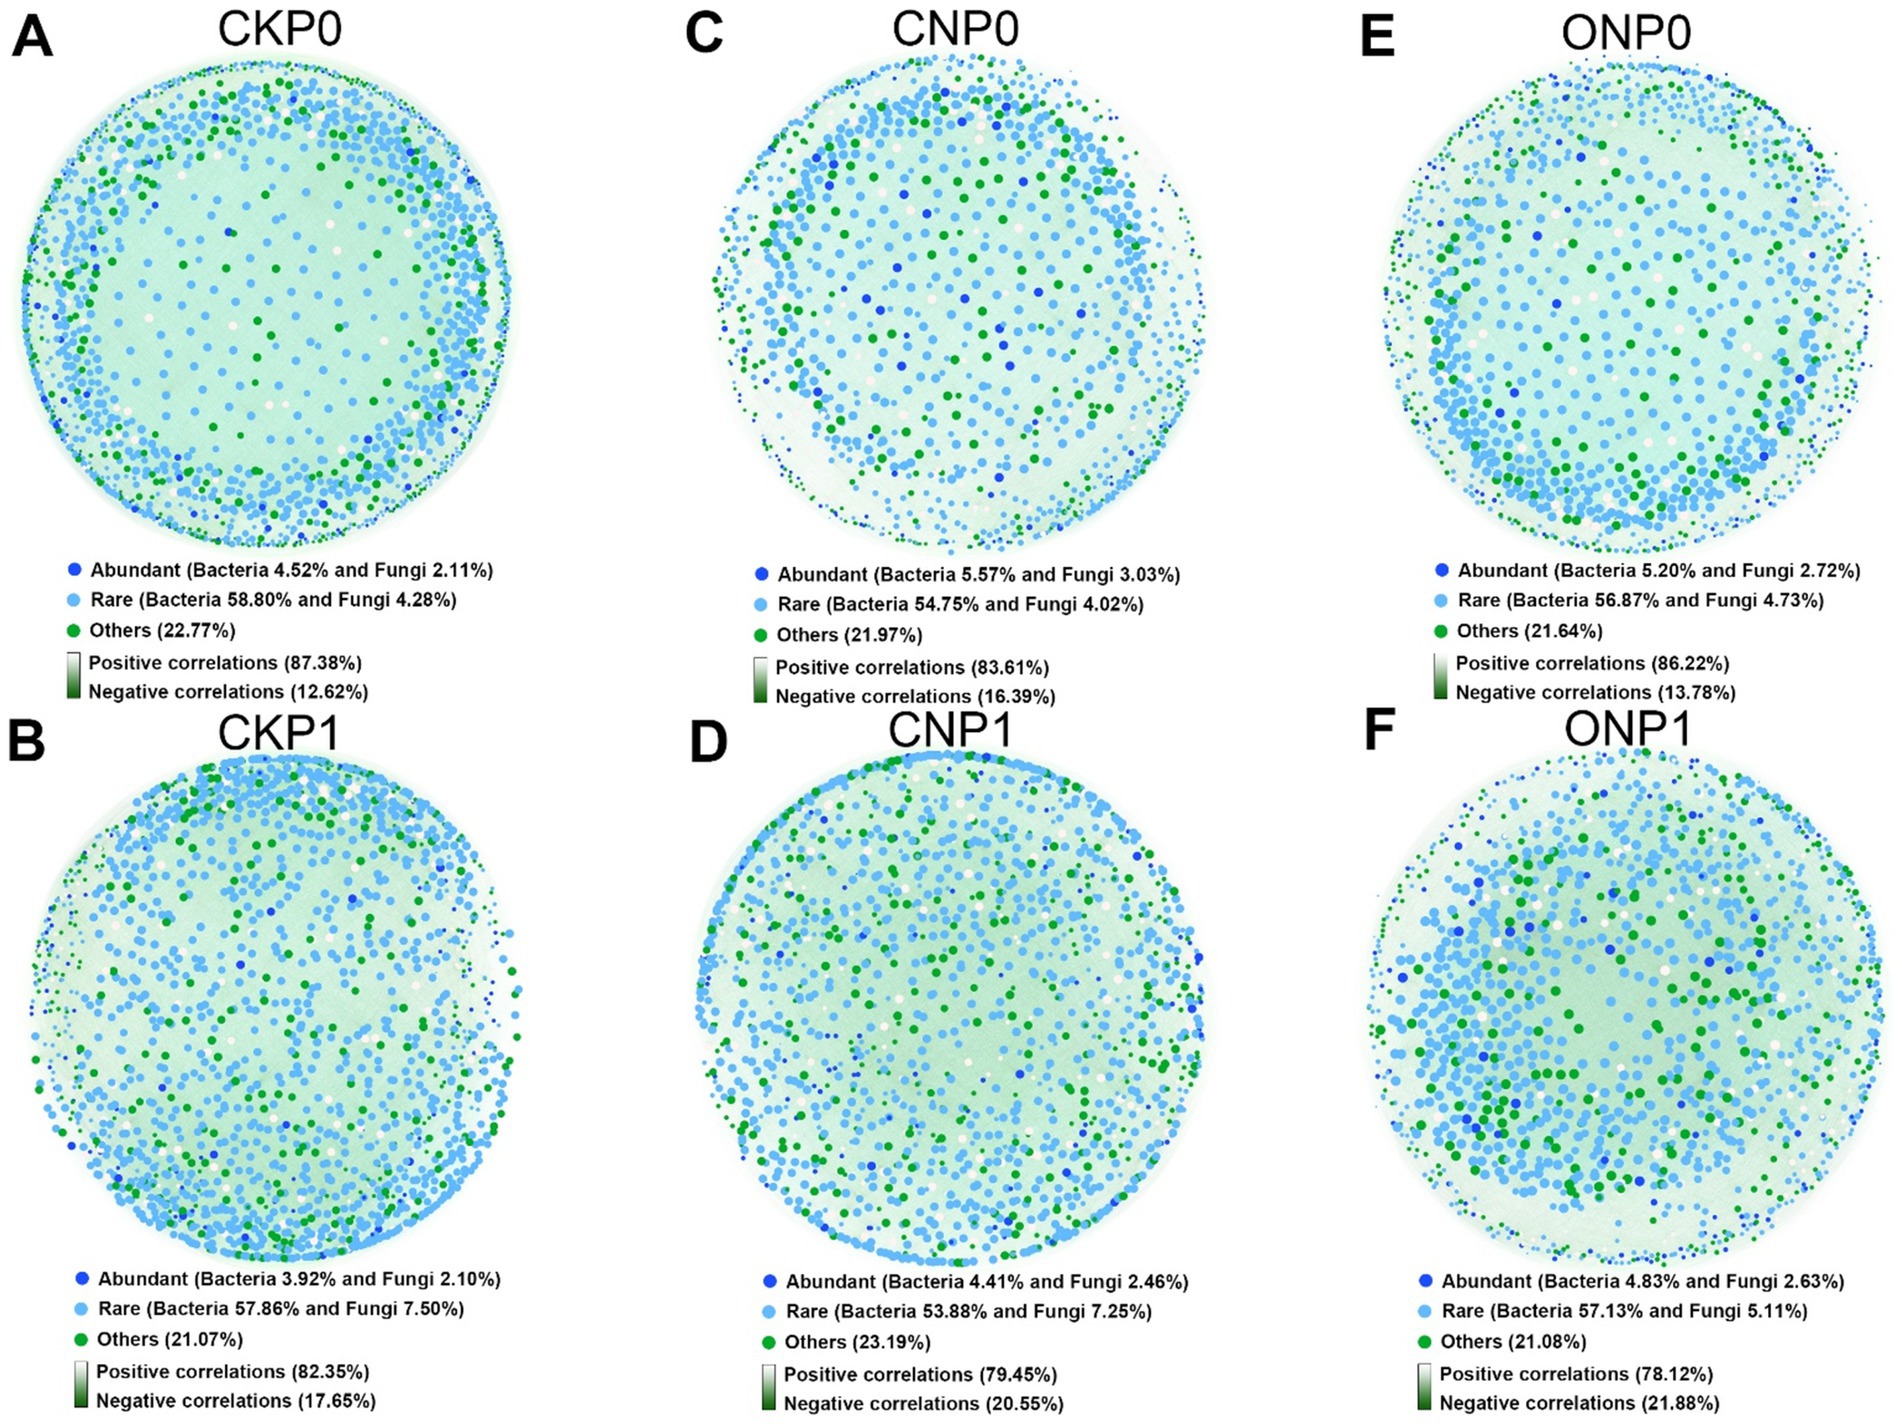
Figure 4. Co-occurrence networks of bacterial and fungal coexistence communities under different fertilizations (A–F). The networks were established by calculating correlations among abundant, rare, and other OTUs.
Nitrogen application reduced the modularity and average path length of the abundant bacterial subcommunity network, while increasing the clustering coefficient and average path length and reducing the average degree in the rare bacterial subcommunity network. Phosphorus application increased the modularity and average path length in the network of the abundant fungal subcommunity, while decreasing the clustering coefficient. In the rare fungal subcommunity, phosphorus application increased the clustering coefficient and average degree, but decreased the modularity and average path length (Supplementary Table S6). The topological roles of the individual subcommunity network nodes were shown in a Zi-Pi plot (Figure 5). Peripherals were completely occupied by total nodes in abundant bacterial and abundant fungal subcommunities (Figures 5A,C). We found a total of 63 keystone species in the root endophytic rare bacterial subcommunity network; one was identified as a module hub, while the remaining species served as connectors (Figure 5B). These keystone species play a significant role (2.45%) in the network, and they mainly belong to Proteobacteria, Actinobacteriota, Bacteroidota, Firmicutes, Myxococcota, Chloroflex, Acidobacteriota, and Gemmatimonadota (Supplementary Table S7). These phyla were highly enriched under ONP1, followed by CKP1. Two keystone species belonging to Ascomycota played a 0.85% role in the rare fungal subcommunity network (Figure 5D; Supplementary Table S7).

Figure 5. Distributions of network roles by analyzing module features, within-module connectivities (Zi) and among-module connectivities (Pi), in the endophytic abundant bacterial (A), rare bacterial (B), abundant fungal (C), and rare fungal (D) co-occurrence networks of root, respectively.
3.5 Specific subcommunity composition and taxa as predictors of yield under long-term fertilizationCompared with the CKP0, fertilization treatments significantly increased the yield except CKP1 (p < 0.05; Figure 6A). The random forest regression model was used to identify the structure of the root endophytic subcommunity, including abundant bacteria, rare bacteria, abundant fungi, and rare fungi that could predict the yield across different fertilization treatments (Figure 6B). The structure of abundant bacteria and rare bacteria significantly contribute to yield (p < 0.05; Figure 6B). Moreover, the structure of the abundant bacterial subcommunity explained 22.03% of yield variation, whereas the rare bacterial subcommunity accounted for 3.09% (Figure 6B). Additionally, the structures of bacterial subcommunities were positively related to AN content (p < 0.05; Figure 6B). On the contrary, abundant fungi and rare fungi were positively associated with soil phosphorus especially MLP (p < 0.01; Figure 6B), and both of them have no significant positive contribution to yield (Figure 6A). These four subcommunities, except the abundant subcommunity, were negatively correlated to soil pH (p < 0.05; Figure 6B). The random forest regression model further predicted the top 10 genera of the rare subcommunity (54.93%) had a greater impact than on yield variation compared to those in the abundant subcommunity (19.32%), indicating that they are more important drivers to yield variation (Figure 6). No key role genus of abundant subcommunity was identified from network, though top 10 abundant genus could predict the yield variation (Figure 6C; Supplementary Table S7). Three keystone species Arthrobacter, Microbacterium, and Sphingobium have been found in the rare microbial subcommunity. These species contribute to increased yield in response to soil nutrient changes and also serve as connectors in the network (Figure 6D; Supplementary Table S7).
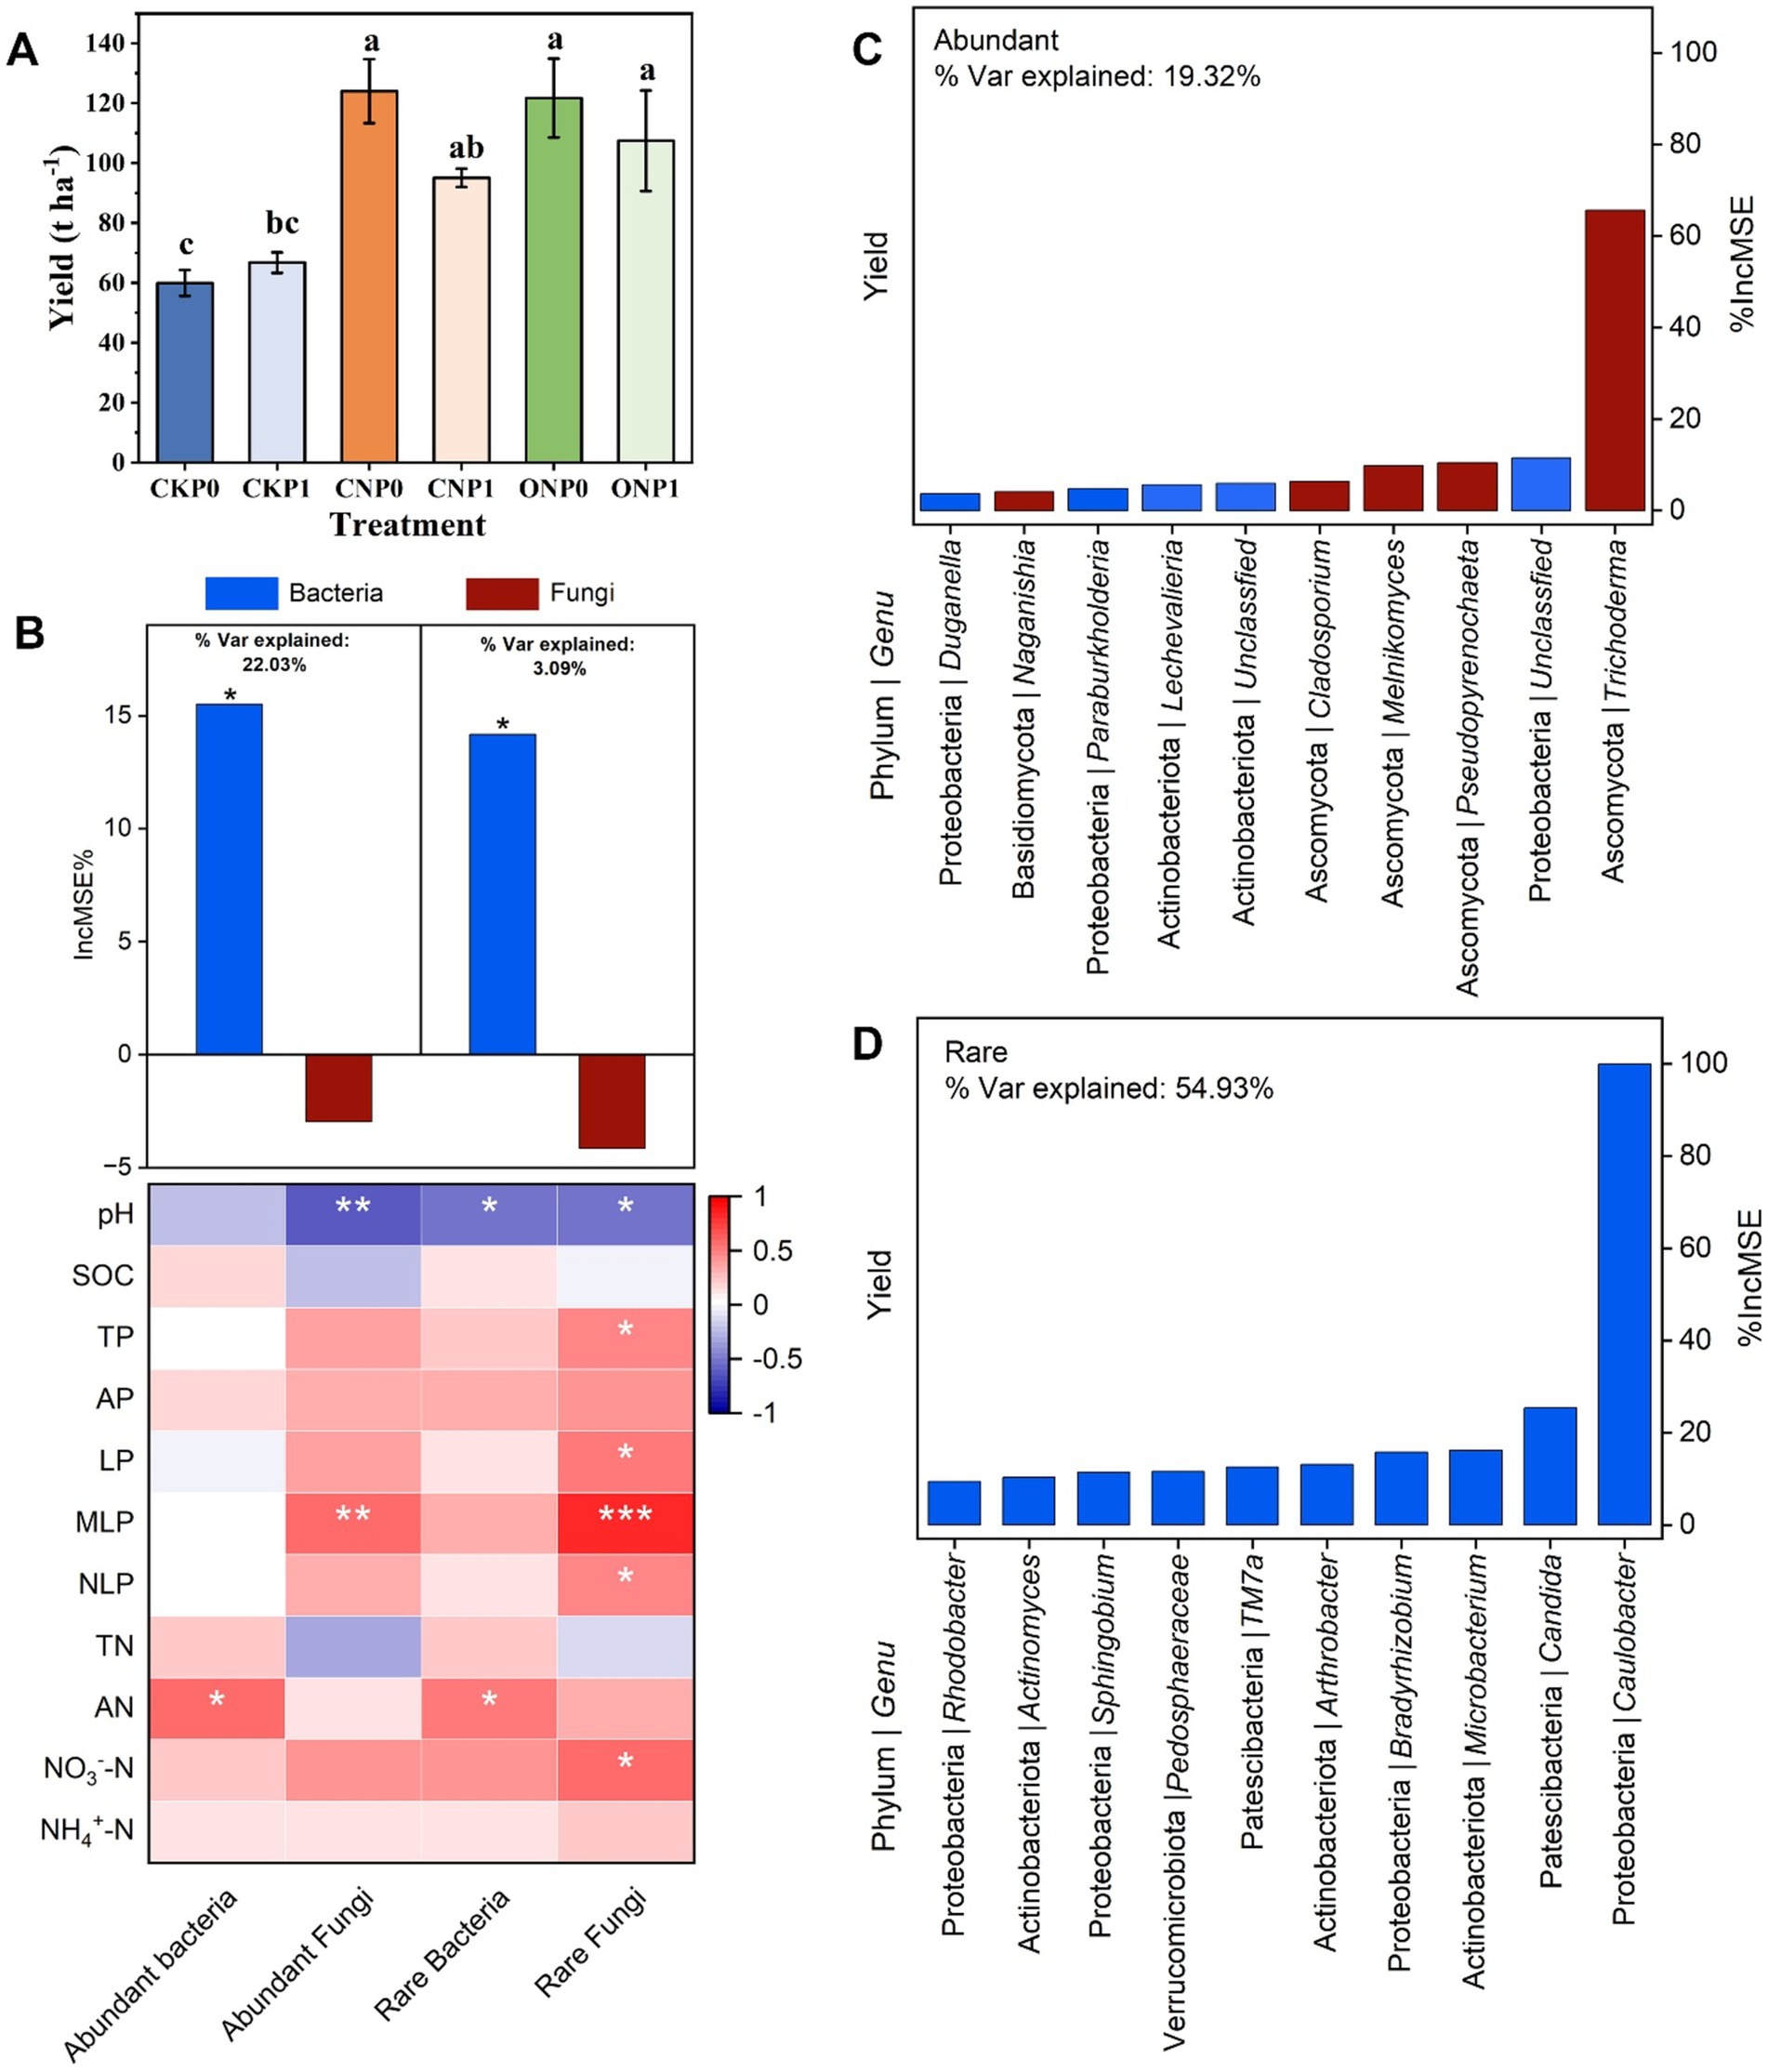
Figure 6. Changes in tomato yield (A). The random forest regression model shows the root endophytic subcommunity structures as drivers of yield. A correlation between the structure of microbial subcommunities and soil nutrients was identified using Spearman’s test (B). The random Forest regression model identifies the top 10 most important taxa of abundant (C) and rare (D) subcommunities at the genus level, along with their respective phylum, as key drivers of tomato yield. The bars illustrate the increase in mean squared error (%IncMSE) scores for the contribution of root endophytes at the genus level among six fertilization treatments, affecting the tomato yield. Significance levels are denoted with *p < 0.05, **p < 0.01, and ***p < 0.001.
Structural equation model was employed to quantify the correlations among key soil characters (AN, pH, and MLP) in response to amounts of N and P fertilizers, the most important root endophytic bacterial subcommunities, and yield (Figure 7). The soil AN, pH, and MLP explained much more variation of the β-diversity (r2 = 0.47) than α-diversity (r2 = 0.30) in abundant bacterial subcommunity, but much more variation of α-diversity (r2 = 0.54) than β-diversity (r2 = 0.38) in rare bacterial subcommunity. Soil AN had a positive direct and indirect effect by influencing the β-diversity of abundant and rare bacterial subcommunity on yield. It should be noted that the α-diversity of abundant and rare bacterial subcommunities showed no direct effect on yield. The contrasting results were observed for yield, being directly negatively affected by pH and MLP, while through the α-diversity of rare bacteria directly related to MLP (Figure 7A). The soil pH and MLP had a positive effect and AN had a negative effect on the α-diversity of abundant and rare subcommunities, but its effects were contrary on the β-diversity of abundant and rare bacterial subcommunities. The soil AN was found to have the largest standardized positive effect on yield, followed by the β-diversity of abundant and rare bacterial subcommunities, while the contribution of the abundant bacterial β-diversity was greater compared to that of the rare bacterial β-diversity (Figure 7B).
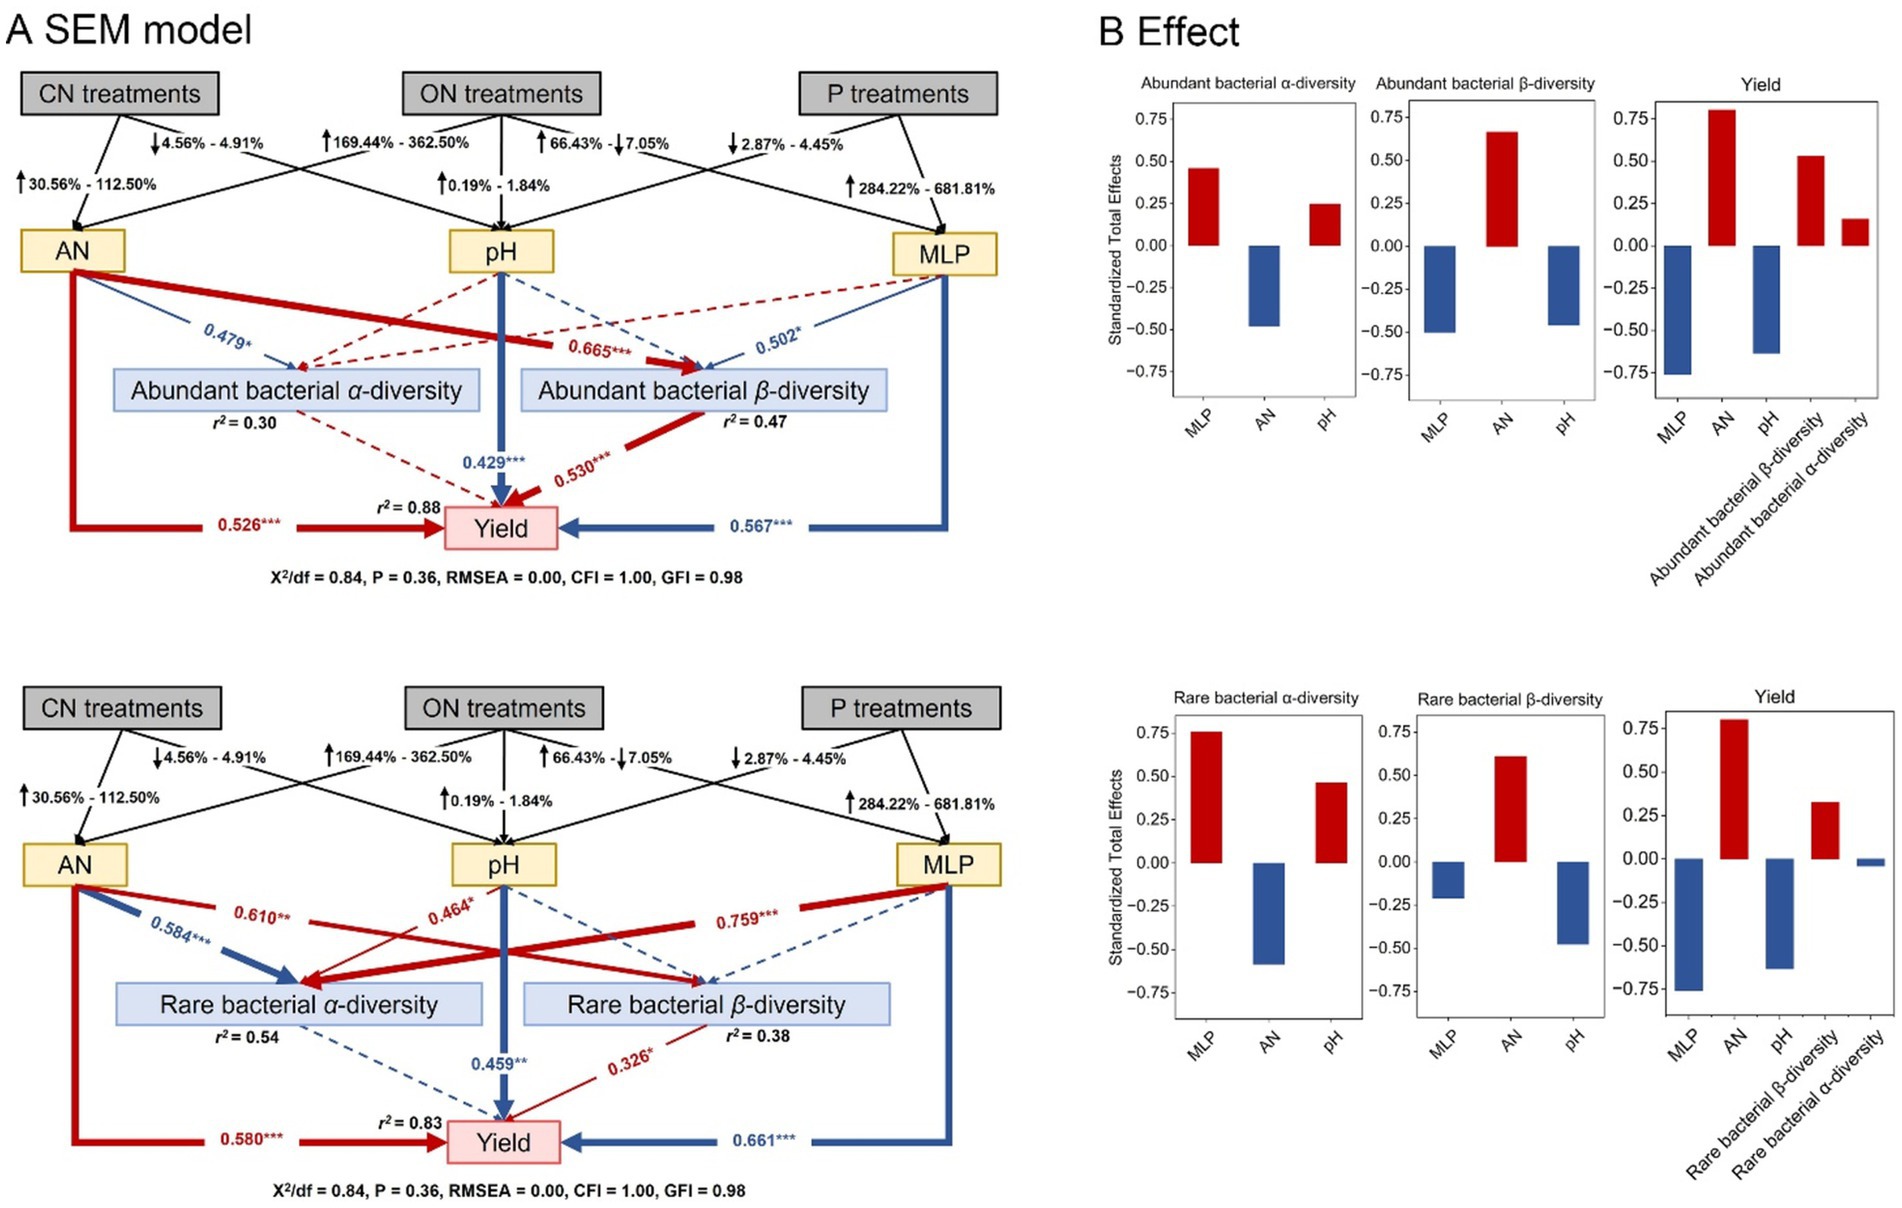
Figure 7. Structural equation model (SEM) illustrating how the root endophytic bacterial subcommunities influenced yield by responding to soil AN, pH, and MLP (A). The total standardized effects of these factors on yield, α-diversity (Shannon diversity), and β-diversity are shown (B). Red arrows, black arrows, and dashed arrows indicate the positive significant, negative significant, and nonsignificant relationships between different variables. The width of the arrows indicates the strength of the standardized path coefficient. Adjacent values near the arrows indicate path coefficients. r2 values indicate the proportion of variance explained by each variable. Significance levels are denoted with *p < 0.05, **p < 0.01, and ***p < 0.001.
4 Discussion 4.1 Long-term fertilization affected the construction processes in distribution characters of root endophytes subcommunitiesThe abundant endophytic bacterial and fungal subcommunities were prevalent in most fertilization treatments with an average relative abundance of 81.01% and 94.07%, respectively. Abundant species may occupy wider niches, competitively utilize more enriched resources, have high growth rates, and effectively adapt to the environment. All of these supported their persistence and their widespread distribution (Jiao and Lu, 2020; Liu et al., 2023a). In addition, the relative abundance of root endophytic rare bacterial and fungal subcommunities that contributed less to the total community abundance was unevenly distributed among different fertilization treatments. The different distribution patterns of root endophytic abundant and rare taxa may be attributed to their distinct life strategies. The rare subcommunities usually exhibited dormancy or low growth rates and competitiveness. Hence, root endophytic microbial subcommunities showed limitations but not extinction in nutrient-enriched environments caused by long-term fertilization (Jia et al., 2018; Jousset et al., 2017). Notably, the rare subcommunities had the highest abundance and diversity compared with abundant subcommunities, which supported the fact that the rare subcommunity was an important contributor to the microbial diversity (du et al., 2020; Li et al., 2021; Lynch and Neufeld, 2015). This trend may be attributed to the fact that a community has a limited capacity and excessive diversity was formed by species competition. Rare taxa can become abundant members of a community in response to favorable environmental conditions (Jia et al., 2022). Few rare species dominated the root samples in our study, but rare bacterial taxa were more susceptible to environmental heterogeneity and with ability to grow fast were affected by nutrient concentration increasing as conditionally rare taxa (Jia et al., 2022; Jiao et al., 2019a). This is possibly due to the selective pressure of resources in the rhizosphere soil environment driving the aggregation of root endophytic rare microbial communities (Liu et al., 2024). It is known that soil environment factors such as carbon, nitrogen, and phosphorus concentrations could across compartments affect root species abundance and interactions (Zhang et al., 2019). These findings suggest that the aggregation process of microbiome with different nutritional strategies can affect the diversity and abundance of endophytic microbial subcommunities (Li et al., 2021; Liu et al., 2023a). Similar evidence has been found in previous studies to explain this change (Dos Santos et al., 2022), where the alpha diversity of endophytic microorganisms increases with the application of fertilizers. However, the α-diversity of fungal subcommunities, especially the α-diversity of the rare fungal subcommunity, was mainly increased by the application of chemical nitrogen and phosphorus fertilizers in our study (p < 0.05). Similarly, we found that different N levels and P levels shaped complex rhizosphere soil nutrient heterogeneity that significantly affected the structure of root endophytic bacterial and fungal subcommunities (Ma et al., 2021; Ma et al., 2022b; Zhang et al., 2019). This may have mediated a richer diversity of the rare subcommunity and enhanced their involvement in nutrient cycling processes between environments (Liu et al., 2023a; Shu et al., 2021).
The microbial community assembly processes, which determine the presence and abundance of species, are generally divided into deterministic and stochastic processes (Feng et al., 2018; Jiao et al., 2019b). The null model suggested that the construction of root endophytic bacterial and fungal subcommunities are mainly dominated by stochastic processes especially dispersal limitation (Zhong et al., 2022). More importantly, the assembly process of abundant and rare subcommunities of endophytic bacteria and fungi exhibited different trade-off patterns, reflecting varying relative contributions in response to changes in nitrogen and phosphorus levels (Xing et al., 2023). The proportion of stochastic processes in microbial community assembly can also increase through the functional redundancy generated by biological interactions and spatial and environmental processes (Li and Gao, 2023). Under different fertilization treatments of nitrogen and phosphorus levels, rhizosphere environmental filtration emphasizes the stochastic process of dispersal limitation, which may be involved in determining the development of different sub community systems, which was a very novel finding. Previous studies have revealed that determinism seems to be related to low nutrient levels, and stochasticity increases with nutrient levels (Chase, 2010; Zhou et al., 2014). Therefore, the current nutritional strategy for microbial community assembly processes may be more important than the priority effects shaped by host selection (Li and Gao, 2023). In particular, as the subcommunity rarity increases, dispersal limitation was more conducive to driving the assembly and construction of root endophytic bacterial and fungal subcommunities in enough nitrogen and phosphorus environments, respectively. This validation showed that rare microbial subcommunities were not a random taxonomic cluster; instead, most of these rare subcommunities show restricted distribution or migratory diffusion (Cui et al., 2023; Liu et al., 2015; Long and Yao, 2020). Compared to rare taxa, more individuals in abundant taxa were likely to be involved in dispersal limitation (Liu et al., 2015), such as abundant bacterial subcommunities in our study. From this perspective, abundant taxa are likely to adopt growth yield or resource acquisition strategies that enable them to outcompete other microorganisms for broader niche space and nutrients (Cui et al., 2023; Delgado-Baquerizo et al., 2018; Dong et al., 2021; Jiao and Lu, 2020; Ma et al., 2022a). Consequently, we concluded that long-term fertilization indeed affected the specific niche differentiation of phosphorus-sensitive fungal and nitrogen-sensitive root endophytic bacterial, both abundant and rare subcommunities (Hamonts et al., 2018; Leach et al., 2017; Niu et al., 2017).
The rare fungal subcommunity exhibited a more intense and significant response to phosphorus than the abundant fungal subcommunity, possibly due to the long-life cycle, low community turnover rate, and differences in metabolic activity and diffusion ability of fungi (Jiao and Lu, 2020; Omomowo and Babalola, 2019). Higher nutrient levels increased the importance of stochastic processes (Chase, 2010; Chen et al., 2020), providing insights into the assembly patterns of root endophytic fungal subcommunities promoted by phosphorus. Nitrogen application maintained the control of the dispersal limitation on the enrichment of both abundant and rare bacterial subcommunities, significantly impacting their structure. Previous studies found that short-term high nitrogen levels have a greater effect on the interactions among endophytic fungal communities in maize than on endophytic bacteria (Bai et al., 2022). We found community assembly processes and ANOSIM analysis suggested that endophytic bacteria respond more strongly to nitrogen fertilizer than endophytic fungi. This difference may be partly because nutrient supplementation reduces the competitive advantage of fungi over bacteria (Michalska-Smith et al., 2022) and increases bacterial abundance (Wu et al., 2019), especially in rare bacterial subcommunity. On the other hand, bacteria rely more on fixed sources of nitrogen and carbon than fungi (Schmidt et al., 2014), and organic fertilizers also compensate for the relative lack of carbon when achieving nitrogen supply in this process. These indicated that these subcommunities were formed by more complex assembly processes, especially rare subcommunities, which may also be important metabolic strategies for microbial cells to cope with environmental pressures and be less susceptible to deterministic processes (Fujii et al., 2012; Lennon and Jones, 2011; Nemergut Diana et al., 2013). It is worth noting that stochastic process plays more importance in community assembly, leading to higher β-diversity of microorganisms and higher yield (Chase, 2010). The altered community aggregation characteristics of different subcommunities of root endophytic bacteria and fungi have improved the overall adaptability of microbial communities to their environment, potentially enhancing our understanding of ecosystem sustainability through various means. Rare subcommunities may serve as sensitive biological indicators for regulating their assembly mechanisms and reflecting environmental change risks, closely related to the composition of the entire endophytic microbial community. They may also be a key factor in enhancing the resistance of microbial networks through functional redundancy (Li et al., 2021; Lynch and Neufeld, 2015).
4.2 Co-occurrence network of root endophytes subcommunities and keystone species response to long-term fertilizationNetwork analysis has been identified as a powerful tool for exploring the role of microbial symbiotic interactions in coping with environmental stress (Michalska-Smith et al., 2022; Shu et al., 2021). Fertilizations have affected the network structural characteristics, providing insights into how symbiotic patterns of microbe form different endophytic microbial communities (Liu et al., 2023a) and helping to identify potential keystone taxa in network (Wu et al., 2022; Zhong et al., 2022). Our finding indicated that the frequency, intensity, and distribution patterns of OTU interactions within subcommunities of root endophytic bacteria and fungi vary in response to different fertilization treatments, particularly changed with nitrogen and phosphorus levels. These findings are consistent with previous studies, showing that the cross soil and plant compartments of nutrient concentrations significantly altered overall community dynamics by affecting niche differentiation and colonization of root endophytic bacteria and fungi (Michalska-Smith et al., 2022; Sun et al., 2022; Xu et al., 2022). This niche dispersal selectively recruits microbial subcommunities and formed stable co
留言 (0)