
記住我


A systematic literature review (SLR) was performed to identify all relevant publications, including RCTs and single-arm trials, related to the clinical efficacy and safety of first-line treatments for advanced, unresectable, and/or metastatic HCC. The Ovid platform was used to search Embase, MEDLINE, and the Cochrane Central Register of Controlled Trials (CENTRAL) on July 5, 2022. The pre-specified population, intervention, comparator, outcomes, and study design (PICOS) elements used to assess study eligibility are presented in Table S1 in the electronic supplementary materials (Supplement 1). The SLR was performed following best practice guidelines from the Cochrane Collaboration, Preferred Reporting Items for Systematic Reviews and Meta-Analyses (PRISMA), and the Centre for Reviews and Dissemination (CRD) [17,18,19]. Risk of bias was assessed using the CRD 7-item checklist for RCTs [20].
The SLR identified 7853 citations. After removing duplicates, titles and abstracts of remaining citations were reviewed, of which 607 were included for the next stage of review. After evaluating the full-text articles, 78 were included and 529 articles were excluded. The supplementary searches of grey literature materials identified an additional 42 citations for inclusion. A total of 120 citations corresponding to 18 unique trials (12 RCTs, 4 non-randomized multi-arm trials, and 2 single-arm trials) were included in the SLR.
Hand searching was also conducted to identify more recent comparator studies (November 2022) from which a further two relevant RCTs were identified. See Figure S1 in the electronic supplementary material (Supplement 2) for the PRISMA flow.
NMA Evidence BaseThe evidence base considered for inclusion in the NMA consisted of the 12 RCTs identified from the SLR (including REFLECT) as well as single-arm data for lenvatinib monotherapy from LEAP-002 and two comparator studies, which were identified through hand searching and published top-line results after the SLR search dates: RATIONALE-301 and SHR-1210-III-310, both published in September 2022 [21, 22]. Therefore, 15 RCTs were considered for inclusion in the NMA.
Identified studies were required to meet additional eligibility criteria to be included in the NMA. Four RCTs from the SLR were excluded from the NMA evidence base as they reported outcomes for doxorubicin (monotherapy or combination) and one RCT reporting outcomes for nivolumab was also excluded as these treatments are not licensed in first-line uHCC. Thus, the feasibility assessment determined that ten studies were suitable for inclusion in the NMA. This evidence base included one RCT for tislelizumab, which was considered an upcoming comparator of interest at the time the feasibility assessment was conducted, having been approved by the China National Medical Products Administration (NMPA) in June 2021 for second- or third-line treatment [23]. Therefore, tislelizumab is included in the NMA; however, the authors note that Food and Drug Administration (FDA) filing has been abandoned (as of July 2023) and so tislelizumab is unlikely to be a relevant comparator in the future [24]. Patient-level data were also available from REFLECT and LEAP-002, which supplemented this research.
Study Heterogeneity AssessmentHeterogeneity across the ten studies was assessed based on treatment, trial design, inclusion/exclusion criteria, baseline characteristics, and outcome availability. Eight studies were conducted in multiple centres globally; however, Asia-Pacific and Kudo 2011 were conducted in three and two centres in Asia alone, respectively. Six studies were open label, three studies were double blind, and Kudo 2011 was triple blind. All studies were Phase 3, apart from Kelley et al., 2021, which was Phase 1/2. Across the ten studies, where more than one study reported data for the same treatment (e.g. sorafenib), this treatment was administered at the same dose, frequency, and through the same route.
All studies enrolled adult patients ≥ 18 years old except for Kelley et al., 2021, which was conducted in Japan and required patients to be ≥ 20 years old. Across the studies, patients had a diagnosis of HCC confirmed by radiology, histology, or cytology, or was not specified. Most studies required patients to have an Eastern Cooperative Oncology Group performance status (ECOG PS) 0 or 1, whereas Asia-Pacific and SHARP enrolled patients with ECOG PS 0–2. All studies enrolled patients with a Child Pugh Score of A; however, Barcelona Clinic Liver Cancer (BCLC) stage was only reported as an inclusion criteria in five studies (studies enrolled patients with Stage B or C).
One RCT (Kelley et al., 2021 [25]) was excluded from the base case NMA and included in a sensitivity analysis because of the differences in trial design and imbalances in baseline characteristics compared with the other studies. Furthermore, this was a Phase 1/2 study, whereas all other studies were Phase 3. Kelley et al., 2021, also did not report HRs for OS or PFS, although Kaplan-Meier (KM) curves were presented.
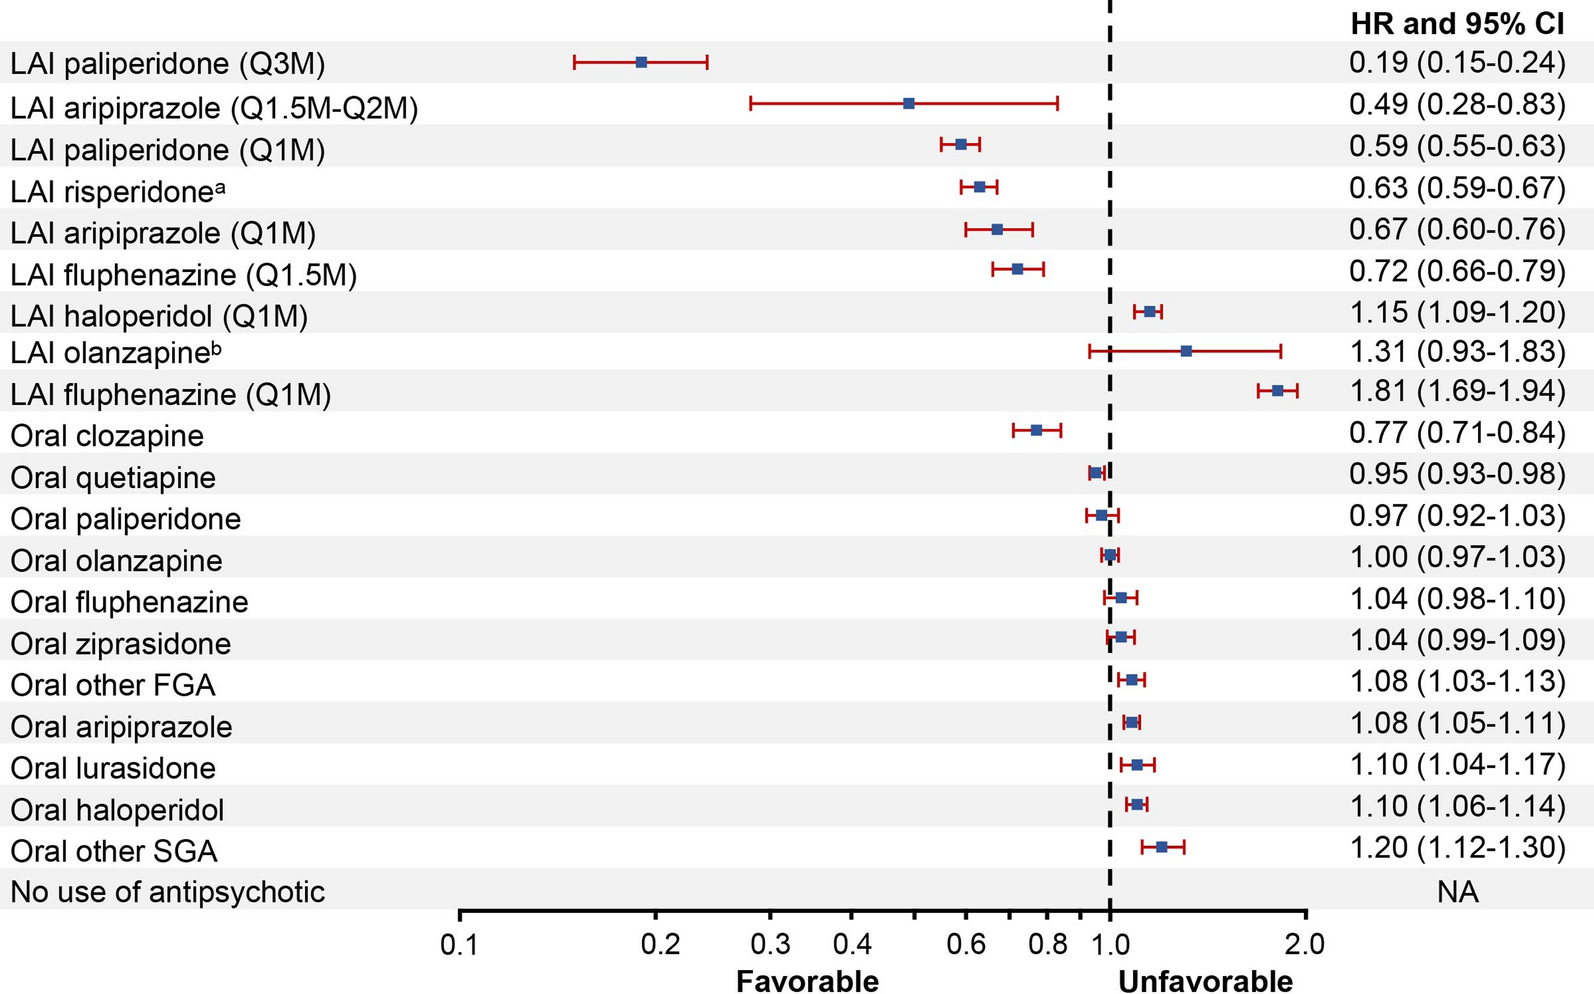
Nine RCTs (including the single-arm data from LEAP-002) reported treatments of interest, forming a connected treatment network, and were included in the NMA base case, whilst ten studies were included in a sensitivity analysis (Fig. 1). All studies, except Kelley et al., 2021, included a sorafenib treatment arm (for LEAP-002 this was a pseudo-control arm as described below) and this was the common comparator, connecting the network of treatments.
Fig. 1
Network diagram for base case and sensitivity analysis. Dotted line represents IPTW method to connect the lenvatinib arm in LEAP-002 to the network. BSC best supportive care, IPTW inverse probability of treatment weighting, SA sensitivity analysis
Treatment doses included in the NMA were lenvatinib 8 mg (body weight [BW] < 60 kg) or 12 mg (BW ≥ 60 kg); sorafenib 400 mg; durvalumab 1500 mg; tislelizumab 200 mg; camrelizumab 200 mg plus apatinib 250 mg; tremelimumab 300 mg plus durvalumab 1500 mg; atezolizumab 1200 mg plus bevacizumab 15 mg/kg BW.
See Supplements 3–7 of the electronic supplementary material for a summary of treatments (Table S2), trial design (Table S3), inclusion/exclusion criteria (Table S4 and Table S5), baseline characteristics (Table S6–8) and definitions of survival outcomes in the NMA studies (Table S9).
Propensity Score AnalysisThe most up-to-date trial data for lenvatinib in first-line HCC were available from the LEAP-002 trial; however, the comparator arm (lenvatinib plus pembrolizumab) was not of interest for the NMA and did not enable the lenvatinib monotherapy data to be usefully connected with the network of relevant comparators. Therefore, propensity score analysis was utilized to derive relative treatment effect estimates for lenvatinib vs sorafenib using individual patient-level data (IPD) from LEAP-002 and REFLECT to connect the LEAP-002 lenvatinib arm with the other first-line comparator treatments in the network.
Propensity methods are a population-adjustment method that allow the treatment effect to be calculated between lenvatinib and sorafenib in the absence of randomization, controlling for differences in the characteristics of patients receiving the two treatments [26]. These methods rely on the availability of IPD for relevant outcomes of interest, which for this analysis were OS and PFS, from the studies being compared (LEAP-002 and REFLECT), as well as relevant baseline characteristics.
Inverse probability of treatment weighting (IPTW) was chosen for the current analyses, combined with covariate outcome regression estimation. This method assigns weights to patients based on the inverse of their probability of receiving lenvatinib, which is derived using their propensity score. The benefits of using the propensity score to weight patients, rather than matching them based on their propensity scores, is that sample size is preserved from the treated population, and the amount of information used by weighting all patients from the comparator population is maximized. By combining the IPTW approach with regression analysis, we aim to reduce the risk of bias due to suboptimal specification of either of the methods. A logistic regression model was used, in which treatment assignment (a binary dependent variable with value 1 if the patient received lenvatinib and value 0 if the patient received sorafenib) was regressed upon patient baseline characteristics (independent variables). The regression model included variables that were related to outcome (prognostic factors), measured before assignment to treatment. Care was taken not to include variables that could be affected by the treatment or variables that predict treatment assignment but are independent of the outcome. Patients were excluded from the weighting if they did not report all baseline characteristics used in the IPTW with regression (this represented only 0.44% of all patients across REFLECT and the lenvatinib arm from LEAP-002). Therefore, two lenvatinib patients from LEAP-002, one lenvatinib patient from REFLECT, and three sorafenib patients from REFLECT were excluded from the weighting.
The base case IPTW method weighted the lenvatinib arms from LEAP-002 and REFLECT to match the sorafenib arm of REFLECT. In the base case, the pooled lenvatinib arms were considered as a single treatment node when deriving the relative treatment effect. The weighting in the base case accounted not only for differences between characteristics for the patients receiving lenvatinib from LEAP-002 and those in REFLECT but also imbalances noted within the original REFLECT dataset between the lenvatinib and sorafenib arms, for example, baseline alpha-fetoprotein (AFP) [16]. The scenario analysis IPTW method weighted the lenvatinib arm from LEAP-002 to match the sorafenib arm of REFLECT, not accounting for the lenvatinib arm in REFLECT in the IPTW process. The two lenvatinib arms were considered separately when deriving the relative effects vs sorafenib, with the published adjusted Briggs et al. [16] HR estimate used for the REFLECT OS estimate. For the time-to-event outcomes, PFS and OS, the HRs (and 95% CI) for lenvatinib vs sorafenib were then derived using these weights in a Cox regression model with the matching variables also as additional regression parameters, called a doubly robust method. We will refer to this doubly robust approach as simply “IPTW” in the text that follows. See Supplement 8 in the electronic supplementary material for further details on the derivation of the IPTW weights.
CovariatesThe variables used in the weighting were those identified as prognostic factors for OS in the REFLECT study (Briggs et al., 2020 [16]). The variables included AFP > 200 ng/ml, Child-Pugh score, extrahepatic spread (EHS), liver disease involvement, macroscopic portal vein invasion (MPVI), hepatitis B virus (HBV), bone disease involvement, lung disease involvement, and other disease involvement. Although it is acknowledged that AFP 400 ng/ml is now the more widely accepted cutoff [27], we used AFP > 200 ng/ml to align with the original Briggs et al. analyses, as this was demonstrated to be a relevant cutoff for the REFLECT data [16].
NMA MethodologyFollowing the IPTW calculations, the re-estimated HRs for lenvatinib vs sorafenib were included in a Bayesian NMA along with all the other RCT data from the connected network, using standard methods for clinical data synthesis [28,29,30,31,32,33,34], with a Markov Chain Monte Carlo (MCMC) algorithm implemented in WinBUGS [35]. Network meta-analyses for OS and PFS were performed as per the National Institute for Health and Care Excellence (NICE) Decision Support Unit Technical Support Document (TSD) 2 [28] on the log-hazard ratio (logHR) scale in the treatment effect model, with a linear regression structure using a normal likelihood with identity link. The approach to incorporate both the two- and three-arm studies was implemented as proposed by Woods et al. [36].
Fixed effect (FE) and random effect (RE) models were conducted, with a burn-in of 50,000 iterations, followed by 10,000 samples per chain (3 chains). For the time-to-event outcomes OS and PFS, the output is an HR and the associated 95% credible interval (CrI), which indicates the range between the 2.5th and 97.5th percentiles and is the equivalent of a 95% CI in frequentist analyses. An HR value of 1.0 indicates equal survival benefits for lenvatinib vs comparator. Due to data sparsity, the FE models offered a better model fit than the RE models (results not shown as the 95% CrIs were implausibly wide).
The treatments were ranked in order of most to least survival benefit in the NMA. A numeric presentation of the overall treatment ranking, the Surface Under the Cumulative RAnking curves (SUCRA), is also presented. A SUCRA of 100% indicates that the treatment is always in the top rank (performs better than all other treatments), whereas a SUCRA of 0% indicates that a treatment always ranks last.
For the sensitivity analysis including the Kelley et al. 2021 trial [25], digitizing software, Engauge Digitizer version 12.1, was used to extract the data from the KM curves for each outcome separately. Pseudo IPDs were reconstructed from the extracted survival data using the algorithm published by Guyot et al. 2012 [37]. From the pseudo IPD, a Cox model was used to derive the HR and standard error to be used in the NMA for tremelimumab + durvalumab vs durvalumab.
Ethical ApprovalThis analysis is based on previously conducted studies and does not contain any new studies with human participants or animals performed by any of the authors.
留言 (0)