The locus coeruleus (LC) is a small nucleus located in the pons. Acting as the principal source of noradrenaline (NA) in the central nervous system (Szabadi, 2013), it is associated with various cognitive functions, including attention (Janitzky et al., 2015; Lapiz and Morilak, 2006; Spencer and Berridge, 2019), arousal (Berridge et al., 2012), and stress response (Valentino and Van Bockstaele, 2008). Furthermore, a potential trophic influence of the LC on brain structure has been of interest at least since the review by Foote et al. (1983) and often encountered in the literature when listing the functions of LC (Edeline et al., 2011; Marien et al., 2004; Poe et al., 2020). LC’s role in this area is often described using the blanket term “trophic support” which covers a variety of mechanisms. More specifically, studies suggest LC-NA to influence neurodevelopment (Fauser et al., 2020), -plasticity (Hagena et al., 2016), -protection (Yao et al., 2015), and maintenance (Giorgi et al., 2020). Nevertheless, the literature does not draw a clear picture of the role of the LC in these processes.
Initial studies of LC’s involvement in neurodevelopment hinted an influence on the early postnatal ontogenesis of the neocortex in rodents (Maeda et al., 1974) and the synaptogenesis in later developmental stages (Sanders, 2016). However, other studies using oxidopamine (6-OHDA) in newborn rats found no effect on the development of the visual cortex (Ebersole et al., 1981) nor the neocortex (Wendlandt et al., 1977). Conversely, increased synaptic density in the rat visual cortex after neonatal 6-OHDA treatment has been reported Parnavelas and Blue (1982), indicating a suppressive effect of NA on synaptogenesis. In line with this, NA appears to inhibit cell proliferation and differentiation within the periventricular regions during brain development (Fauser et al., 2020) through β-adrenergic receptor signaling (Weselek et al., 2020). However, NA also has the ability to promote neurogenesis in the hippocampal subgranular zone (Weselek et al., 2020). Therefore, existing studies disagree about NA’s role, potentially indicative of regional and age-related variations in NA influence.
In the mature brain, neuroplasticity, e.g., in the context of learning, is improved by optogenetic excitation of the LC (Glennon et al., 2023). Multiple NA-related mechanisms likely support learning. Examples include LC-induced reconfiguration of functional connectivity toward the salience network (Zerbi et al., 2019), astrocytic integration of salient stimuli mediated by α1-adrenergic receptors (Rupprecht et al., 2024), long-term potentiation (LTP) and long-term depression (LTD)-mediated synaptic plasticity from β-adrenergic receptors activation (Adamsky et al., 2018; Hagena et al., 2016), and hippocampal neurogenesis through β-adrenergic receptors (Weselek et al., 2020). Thus, the LC not only plays a role in the early stages of the developing brain but continues to support the brain’s adaptation to new stimuli (i.e., plasticity) throughout life.
The LC-NA system also plays a complex role in neuroprotection. NA is anti-inflammatory by suppressing microglial cytokine production while increasing the breakdown of neurotoxins, which induces microglial migration and phagocytosis mediated through β-adrenergic receptors (Heneka et al., 2010). Recent studies show that NE signaling through β-adrenergic receptors in the awake brain inhibits microglial surveillance, dynamically modulating microglial interaction with neurons and synaptic plasticity, thereby suggesting a critical regulatory role of NE in microglial function under different states of arousal (Liu et al., 2019; Stowell et al., 2019). Additional neuroprotective effects of the LC-NA system are mediated through the co-release of brain-derived neurotrophic factor (BDNF) binding to the TrkB receptor (Liu et al., 2015). NA is also implicated in brain maintenance through the regulation of brain blood flow (Bekar et al., 2012) and vascular permeability (Raichle et al., 1975) by acting on pericytes and astrocytes (Giorgi et al., 2020), thus affecting metabolic supply. However, suppression of NA has also been found to ameliorate glymphatic drainage and inflammatory response after traumatic brain injuries (Hussain et al., 2023), suggesting a complex role of the LC-NA system, influencing multiple aspects of brain function as well as both brain energetic supply and waste removal. Notably, LC pathology seems to precede other symptoms of Alzheimer’s and Parkinson’s disease (Braak and Del Tredici, 2011; Vermeiren and De Deyn, 2017), raising the question of whether LC dysfunction is a driving force in the disease development or an early, parallel process in the already diseased brain.
The role of LC in brain trophic support is multifaceted and even conflicting under different circumstances. The literature on this topic is currently ambiguous and a clear role for NA in the support and protection of brain structures cannot be assigned. Despite the advances since the review by Foote et al. (1983), the understanding of how long-term LC dysfunction impacts structure and microstructural composition in the otherwise normal brain remains lacking. As outlined above, LC ablation leads to various alterations in the brain. How this manifests itself in the brain structure has, however, mostly been investigated by histology. Our study seeks to contribute to this area by doing whole-brain comparisons of brains from controls and LC-ablated mice in two age groups: one where the noradrenergic system is still maturing (LCA13) and one where it is fully developed (see Discussion). In both groups, LC ablation is achieved using the neurotoxin N-(2-Chloroethyl)-N-ethyl-2-bromobenzylamine hydrochloride (DSP-4). We perform ex vivo high-field MRI to assess brain volumetrics and sensitive indices of brain microstructure in these groups.
2 Materials and methods 2.1 AnimalsAll animal procedures were conducted in accordance with the ARRIVE guidelines (Percie Du Sert et al., 2020) and the European Council Directive (2010/63/EU) and approved by the Animal Experiments Inspectorate (permit no: 2020-15-0201-00684) in Denmark. The mice were housed in individually ventilated cages (GR900, Tecniplast, Italy) containing hiding structures, bedding materials, and chewing sticks with water and food ad libitum and kept under a 12-h light/dark cycle (lights on: 07:00 h) at 23 ± 1°C room temperature and 54 ± 2% air humidity.
The study included 35 male C57BL/6NRj mice (Janvier, France) divided into two age groups. The first cohort of mice (n = 20; 10 weeks old) was housed in four cages of five, earmarked, and randomly assigned to the control group (CON; n = 10) or the LC ablation group (LCA; n = 10) within each cage. Subsequently, the animals underwent one pre-treatment and two post-treatment test batteries consisting of the light-dark box (LDB) test and the Barnes maze (BM) test (see Figure 1 for details). The brains were then fixed and harvested for in-skull ex vivo MRI. For the second cohort, five timed pregnant females (Janvier, France; 7 weeks old) arrived at the vivarium on gestation day 8 or 14 and gave birth on gestation day 20. All 15 male pups were weaned at 3 weeks of age and divided into four cages comprised of mice from one or two litters, earmarked, and assigned either the CON (n = 7) or the LCA (n = 8) group within each cage. For convenience, the groups are annotated CON13/LCA13 and CON30/LCA30, referring to the age at euthanasia (13 and 30 weeks of age). The second cohort only underwent one post-treatment test battery followed by the same ex vivo MRI protocol as the first cohort (Figure 1). All behavior tests were conducted by the same experimenter. Consequently, both cohorts were divided in two and separated by approximately 1 week to ensure the tests were conducted within the same time window of the day for every animal.
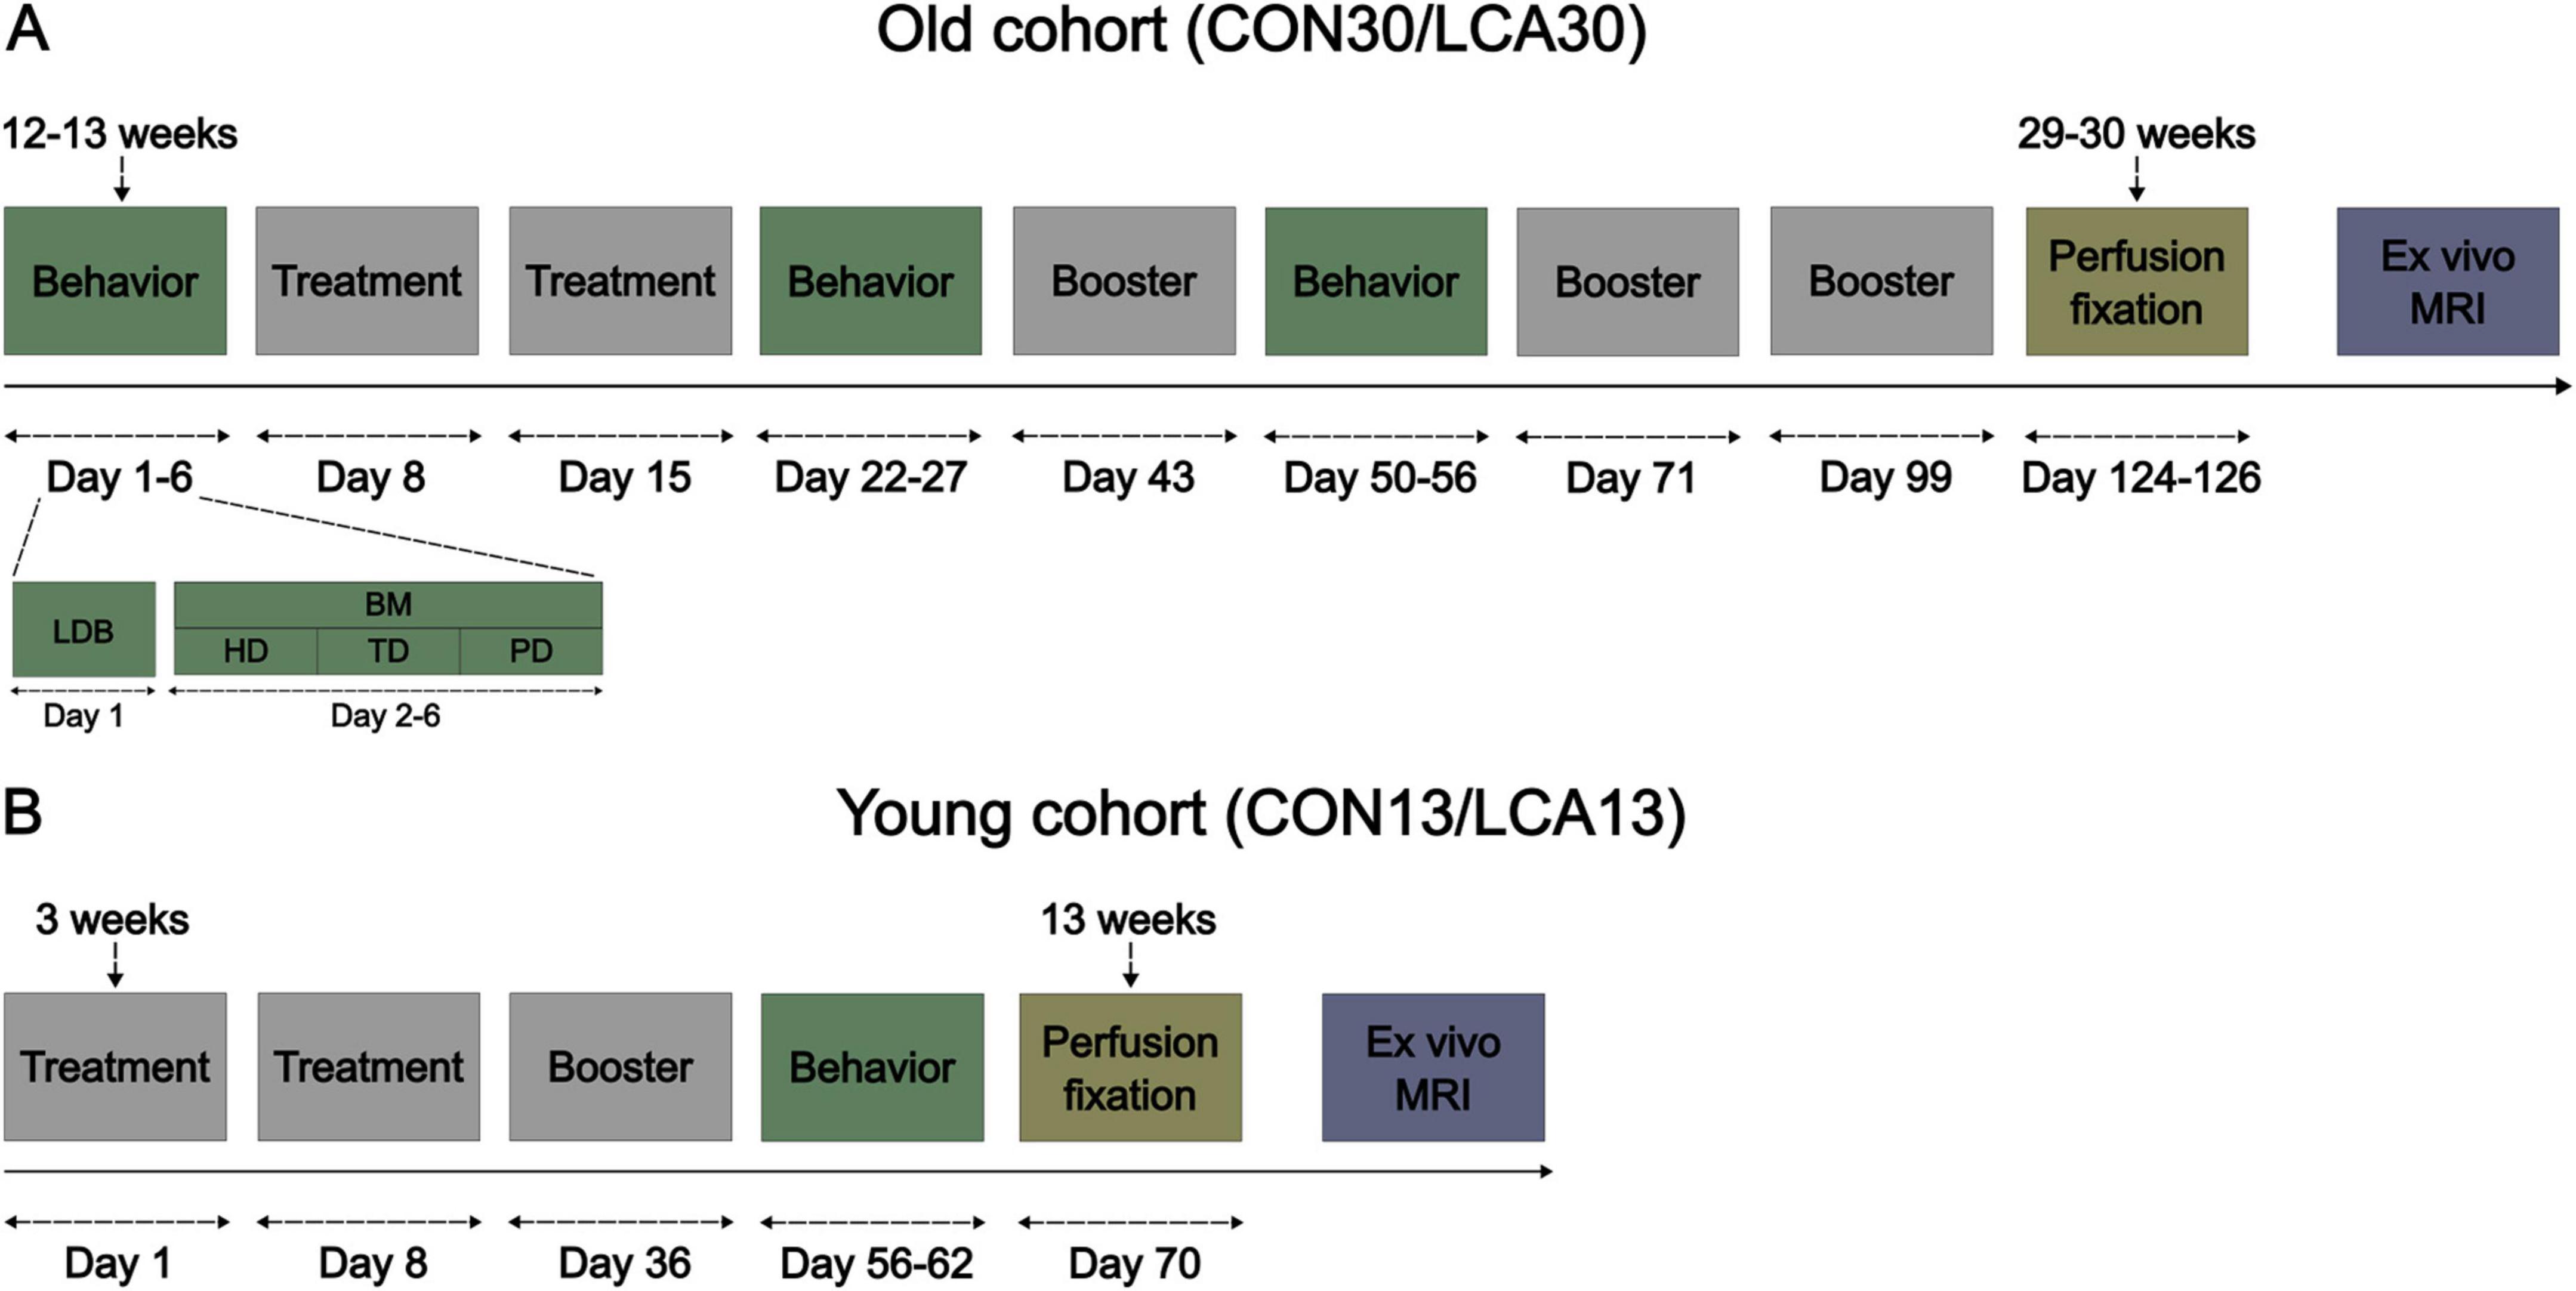
Figure 1. The experimental timeline of the two cohorts of mice. (A) The old cohort of mice where the brain tissue was perfusion fixed at 29–30 weeks of age. The days count under the event blocks are days relative to the first treatment. The behavior event consists of two behavioral tests, detailed under days 1–6. The mice underwent a light-dark box (LDB) test on day 1 and a Barnes maze (BM) test on day 2–6, divided into habituation day (HD), training day (TD), and probe day (PD). The mice received a booster injection every 4 weeks after the initial two treatments. (B) The young cohort of mice, perfusion fixed 13 weeks of age, was weaned 3 weeks after birth and received treatment immediately after.
2.2 Locus coeruleus ablationTo induce LC ablation, we used the procedure described in our previous study (Markussen et al., 2023), corresponding to the LCA2 group. This procedure was found to produce reliable ablations and induce behavioral changes consistent with our understanding of LC function. Briefly, the LCA groups were treated with the LC-selective (Ross and Stenfors, 2015) neurotoxin DSP-4 (Sigma-Aldrich, product no.: C8417) dissolved in sterile phosphate-buffered saline (PBS) immediately before intraperitoneal injection (50 mg/kg). The CON group was correspondingly injected with PBS. Two injections, separated by 1 week, were initially administered. Hereafter, monthly booster injections were administered to suppress compensatory mechanisms (Fritschy and Grzanna, 1992). Body weight and animal behavior were monitored throughout the study. One mouse (LCA30) unexpectedly died 1 week after its third booster injection, with no abnormality in behavior or body weight observed.
2.3 Behavioral testsFor comparison with our previous results (Markussen et al., 2023) and for further characterization of the LC-ablated mouse model, the mice underwent a behavioral test battery consisting of the light-dark box (LDB) test and the Barnes maze (BM) test. The animals were placed in customized acclimatization boxes inside a room equipped with an automated video tracking system and software for behavior analysis (Noldus EthoVision XT 17) 30 min before the tests. The CON30/LCA30 groups underwent one pre-treatment and two post-treatment test batteries. A provisional data check suggested a risk of the mice being too adapted to the tests and, thereby, blurring the ablation effect. Consequently, the test batteries were reduced to a single post-treatment test in the CON13/LCA13 groups. We outline the behavior test procedures briefly below. In the analysis of behavioral data, recorded trials of outliers were inspected for faulty tracking and manually corrected if necessary. Detailed descriptions of the procedures, experimental setup, and data analysis from these two behavior tests were provided previously (Markussen et al., 2023).
2.3.1 Light-dark box testWe use the LDB test to examine the effect of LC ablation on the anxiety of open, illuminated environments and the novelty-induced exploratory behavior (Kulesskaya and Voikar, 2014). The light-dark box (Noldus, Wageningen, Netherlands) consists of a two-compartment box with 1/3 being covered and dark and 2/3 being open and illuminated with approximately 120 lx. The mice were initially placed in the light compartment, facing toward the walls, furthest away from the entrance to the dark compartment. The test was 10 min in duration and was divided into two time bins of 5 min during the analysis to uncover habituation effects. Indicators of anxiety-like behavior (Hascoët, 1998; Simon et al., 1994) extracted from the test included (1) time spent in the light compartment, (2) the percentage of time in the light compartment along the walls, (3) the number of transitions from light to dark compartment, (4) latency to the enter the dark compartment, and (5) latency to enter the light compartment after entering the dark compartment. Furthermore, motility metrics (Recober et al., 2010) were computed to ensure that no motor-related deficiencies were affecting the behavioral tests. The data were not subjected to inferential statistics but served as a control for behavioral differences. The motility metrics included (1) the mean velocity for each compartment, (2) the mean velocity during movement only (when the mouse moved faster than 2 cm/s), and (3) the percentage of time spent moving in a compartment. See Supplementary Figure 1 for an example of the LDB test arena.
2.3.2 Barnes maze testThe BM test was used to assess how spatial learning (Gawel et al., 2019) was affected by the ablation. The BM table (Ugo Basile, Gemonio, Italy) was a one-meter-in-diameter circular table with 20 evenly distributed holes along the table perimeter. The BM test consisted of three phases, distributed over 5 days: (1) One habituation day, including 3 min of exploring the table without an escape box and visual cues, (2) three training days (TDs) with three trials per mouse per day, each trial lasting until the mouse enters the escape box or for a maximum of 3 min, and, (3) one probe day (PD) with a duration of 3 min without the escape box. In each trial, the mouse was positioned in the center of the table. Spatial learning was probed using four metrics: (1) Time before escape, (2) percentage of time spent in the entry zone, (3) number of visits to non-target zones, and (4) latency to entry zone. Differences in search strategies between the groups were assessed by registering the number of different non-target visits and the percentage of time in each table quadrant. The TDs and PDs were separated in the analysis. See Supplementary Figure 1 for an example of the BM test arena.
2.4 Magnetic resonance imaging 2.4.1 Sample preparationBefore perfusion fixation of the brains, the mice were anesthetized using 5% isoflurane mixed with a flow of 0.2 L/min oxygen and 0.2 L/min air, followed by an intraperitoneal injection of 0.5 mL pentobarbital (400 mg/ml, Alfasan, Woerden, Netherlands). After thoracotomy, the brains were perfusion fixed using heparinized (Heparin, 0.2 mL/100 mL, 5000 IU/mL, LEO, Denmark, PN: 464327) PBS (pH = 7.3, Sigma-Aldrich, USA, PN: P4417) for 2–3 min until the liver appeared pale, followed by a buffered formaldehyde solution (4%, pH = 7.0, PN: 9713.1000) for 3 min. After decapitation, the mandible and extracranial tissue were removed from the skull to avoid susceptibility artifacts from air bubbles trapped in fur and cavities during imaging. Hereafter, the samples were stored in the formaldehyde solution for at least 4 weeks. Before imaging, the samples were washed in PBS for at least 24 h on a rocker to increase signal by removal of excess fixative (Shepherd et al., 2009). As a standard procedure (Bay et al., 2018; Chuhutin et al., 2020; Jespersen et al., 2010; Khan et al., 2016; Vestergaard-Poulsen et al., 2011), the samples were subsequently mounted in a 15 mL centrifuge tube filled with a perfluorocarbon-based liquid (Fluorinert, 3M, PN: FC-770). This in-skull brain preparation ensures that brain shape is unaffected during imaging as in Ardalan et al. (2022) and Qvist et al. (2018), enabling atlas-based segmentation as in Lindhardt et al. (2023).
2.4.2 MRI data collectionMRI was performed using a 9.4 T preclinical system (BioSpec 94/20, Bruker Biospin, Ettlingen, Germany) equipped with a bore-mounted 25 mm quadrature transmit-receive coil. To reduce sample vibrations, the tube containing the sample was fitted into the coil using a custom polyethylene foam cylinder. In-house 3D-printed sample holders ensured consistent positioning of the samples throughout the experiments. High-resolution B0 shimming using Bruker’s MAPSHIM was performed to improve echo-planar imaging (EPI) employed here for DKI acquisition. Both DKI data and structural data were acquired for each sample.
DKI data was collected using an 8-segmented diffusion-weighted spin-echo EPI sequence with a 150 × 150 μm in-plane resolution and 60 slices with a thickness of 250 μm. Initially, five unweighted images were acquired for normalization of the 30 isotopically distributed encoding directions at each of the three non-zero b-values (0.5, 1.0, 2.0 ms/μm2). Additional scan parameters were time between diffusion gradients (Δ) = 15 ms, duration of diffusion gradients (δ) = 6 ms, 20 averages, effective echo time (TE) = 27.7 ms, repetition time (TR) = 3500 ms, bandwidth = 278 kHz, with a scan time of 19 h 26 m 40 s.
Two structural data sets were acquired per sample. A rapid acquisition with relaxation enhancement (RARE) sequence with a 50 × 50 μm in-plane resolution, 250 μm slice thickness, and 60 slices in total was used for multi-atlas segmentation (MAS, details below) for ROI-specific extraction of DKI parameters. These data had the same slice thickness and positions as the DKI data described above to increase segmentation fidelity of the DKI data. The scan parameters used were effective TE = 10.5 ms, TR = 3000 ms, 30 averages, and RARE factor = 2, constituting a scan time of 2 h 28 m 30 s. For the volumetric analysis, we used a 3D fast low-angle shot (FLASH) sequence to obtain data with an isotropic resolution of 50 μm. Scan parameters were: TR = 88.5 ms, TE = 13.7 ms, matrix size = 360 × 198 × 300, FOV = 18 × 9.9 × 15 mm, and 4 averages, resulting in a scan time of 6 h 31 m 21 s.
2.4.3 Multi-atlas segmentation and manual LC delineationTo systematically extract regional information from the mouse brain, a multi-atlas segmentation (MAS) (Ma et al., 2014, 2019) was performed using 10 ex vivo NeAt templates from C57/BL6J mice (Ma et al., 2005, 2008). This was done similarly to our previous study (Lindhardt et al., 2023) with minor modifications. Briefly, the MAS pipeline was utilized for the structural RARE images, having the same slice package as the DKI sequence. N4 bias field correction proved beneficial due to some sensitivity drop in the outer edges of the coil’s axial FOV. The non-linear transformation step, as per default recommendation in the pipeline (Ma et al., 2014, 2019), was, therefore, also carried out. This procedure resulted in high-resolution labeled images, downsampled to match the in-plane resolution of the diffusion MRI, to extract DKI metrics in anatomically well-defined regions of interest (ROIs). See Supplementary Figure 2 for a segmentation example.
Microstructural effect of ablation in the LC-containing part of pons was assessed. For this, ROIs were manually drawn on the high resolution structural scans for each using a mouse brain atlas as guide (Paxinos and Franklin, 2001). Care was taken to ensure as small ROIs as possible to avoid contamination by partial volume effects. These ROIs were then downsampled to match the DKI resolution and used to extract pixel-wise values of MD and MK for all animals. See Supplementary Figure 3 for these segmentations. Pixelwise metric values were then pooled by groups for analysis.
2.4.4 Volumetric analysisAfter quality checking the MRI scans, three subjects (2 × CON30 and 1 × LCA13) were excluded from the volumetric analysis. For the remaining samples, the high-resolution FLASH images were processed using an in-house pipeline applying B1 inhomogeneity correction (Sled et al., 1998), denoising (Coupe et al., 2008), and intensity normalization. Spatial alignment with a high-resolution template of the C57BL/6J mouse (Dorr et al., 2008) was done by manually initializing a linear registration (Collins et al., 1994) followed by a non-linear registration (Avants et al., 2014). Neuroanatomical labels from the C57BL/6J mouse atlas were subsequently transformed and resampled to scanner native space using the calculated deformation fields and affine transformations for calculation of individual regional volumes. All ROI volumes were normalized to the total brain volume (TBV).
Cortical thickness was calculated as previously described (Lerch et al., 2008). Briefly, Laplace’s equation, with a fixed boundary condition that differed at the inner and outer surfaces, was solved using the inner and outer surfaces of the cortex defined on the anatomical atlas and transformed to the given mouse. For each point on the cortical surface, the length of a streamline connecting the inside and outside surfaces was used to define the thickness. Cortical thickness was averaged within the bilateral frontal, occipital, and parieto-temporal lobes as well as the entorhinal cortex.
2.4.5 Diffusion kurtosis analysisBefore analysis, all DKI data were initially inspected visually for quality, resulting in the exclusion of four subjects (2 × CON30, 1 × LCA13, and 1 × LCA30) from the DKI analysis due to artifacts. DKI data from the remaining samples were preprocessed in MATLAB (MathWorks Inc., v. 2022a), including Rician noise floor correction (Koay and Basser, 2006), denoising (Veraart et al., 2016), and correction for Gibbs ringing (Kellner et al., 2016). After preprocessing, DKI data analysis was performed using in-house MATLAB scripts as previously described in Ardalan et al. (2022) and Hansen et al. (2017) yielding metrics of mean water diffusivity (MD), tissue anisotropy (FA) and indices of tissue microstructure (tensor-based mean kurtosis, MK) in each voxel (see Hansen et al. (2017) for details and review). Before the DKI analysis, ROI voxel values four times the median absolute deviation were filtered out. The ROIs were bilaterally pooled before the statistical analysis.
2.5 Statistical analysisVolumetric and diffusion metrics were probed using a mixed permutation analysis of variance (ANOVA). Behavioral outcomes were analyzed using mixed permutation ANOVAs and bootstrapped Welch’s t-tests. Statistically significant interaction effects were further decomposed into simple main effects permutation analyses. Finally, bootstrapped Welch’s t-tests were conducted for post hoc testing, reporting the bootstrapped confidence interval (CI) of the group difference and bootstrapped p-values, which were then corrected for multiple comparisons using the Holm method. TBV-ROI correlations were assessed using Pearson correlation with bootstrapped CI. Both resampling methods used 10000 repetitions. Pooled values of MD and MK from the LC-containing region of pons were tested for difference using a permutation test with 100000 repetitions. Effect size maps of cortical thickness differences are provided as Cohen’s d. The p-maps are based on a two-tailed t-test at each vertex on the cortical surface. The statistical analysis was carried out in R using the packages “permuco” (Frossard and Renaud, 2021), “wPerm” (Weiss, 2015), “MKinfer” (Kohl, 2024), and “confintr” (Mayer, 2023) and MATLAB using the function “PermutationTest” (Omran, 2024). Figures were made in Matlab or Python using the library “matplotlib” (Hunter, 2007).
3 Results 3.1 Animal well-beingSupplementary Figure 4 shows the progression of body weight measurements between the CON and LCA groups. In general, we did not see any signs of lowered well-being of the animals during the study.
3.2 Behavioral resultsInitially, behavioral tests were conducted on the CON30/LCA30 groups.
3.2.1 Light-dark boxOverall, the LCA30 group exhibited an increased duration spent in the light compartment compared to the CON30 group, particularly evident in the 1-week post-treatment test (Figures 2A, B), where the time was increased by 108 and 29% during the first and last 5 min, respectively. Here, the LCA30 group also exhibited a 38% increase in the number of transitions during the first 5 min (Figure 2E). Additionally, the LCA30 group showed a 26% reduction in time spent in the dark compartment before returning to the light after the initial transition between compartments (Figure 2H). Beyond these metrics and time points, the groups remained comparable, as detailed in Figure 2. See Supplementary Tables 1, 2 for descriptive group statistics. For the time spent in the light compartment (Figures 2A, B), the three-way mixed permutation ANOVA revealed a significant treatment × time interaction (F(2,36) = 4.44, p = 0.020) along with main effects observed for time bins (F(1,18) = 10.00, p = 0.006) and time (F(1,18) = 9.40, p = 0.000). A post hoc test of the significant main effects analyses revealed a treatment group difference across time bins 1 week before the LC ablation, where the LCA30 group spent 20% less time in the light compartment (p = 0.020, 95% CI [−6, −49]). This was opposite 1 week after the ablation, where LCA30 spent 55% more time in the light compared to CON30 (p = 0.014, 95% CI [11, 61]). For the time along the walls (Figures 2C, D), only the time term was found to be significant (F(2,36) = 4.59, p = 0.016), while the remaining terms were not. The number of transitions (Figures 2E, F) differed between the LDB tests (F(2,36) = 35.96, p < 0.000), as did the time bin × time interaction (F(2,36) = 4.67, p = 0.019). However, no significant treatment-related differences were observed, including the treatment × time bin × time interaction (F(2,36) = 0.02, p = 0.982). A two-way mixed permutation ANOVA revealed a significant main effect of time for the duration spent in light before the first transition (F(2,36) = 33.12, p < 0.000) (Figure 2G), while no significant main effect of treatment (F(1,18) = 0.18, p = 0.685) nor the treatment × time interaction (F(2,36) = 0.09, p = 0.920) was observed. Comparable results were seen in the time in dark before returning to light (Figure 2H) with a significant main effect of time (F(2,36) = 8.25, p = 0.002), while neither the treatment term (F(1,18) = 0.36, p = 0.550) nor the treatment × time interaction (F(2,36) = 0.24, p = 0.793) were significant. Motor-related metrics can be found in Supplementary Figures 5, 6. Here, a small difference was observed in mean velocity and percentage of time spent moving in the light compartment 1 week after treatment.
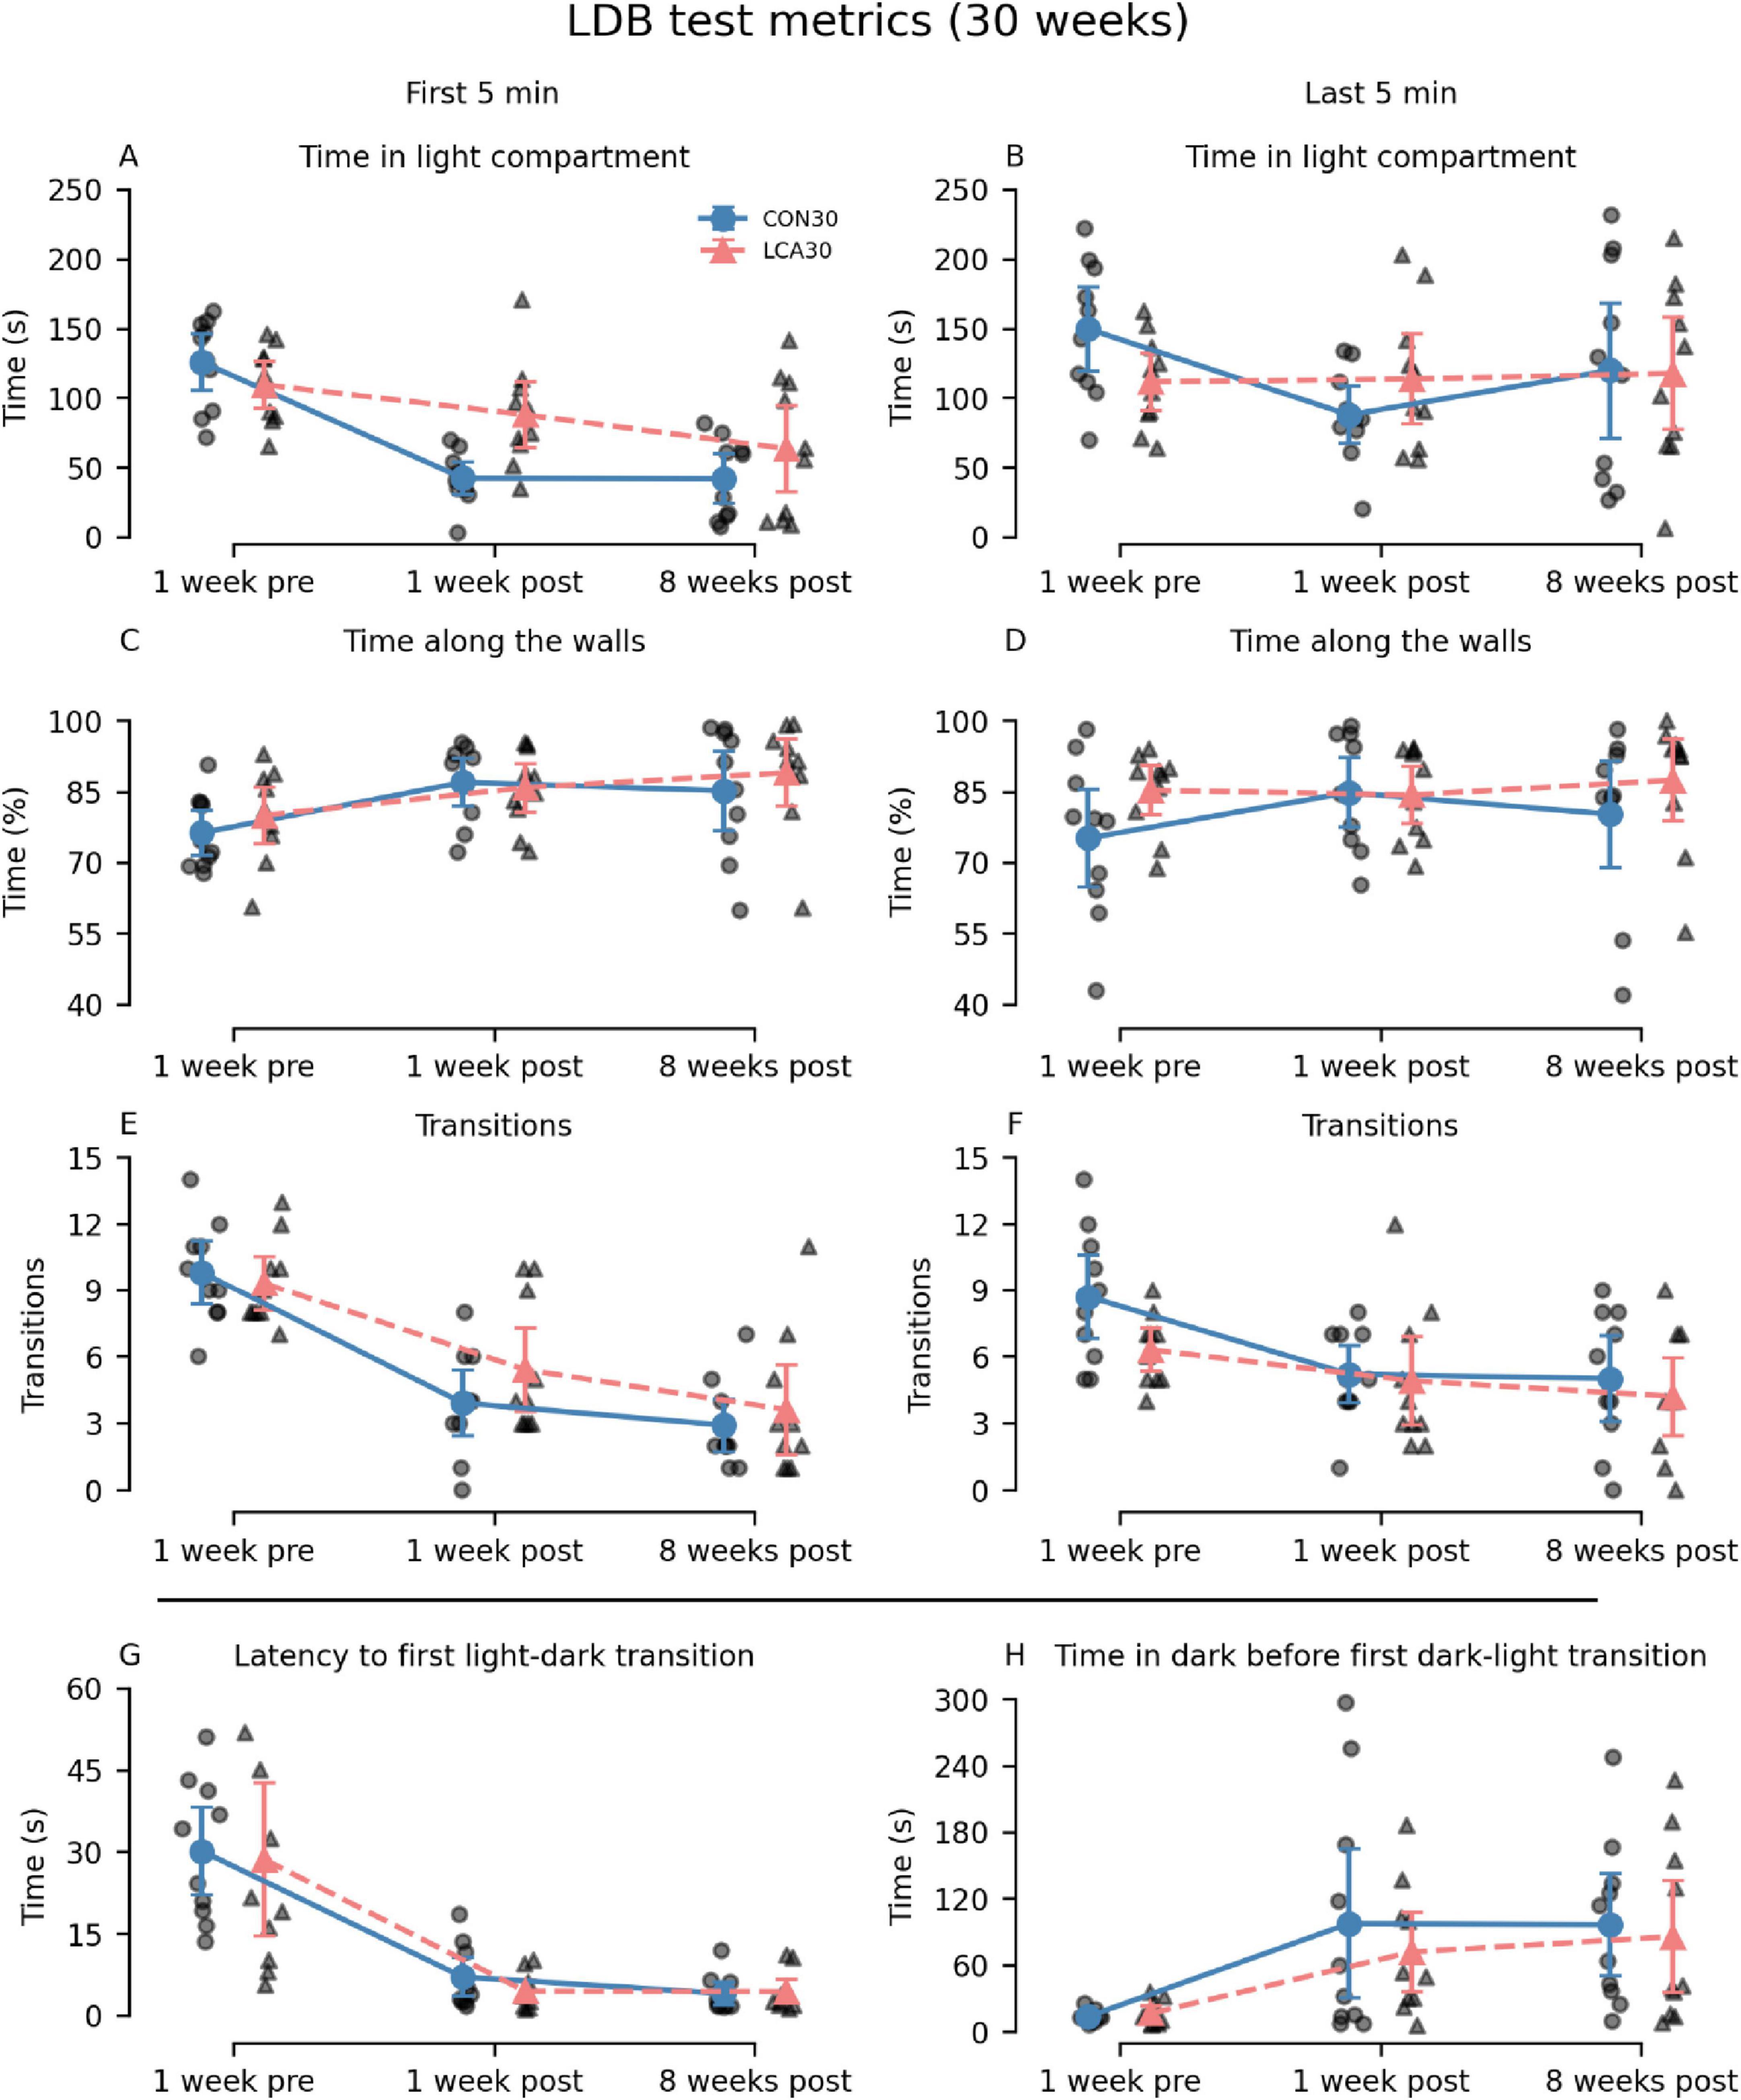
Figure 2. Light-dark box (LDB) test results of the CON30/LCA30 groups. The LDB test metrics were separated into time bins of 5 min at three time points relative to the treatment (the “time” factor in the statistical analysis). Note that the columns show time bins (first and last 5 min) except for the two last subplots where this division was not applicable. The x-axis shows the time of the experiment relative to the treatment. (A,B) A pronounced difference was observed in the time spent in the light compartment 1 week after treatment, where the LCA30 group stayed longer in the light compared to the CON30 group. (C,D) No difference was observed in the time along the walls. (E,F) The LCA30 group had more transitions between compartments 1 week after the treatment during the first 5 min but did not differ at other time points. (G) The groups did not differ in the latency to the first light-to-dark transition. (H) The LCA30 returned faster to the light compartment after the first transition to the dark compartment. See Supplementary Tables 1, 2 for detailed descriptive statistics. The group mean with 95% CI is plotted next to the individual observations.
The differences between the LCA13 and CON13 groups were comparable with the older cohort. The LCA13 group spent more time in the light compartment during the last 5 min, alongside elevated percentages of time along the walls and transitions throughout both time intervals compared to the CON13 group. See Figure 3 for an overview. The two-way mixed permutation ANOVA showed a significant difference in time spent in the light compartment (Figure 3A) between the time bins (F(1,13) = 5.21, p = 0.041). However, neither the treatment term (F(1,13) = 2.64, p = 0.125) nor treatment × time bin interaction (F(1,13) = 2.10, p = 0.170) were significant. Similar results were obtained for time along the walls, where no treatment effects were observed (Figure 3B). The two time bins differed significantly from each other (F(1,13) = 10.59, p = 0.008), while neither treatment (F(1,13) = 1.85, p = 0.200) nor the treatment × time bin interaction (F(1,13) = 0.50, p = 0.480) showed statistical significance. Similarly, the difference in the number of transitions (Figure 3E) between the two time bins was significant (F(1,13) = 7.16, p = 0.020), but not for the treatment term (F(1,13) = 2.25, p = 0.156) and the treatment × time bin interaction (F(1,13) = 0.30, p = 0.597). Bootstrapped Welch’s t-tests did not reveal significant differences between the groups for both latency to first light to dark transition (p = 0.811, 95% CI [−17.47, 19.58]) (Figure 3C) and the time in dark before returning to the light compartment (p = 0.787, 95% CI [−7.24, 5.35]) (Figure 3D). No motor-related differences were observed between the treatment groups (Supplementary Figure 7).
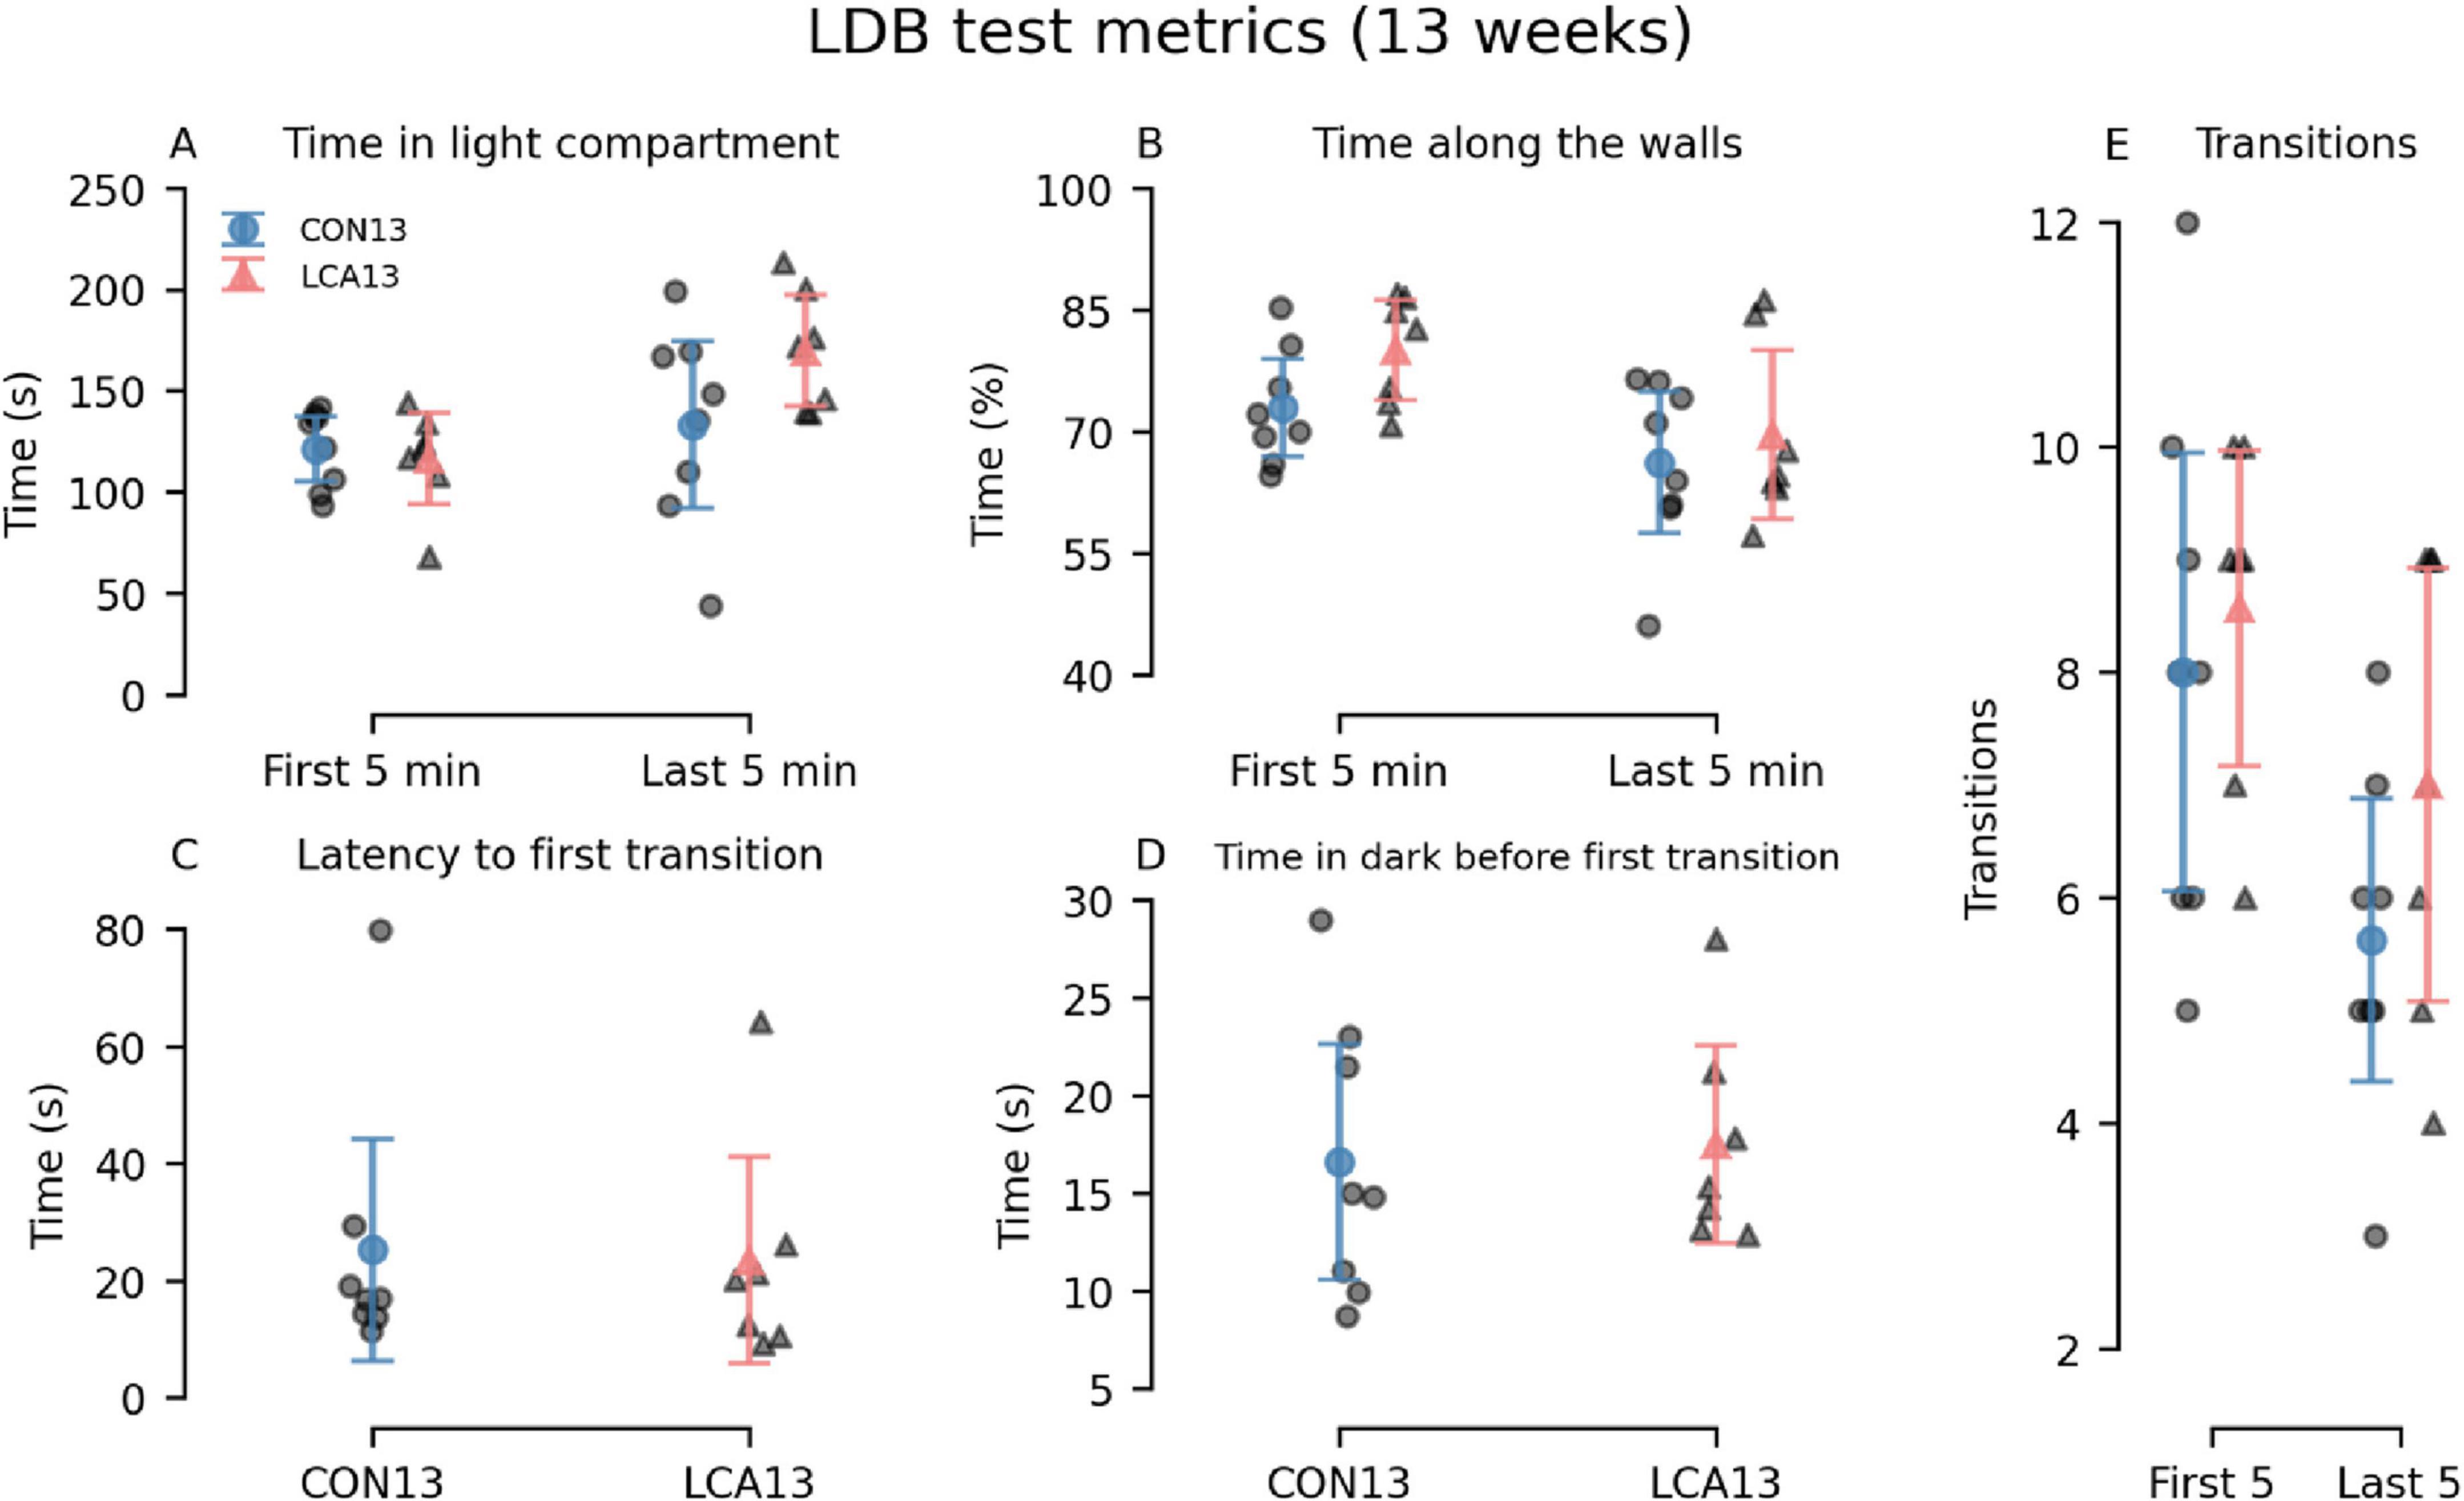
Figure 3. Light-dark box (LDB) test results of the CON13/LCA13 groups divided into 5 min time bins. (A) Notably, the LCA13 group spent more time in the light compartment during the last 5 min. The groups did not differ in the (B) time along the walls, (C) latency to first light-to-dark transitions, and (D) time in the dark before the first transition to light. (E) The number of transitions was higher during both time bins. The group mean with 95% CI is plotted based on individual observations. See Supplementary Tables 3, 4 for descriptive statistics.
3.2.2 Barnes mazeGenerally, the LCA30 group performed better than the CON30 group during the initial TDs in most of the learning metrics before the groups received their treatment (Figures 4A, D, G, J). However, these differences largely vanished in the two post-treatment tests except for the error count 8 weeks after treatment. Here, the LCA30 group exhibited more errors during the initial TD compared to the CON30 group (Figure 4I). Notably, the learning curve across TDs was comparable with the pre-treatment learning curve, with an even higher number of initial errors on TD1 (Figure 4G). The three-way mixed permutation ANOVA of the error count found a significant treatment × time × day interaction (F(4,36) = 3.59, p = 0.015), corresponding to the data of Figures 4G–I). However, a simple interaction effect analysis of the treatment × time interaction at all levels of the time factor resulted in no significant outcomes. No treatment differences were observed for the time before escape (Figures 4A–C), latency to first visit in entry zone (Figures 4D–F), and time in entry zone (Figures 4J–L). See Supplementary Tables 5–8 for descriptive group statistics.
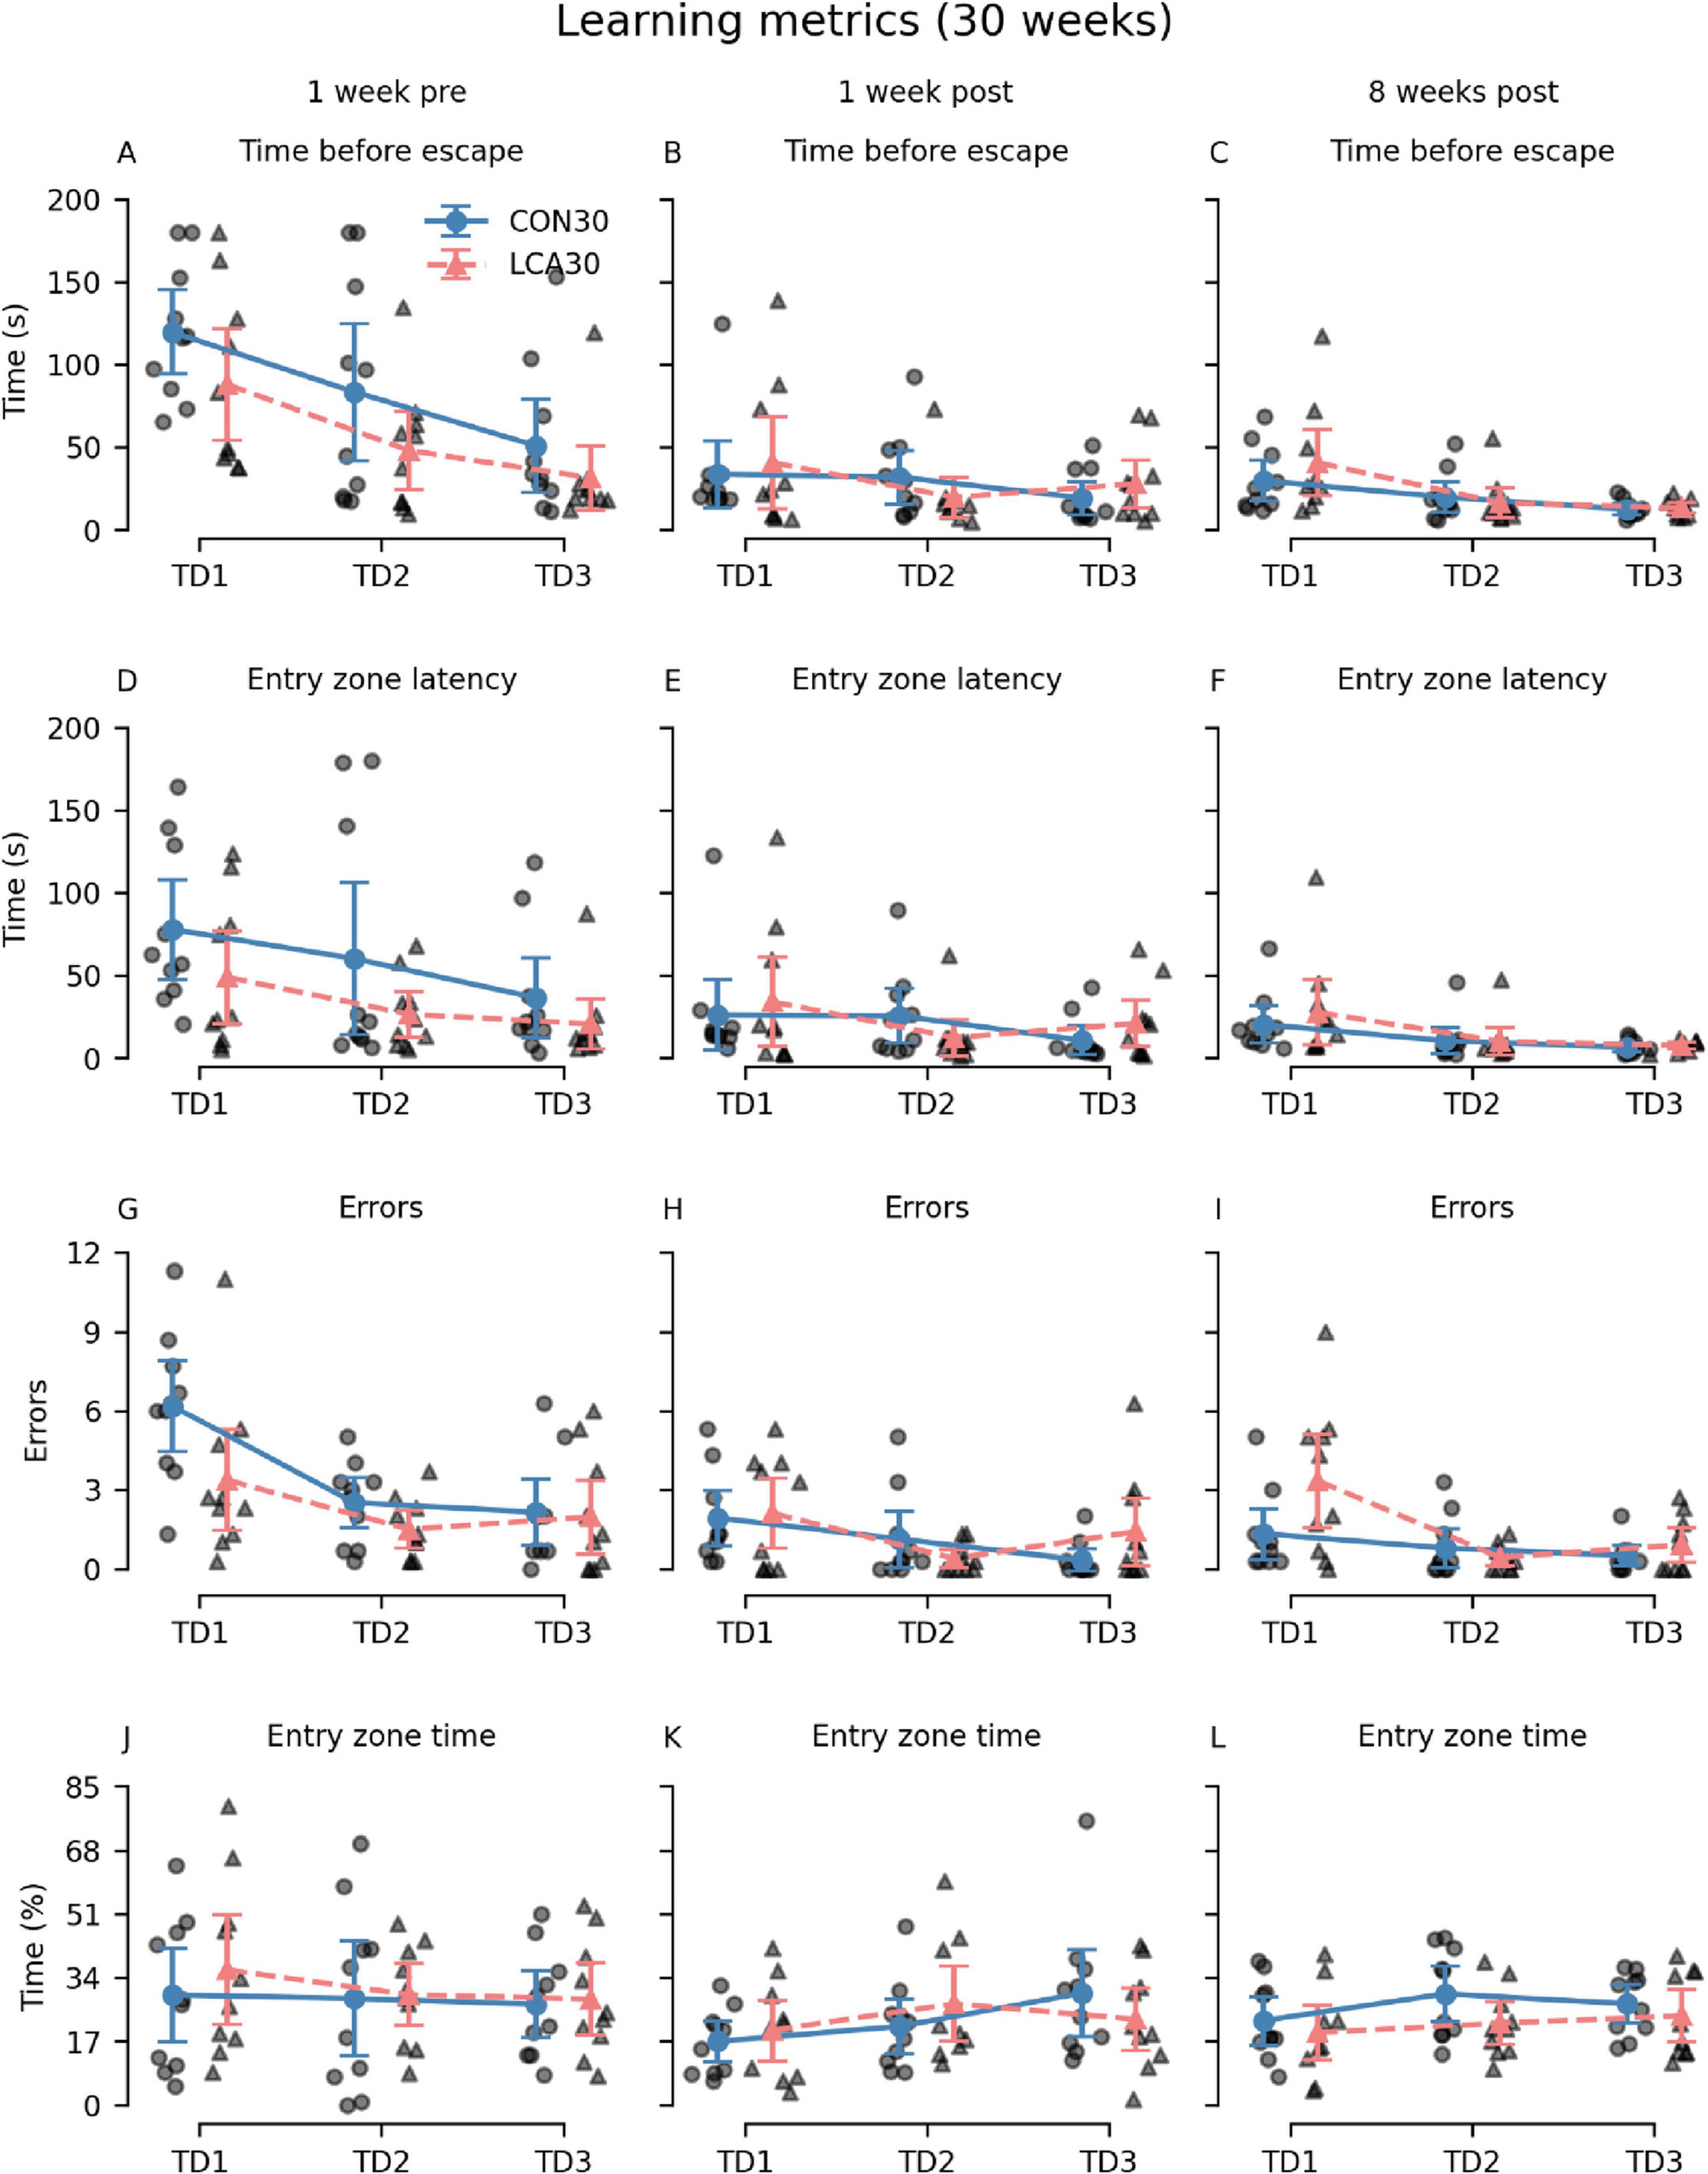
Figure 4. The Barnes maze (BM) learning metrics of the CON30/LCA30 groups on the three training days (TDs) at each of the three time points. (A–C) The groups did not differ in time before entering the escape box. (D–F) No differences were observed between the groups in the latency to enter the zone around the escape box. (G–I) The LCA30 group had more erroneous visits to non-target entry zones 8 weeks after the treatment compared to the CON30 group and even their baseline performance 1 week before the treatment. (J–L) The groups were not different in the time spent in the entry zone. The group means with 95% CI are plotted as error bars next to the individual observations. See Supplementary Tables 5–8 for descriptive statistics.
Additional metrics were analyzed to investigate whether differences in search strategy could mask effects of the ablation (Figure 5). Interestingly, 8 weeks after the treatment, we observed that the LCA30 group had a 142% increase in visits to different non-target zones on TD1 compared to the CON30 group (Figure 5C) while also spending 83% more time in the quadrant opposite to the escape box, despite performing better during the pre-treatment test (Figures 5G–I). The three-way permutation ANOVA of the different non-target zones found a significant treatment × time interaction (F(2,18) = 3.61, p = 0.047). However, the simple main effect analysis showed no difference. See Supplementary Tables 5–8 for descriptive group statistics. No significant differences were observed between the treatment groups on the PD (Supplementary Figure 8).
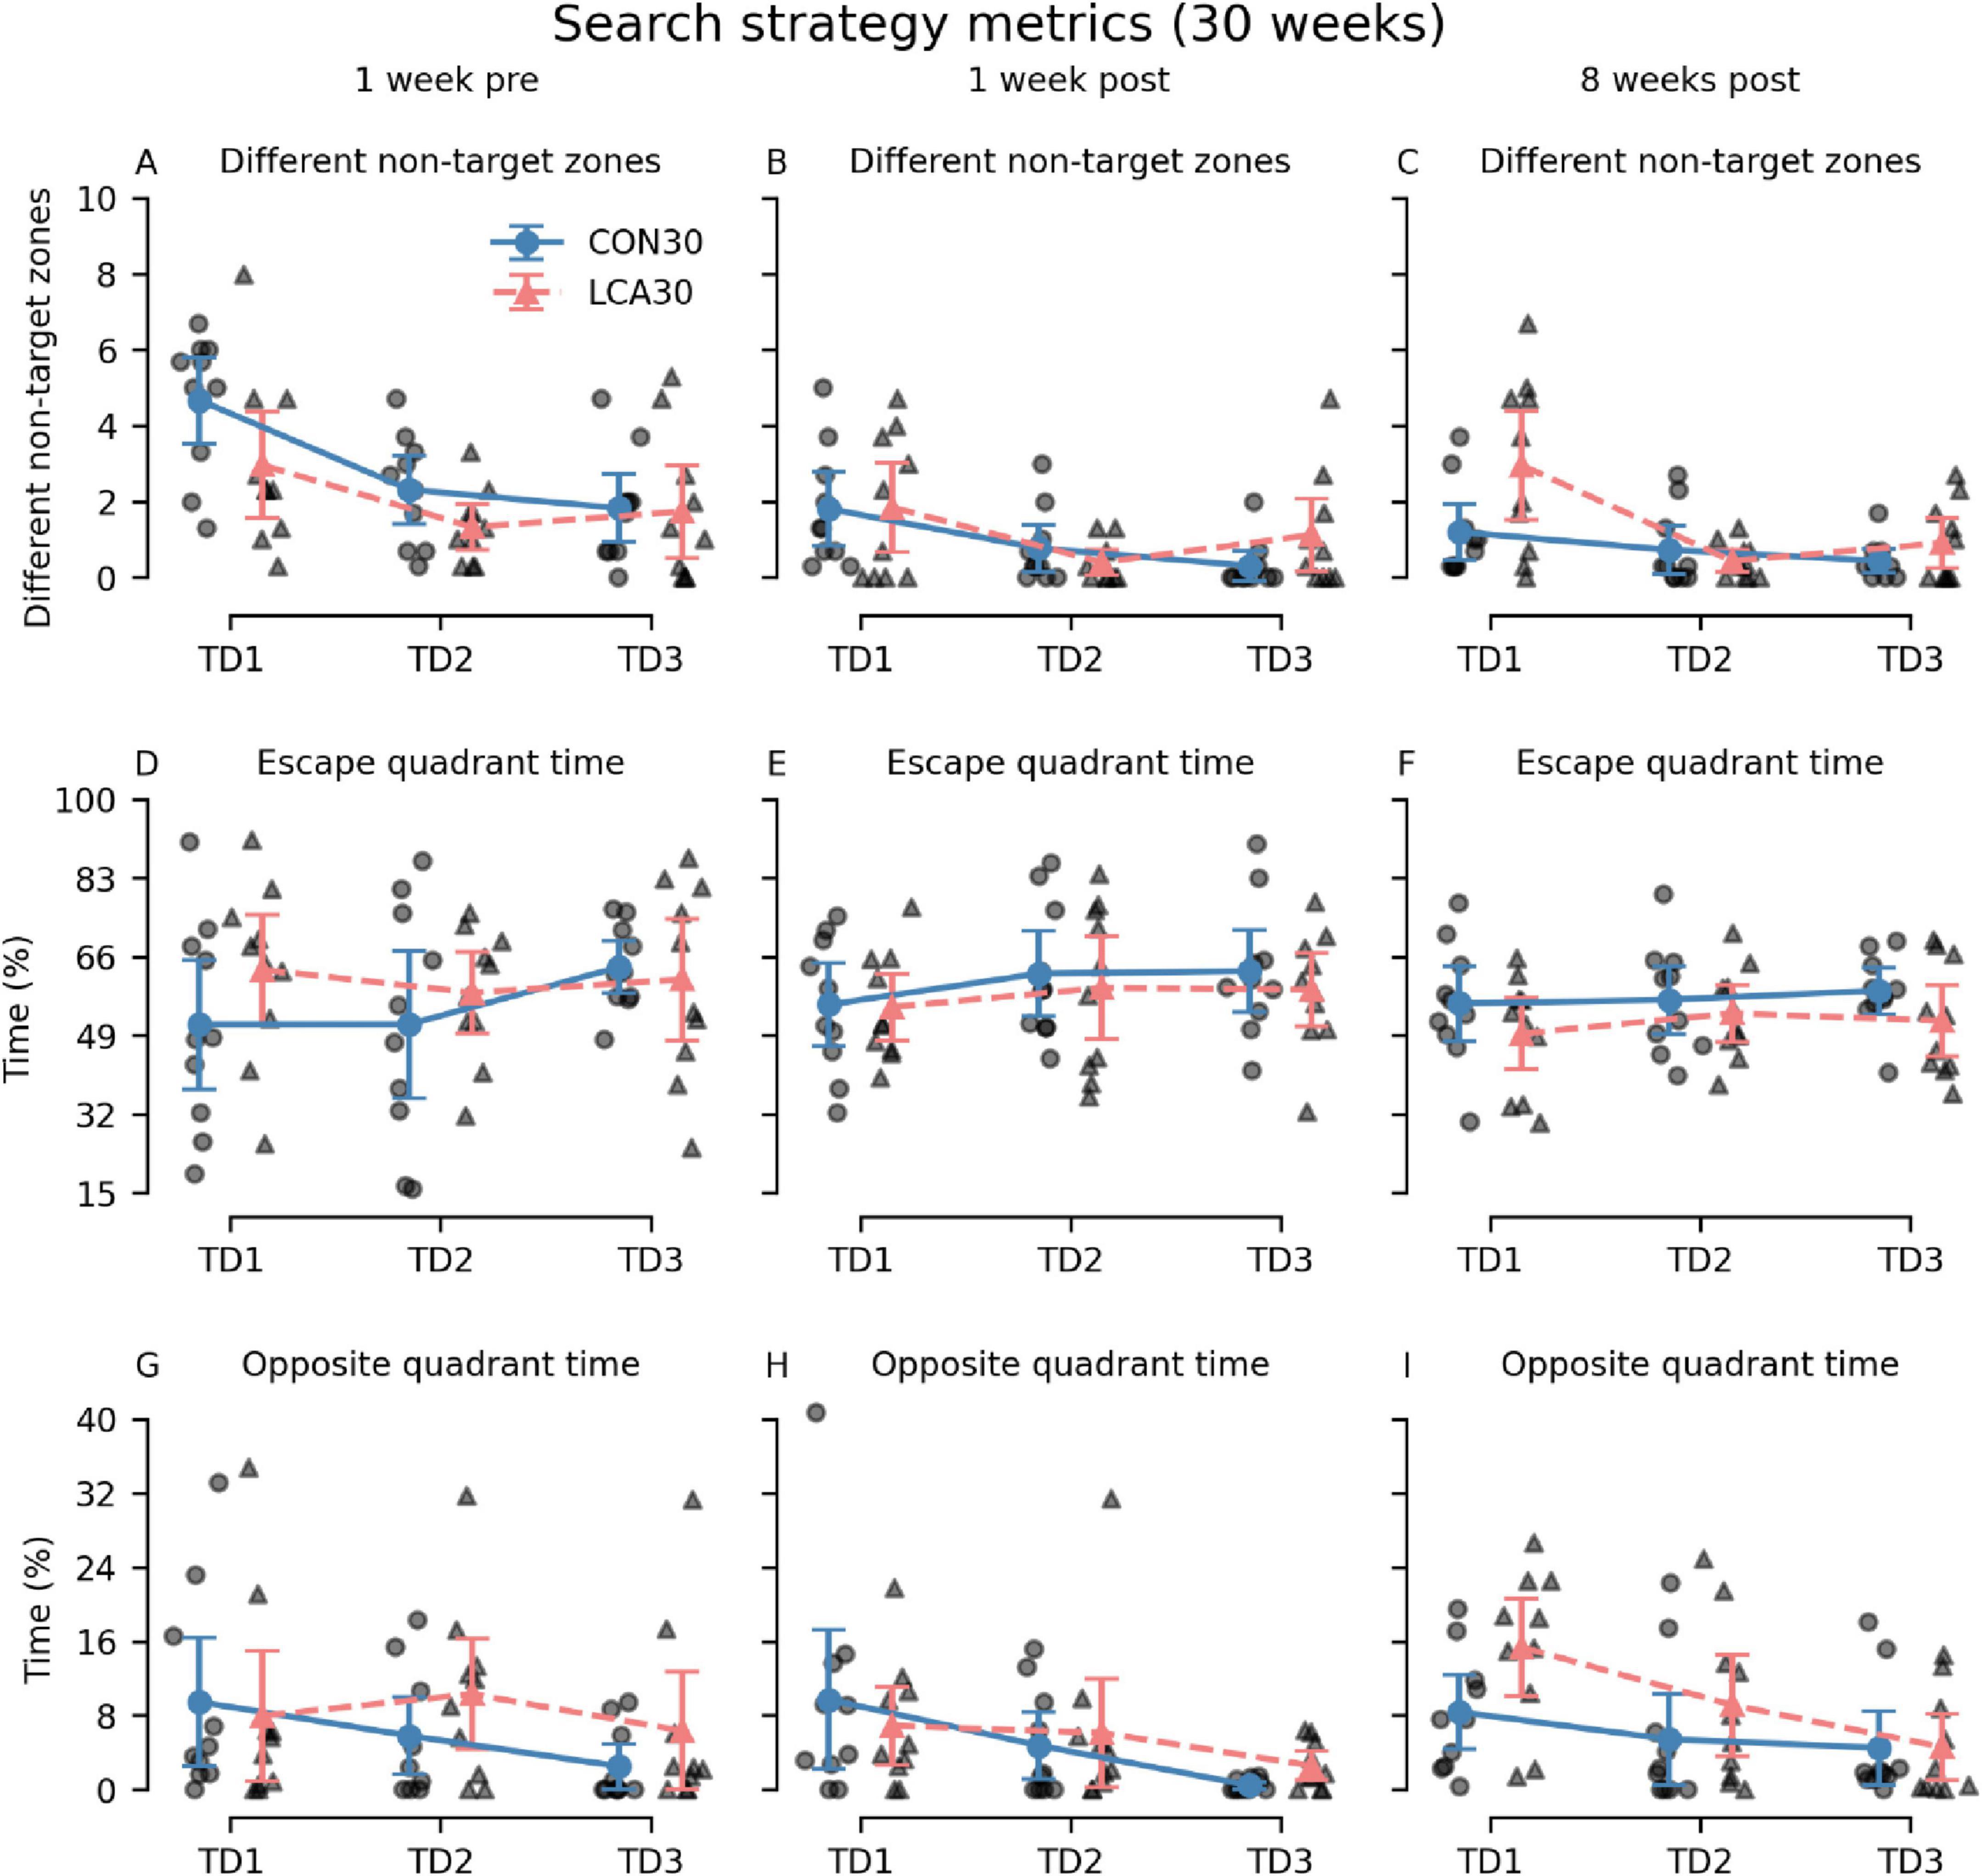
Figure 5. The Barnes maze (BM) search metrics of the CON30/LCA30 groups on the three training days (TDs) at each of the three time points. (A–C) The LCA30 groups had more visits to non-target zones 8 weeks after the treatment compared to the CON30 group. (D–F) No differences were observed between the groups in the time spent in the quadrant of the table containing the escape box. (G–I) The LCA30 group spent more time in the quadrant of the table opposite the escape box 8 weeks after the treatment. The group means with 95% CI are plotted as error bars next to the individual observations. See Supplementary Tables 5–8 for descriptive statistics.
In general, no differences were observed between the LCA13 and CON13 in any of the BM metrics during the TDs. As expected, both groups exhibited the ability to learn, and a significant main effect of day was found in all metrics. See Supplementary Figure 9 for an overview. No differences were observed between LCA13 and CON13 on the PD (Supplementary Figure 10).
3.3 MRI results 3.3.1 Ablation effect in the subregion of pons containing the LCFigure 6 shows histograms of pixel-wise MD and MK values in the LC-containing part of pons from all animals pooled by group. MD is not significantly different between LCA and CON in either age group (Figures 6A–C). MK is not significantly different between LCA13 and CON13 although the mode of the LCA13 distribution (0.52) is lower than in the CON13 group (0.54) and the distribution variances were significantly different (two-sided F-test, p = 0.007). MK is significantly decreased in the LCA30 compared to CON30 (p = 0.002) (Figure 6D). Here, the group mean for LCA30 is 0.76 ± 0.14 compared to 0.81 ± 0.14 for CON30. In each plot, vertical lines mark the mean value for each group. Reported values are mean ± SD.

Figure 6. Histograms of pixel-wise MD and MK values in the LC-containing part of pons from all animals pooled by group. (A) Distribution of MD values in CON13 and LCA13 (ns). (B) Distribution of MK values in CON13 and LCA13 (ns). (C) Distribution of MD values in CON30 and LCA30 (ns). (D) Distribution of MK values in CON30 and LCA30 (p = 0.002). In all panels vertical lines represent distribution mean values. Significance was determined by permutation test by the mean (100000 permutations). ns, not significant. *p < 0.05.
3.3.2 VolumeOverall, the volume of all ROIs in the LCA groups did not differ from the CON groups, regardless of their age. Instead, the age groups differed in multiple ROIs (Figure 7). The three-way mixed permutation ANOVA found a significant age × ROI interaction (F(10,270) = 53.96, p < 0.000) and two main effects (age: F(1,27) = 33,83, p < 0.000, ROI: F(10,270) = 42560,00, p < 0.000). No significant main effect of treatment (F(1,27) = 0.15, p = 0.711), treatment × age interaction (F(1,27) = 0.40, p = 0.541), or treatment × age × ROI interaction (F(10,270) = 0.15, p = 0.999) were observed. Post hoc tests of the significant simple main effects analysis showed age-related differences in the hippocampus (p = 0.029, 95% CI [0.02, 0.22]), hypothalamus (p = 0.003, 95% CI [−0.16, −0.04]), occipital cortex (p < 0.000, 95% CI [0.10, 0.16]), midbrain (p < 0.000, 95% CI [−0.23, −0.12]), pons (p < 0.000, 95% CI [−0.25, −0.14]), frontal cortex (p < 0.000, 95% CI [0.28, 0.55]), and parieto-temporal cortex (p < 0.000, 95% CI [0.80, 1.18]). See Supplementary Table 9 for descriptive group statistics.
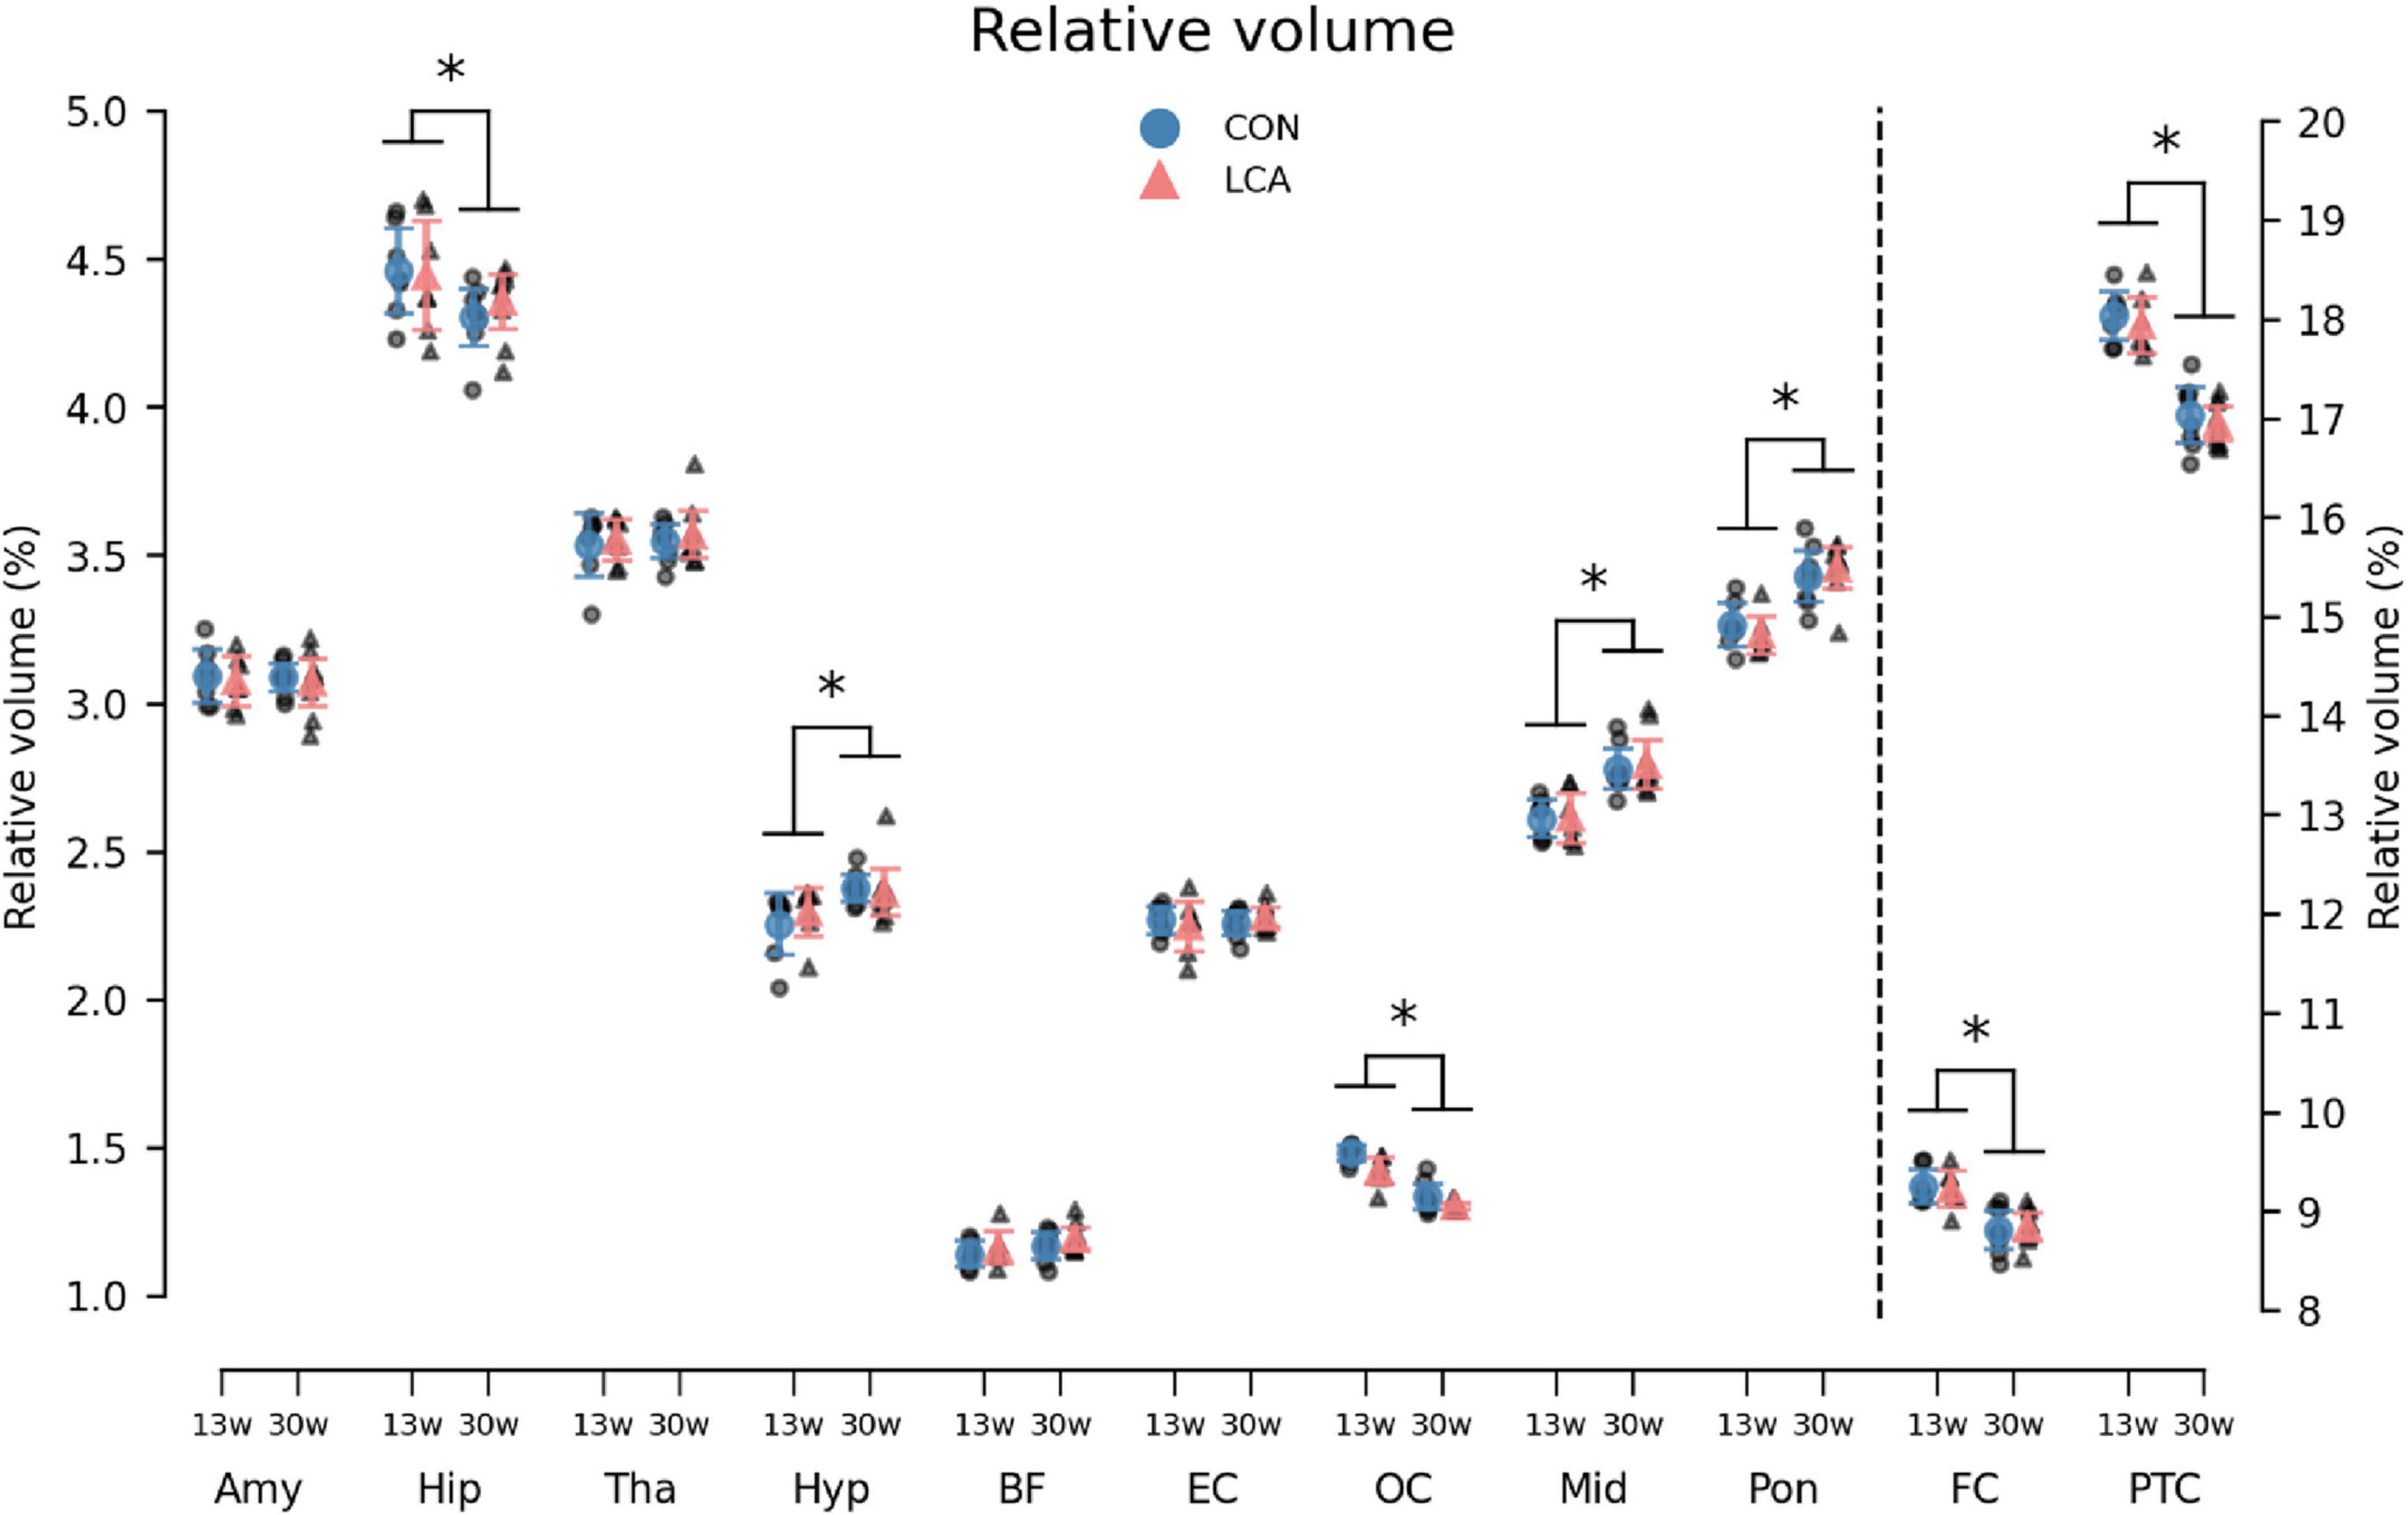
Figure 7. The volume of the 11 regions of interest (ROIs) given as the percentage of total brain volume (TBV). Note that FC and PTC belong to the right axis. Notably, the LCA and CON groups of the same age were similar, while a difference was observed between the age groups. The group mean with 95% CI is superimposed on the individual observations. See Supplementary Table 9 for detailed descriptive statistics. 13w, 13 weeks old; 30w, 30 weeks old; Amy, amygdala; hip, hippocampus; tha, thalamus; hyp, hypothalamus; BF, basal forebrain; EC, entorhinal cortex; OC, occipital cortex; mid, midbrain; pon, pons; FC, frontal cortex; PTC, parieto-temporal cortex. *Age difference (p < 0.05).
Although the ROI volumes remained consistent between treatments, the TBV, from which the relative ROI volumes were derived, conversely differed across treatment and age (Supplementary Figure 11A). While the LCA13 group had smaller TBV compared to the CON13 group, this pattern was reversed among the older groups, with the LCA30 group demonstrating larger TBVs compared to the CON30 group. A two-way permutation ANOVA revealed a significant treatment × age interaction (F(1,27) = 5.84, p = 0.024), but no main effects [treatment: F(1,27) = 0.01, p = 0.938, age: F(1,27) = 2.77, p = 0.109)]. A bootstrapped post hoc analysis of significant main effects analyses revealed a difference between CON13 and CON30 (p = 0.020, 95% CI [7.87, 29.65]). See Supplementary Tables 10, 11 for descriptive statistics of TBVs and Supplementary Figure 12 for unnormalized ROI volumes.
We also investigated the cortex thickness of four cortical regions. Voxel-wise comparisons of the two groups suggested a difference in occipital cortex thickness at both ages (Figures 8A, B). However, after correcting for multiple comparisons, no significant differences were observed (Supplementary Figure 14). Comparisons of the ROIs revealed an age-related difference but also a treatment effect, mostly pronounced in the occipital cortex (Supplementary Figure 14), in agreement with the difference maps of Figure 8. Using three-way mixed permutation ANOVA to test the mean thickness of each ROI, we found a significant treatment × ROI interaction (F(3,81) = 4.01, p = 0.009) and main effects (treatment: F(1,27) = 4.57, p = 0.042, age: F(1,27) = 85.87, p < 0.000, ROI: F(3,81) = 1283.84, p < 0.000). The bootstrapped post hoc test of the treatment × ROI interaction found a significant difference between the two treatments in the occipital cortex (p < 0.000, 95% CI [0.05, 0.10]). Additionally, a bootstrapped post hoc test of the age effect revealed a significant difference in all ROIs (FC: p = 0.001, 95% CI [0.03, 0.08], PTC: p < 0.000, 95% CI [0.05, 0.07], OC: p < 0.000, 95% CI [0.05, 0.10], EC: p < 0.000, 95% CI [0.03, 0.07]). See Supplementary Figure 13. No significant interaction was observed for treatment × age × ROI (F(3,81) = 0.45, p = 0.721), age × ROI (F(3,81) = 1.02, p = 0.398), or treatment × age (F(1,27) = 1.36, p = 0.254). See Supplementary Table 12 for descriptive statistics.
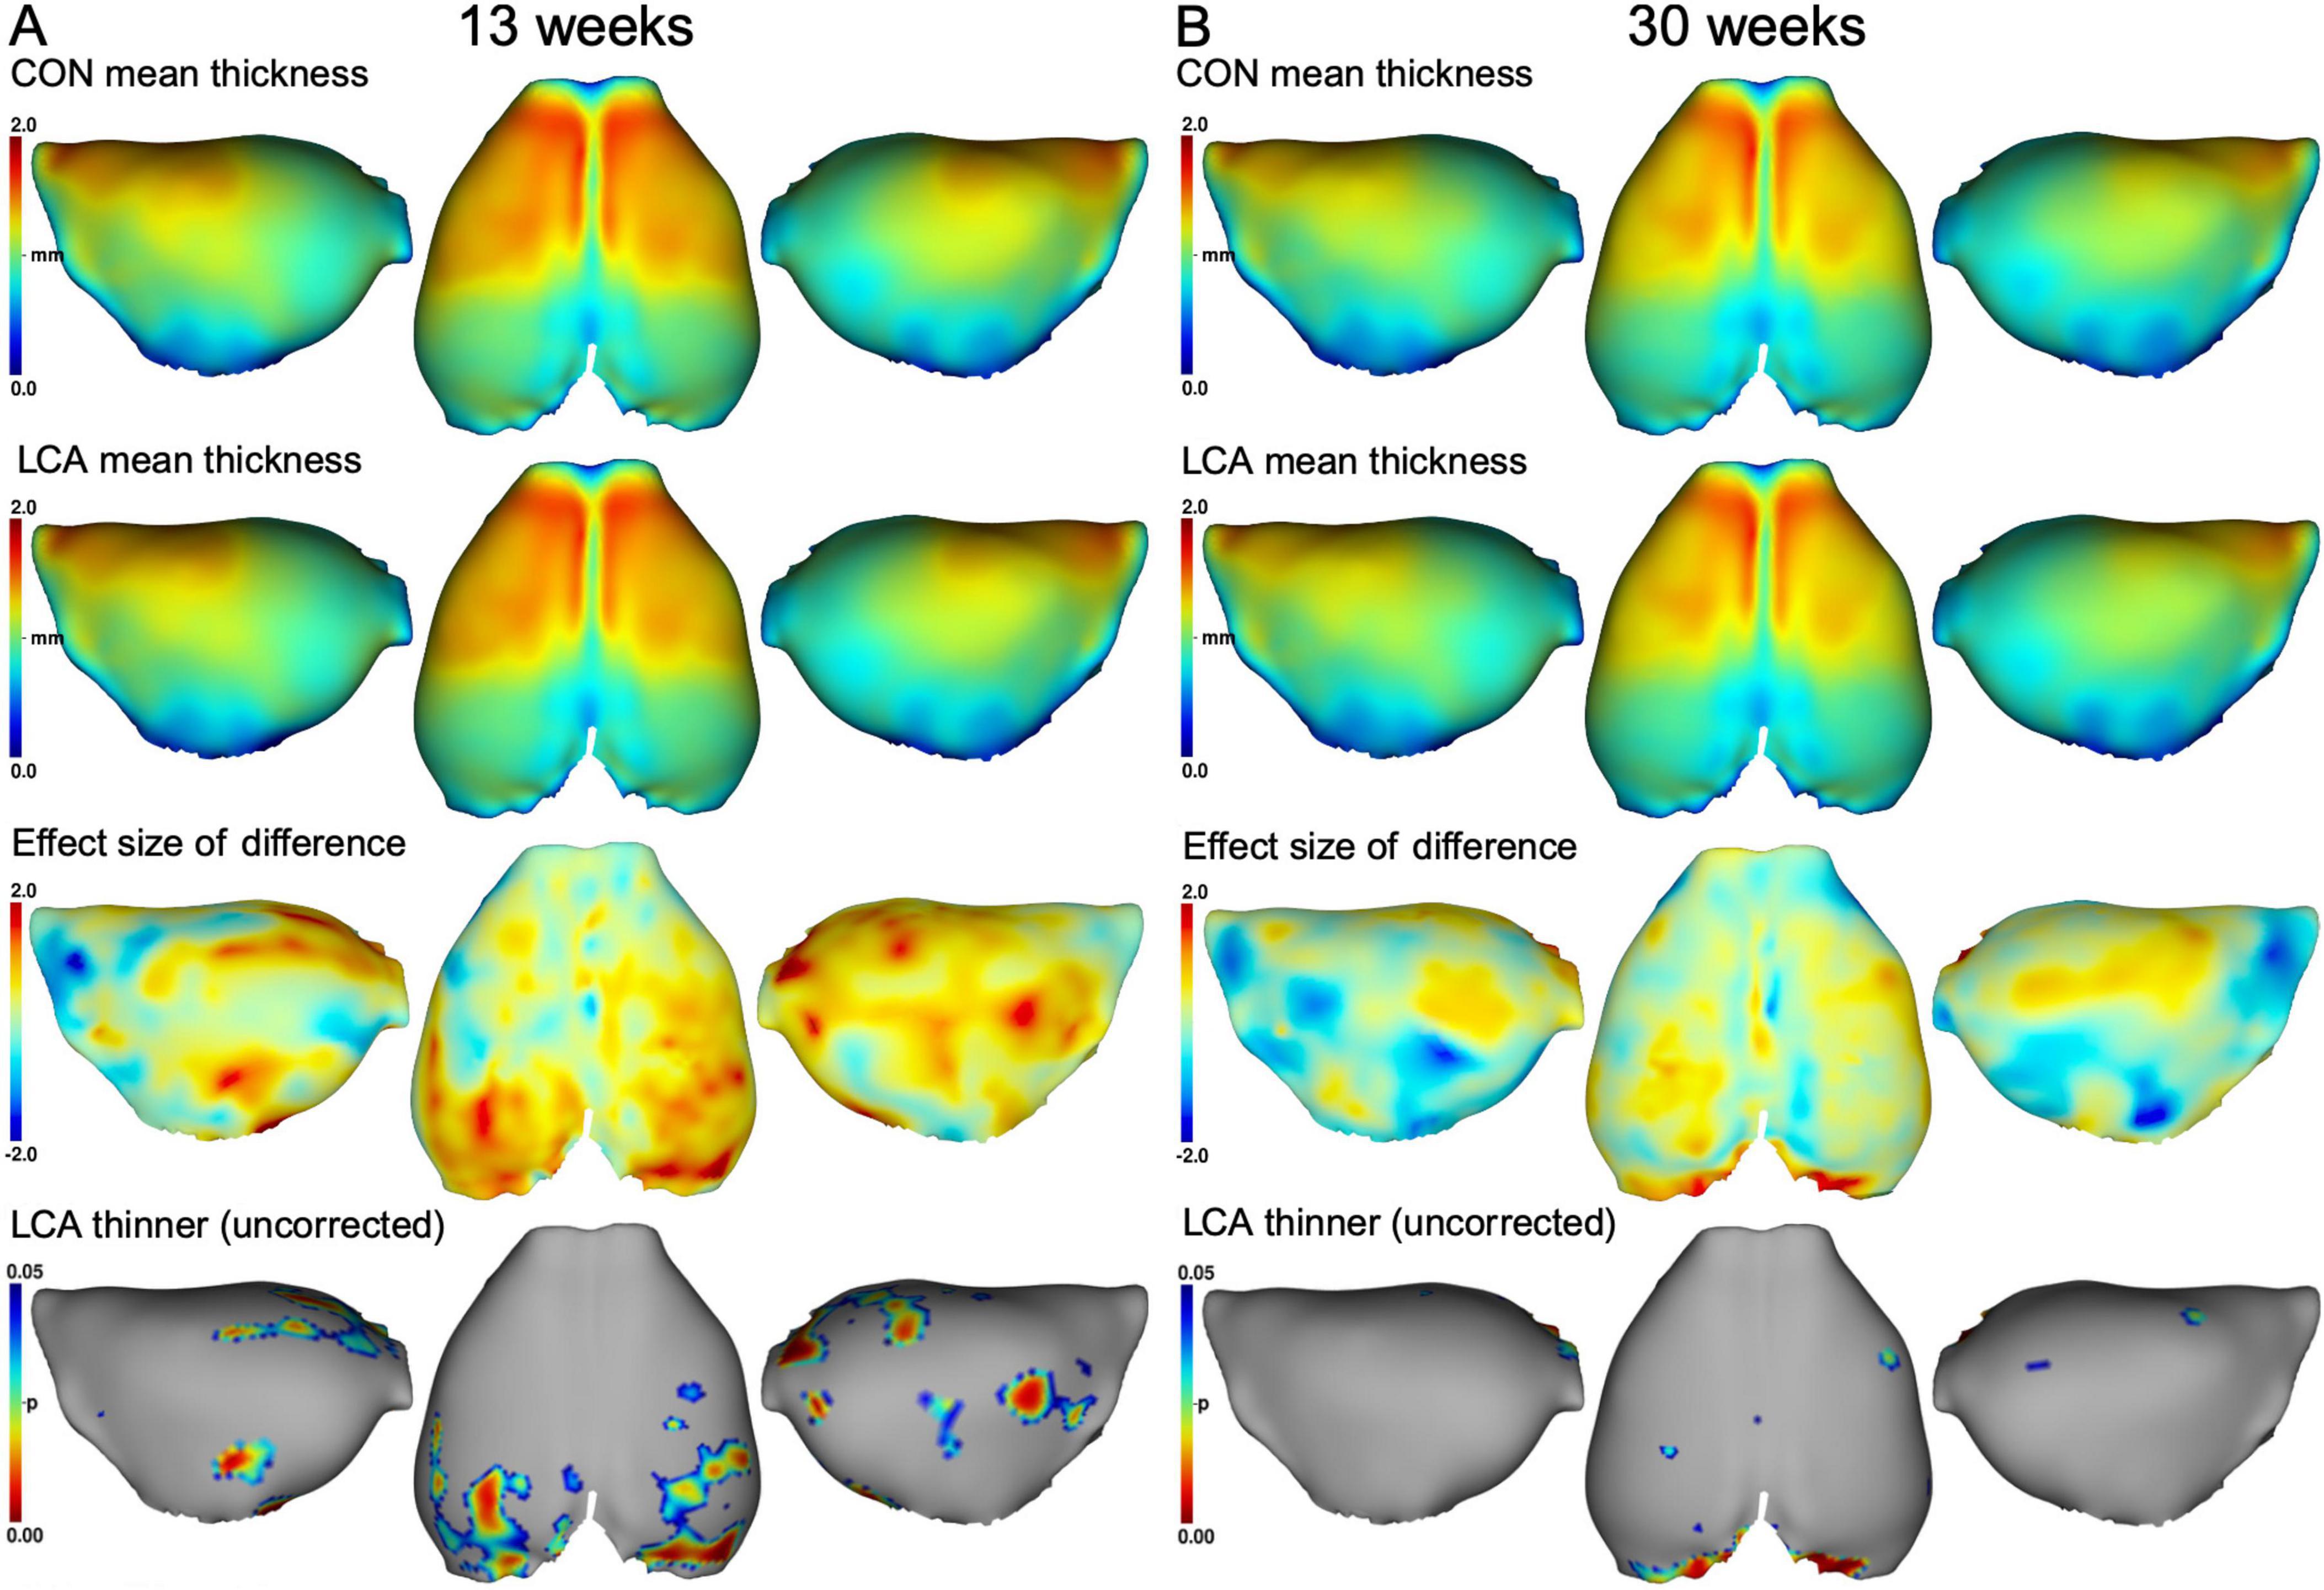
Figure 8. Mean cortex thickness maps in mm of panel (A) 13 weeks brains and (B) 30 weeks brains. First row: Group mean thickness of the CON groups. Second row: Group mean thickness of the LCA groups. Third row: Effect size of the differences between group means in the upper two rows (CON minus LCA). Fourth row: p-maps of where the LCA groups have thinner cortex, thresholded at 0.05 before correcting for multiple comparisons. No significant difference was observed after correction (see Supplementary Figure 14). See Supplementary Figure 13 for mean cortex thickness of each cortex ROI in all groups and Supplementary Table 12 for descriptive statistics.
3.3.3 Mean kurtosisThe diffusion MRI-derived indices of tissue water mobility (MD), anisotropy (FA), and microstructural complexity (MK) were compared for all groups. See Supplementary Figures 15–18 for examples of DKI maps for a coronal slice in each metric and animal.
In general, we observed a decline in the MK with age within all ROIs (Figure 9). While the LCA groups exhibited reduced MK compared to the CON groups, this downward shift was not significant. The three-way mixed permutation ANOVA unveiled a significant main effect of age (F(1,26) = 29.28, p < 0.000) and ROI (F(7,182) = 555.08, p < 0.000), as well as their interaction (F(7,182) = 4.25, p < 0.000), while the remaining terms (treatment: (F(1,26) = 1.42, p = 0.246), treatment × age: (F(1,26) = 0.09, p = 0.772), treatment ROI: (F(7,182) = 1.10, p = 0.362), and treatment × age × ROI (F(7,182) = 0.79, p = 0.602) yielded no significant findings. The post hoc test of significant age × ROI simple main effects analysis revealed age differences in amygdala (p < 0.000, 95% CI [0.074, 0.130]), hippocampus (p < 0.000, 95% CI [0.101, 0.138]), thalamus (p < 0.000, 95% CI [0.101, 0.138]), hypothalamus (p < 0.000, 95% CI [0.101, 0.138]), basal forebrain septum (p < 0.000, 95% CI [0.101, 0.138]), inferior colliculi (p < 0.000, 95% CI [0.060, 0.153]), neocortex (p < 0.000, 95% CI [0.052, 0.084]), midbrain (p < 0.000, 95% CI [0.038, 0.160]), thalamus (p < 0.000, 95% CI [0.112, 0.209]). See Supplementary Table 13 for descriptive group statistics.
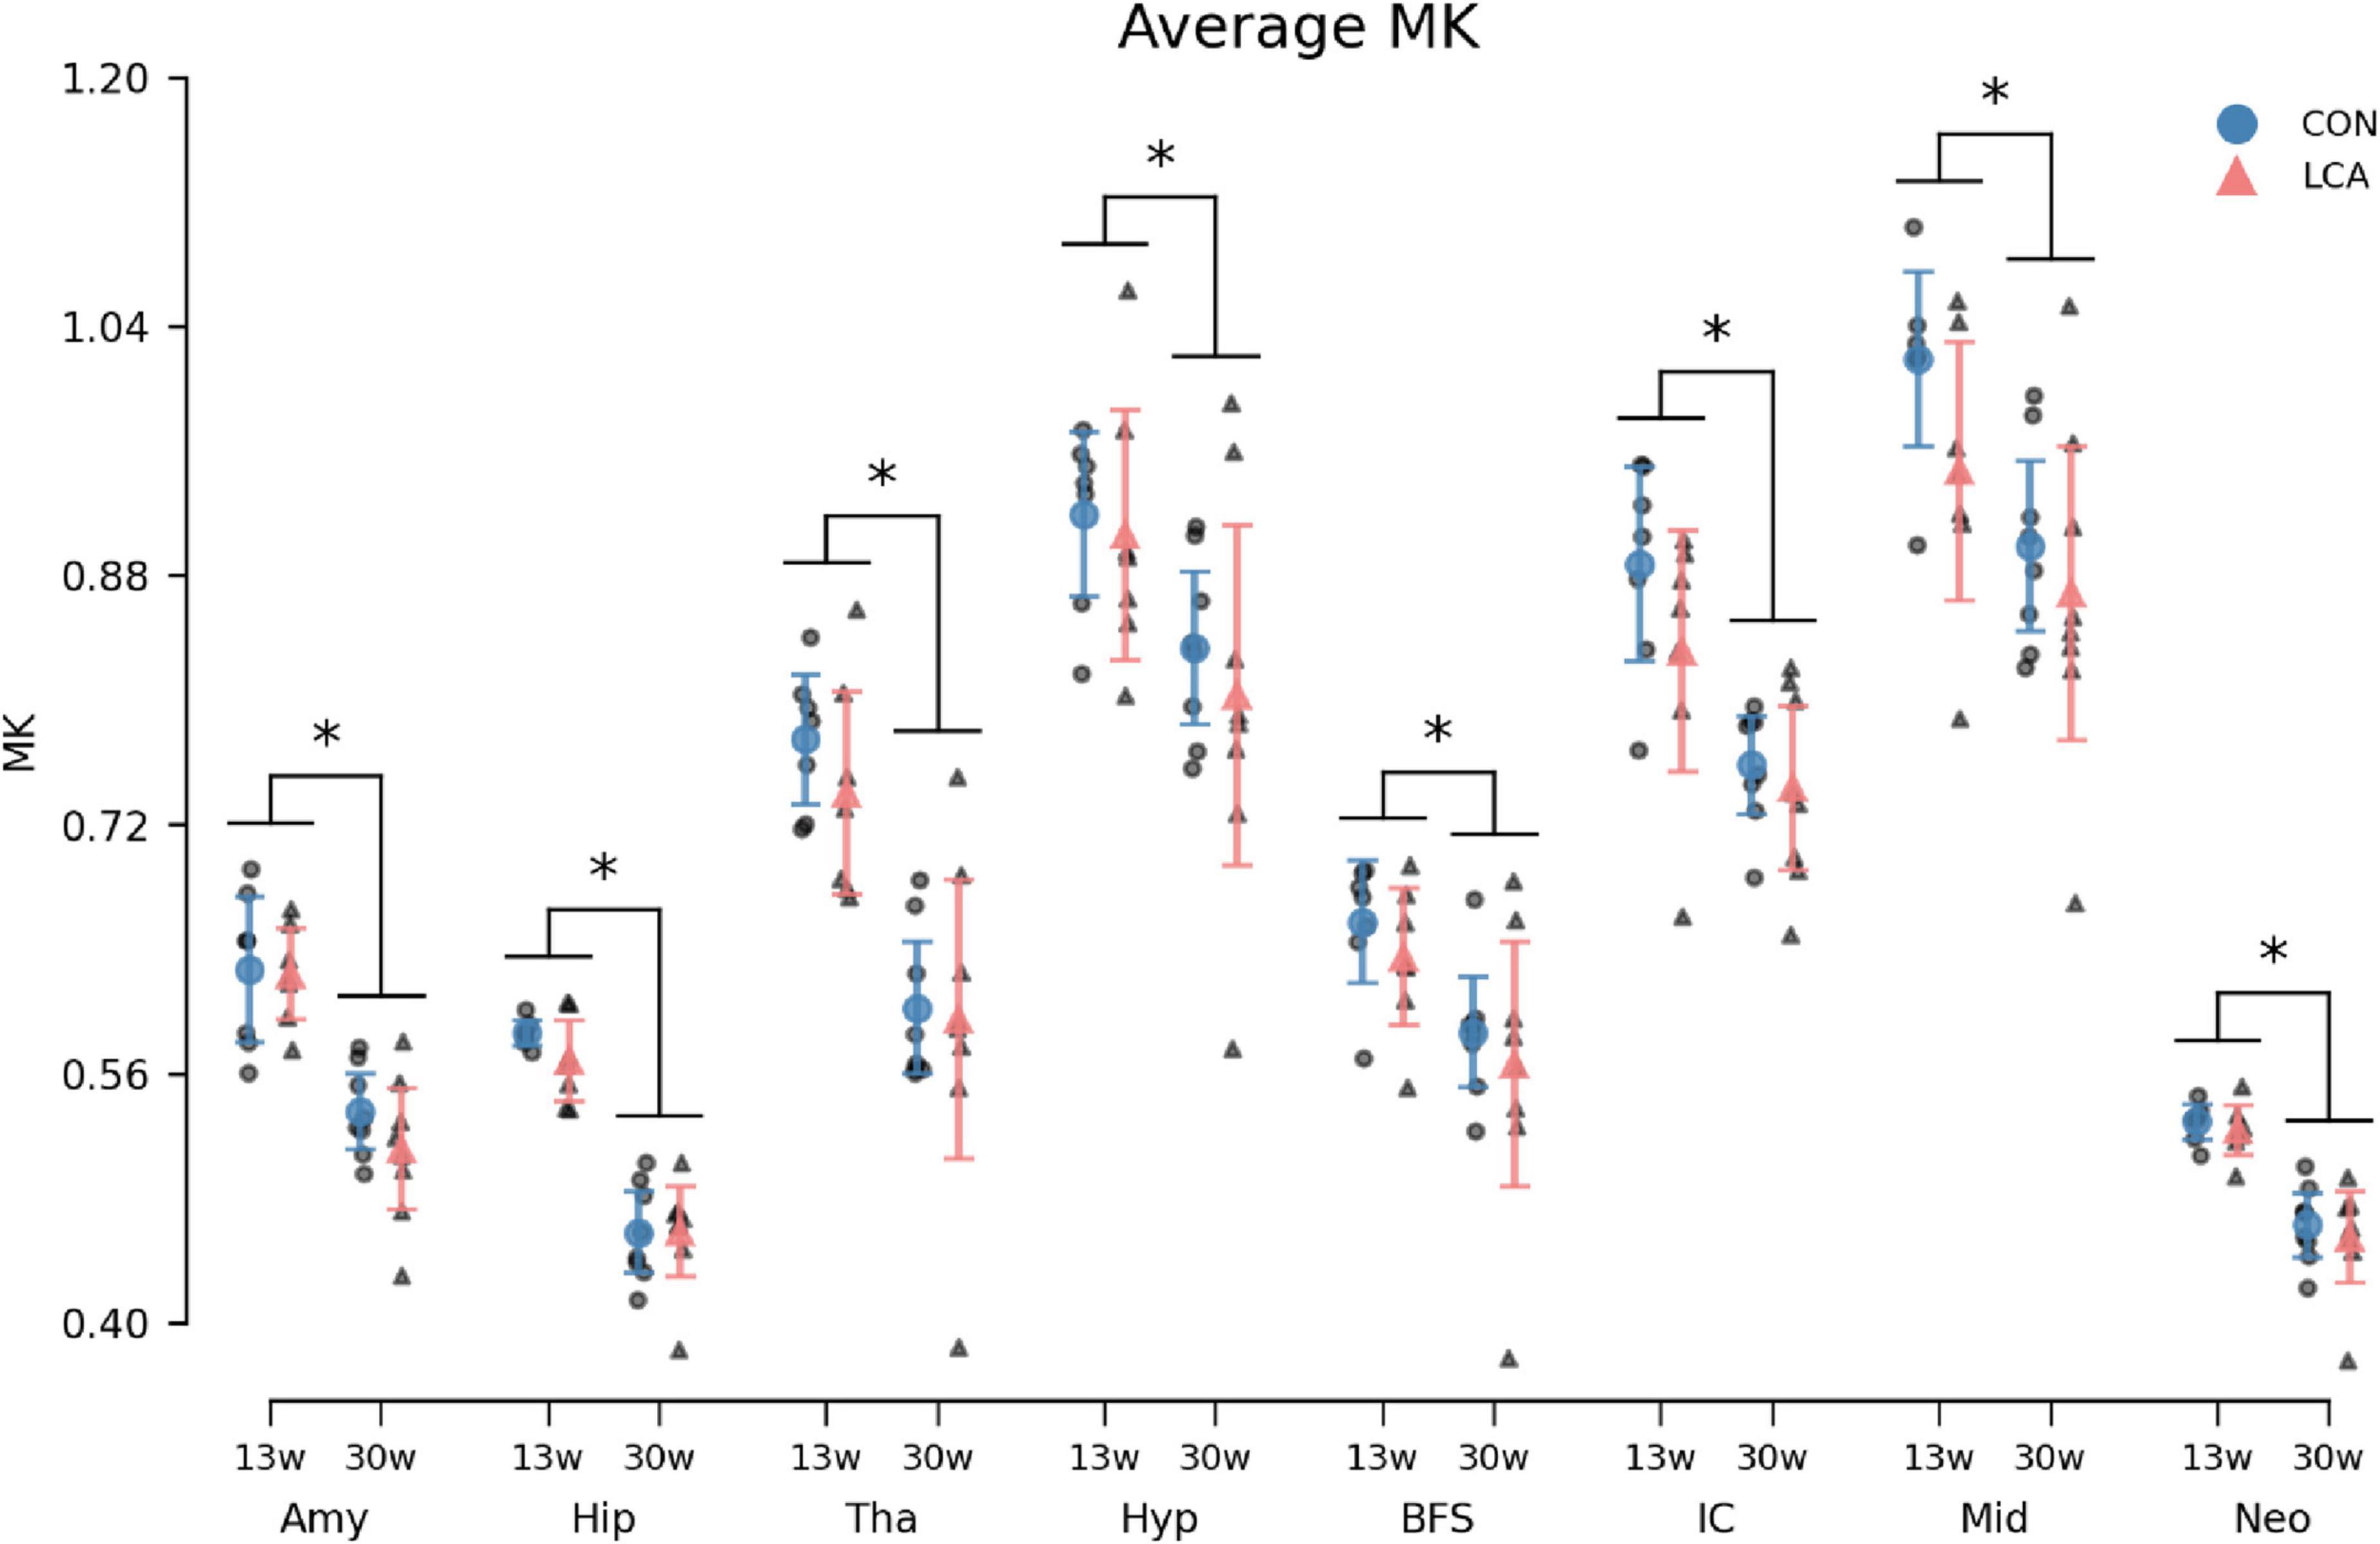
Figure 9. Average MK in the eight ROIs for each of the four groups. Group means with 95% CI are superimposed on the individual observations. In all ROIs, an age-related decrease in MK was observed, but no difference was seen between treatment groups. See Supplementary Table 13 for descriptive statistics. 13w, 13 weeks old; 30w, 30 weeks old; Amy, amygdala; hip, hippocampus; tha, thalamus; hyp, hypothalamus; BFS, basal forebrain septum; IC, inferior colliculi; neo, neocortex; mid, midbrain; tha, thalamus. *Age difference (p < 0.05).
3.3.4 Mean diffusivityMD increased by the age in all ROIs (Figure 10). However, no difference emerged between the LCA and CON groups. The outcomes of the three-way permutation ANOVA revealed the same significant terms as for the MK, encompassing age (F(1,26) = 28.23, p < 0.000), ROI (F(7,182) = 2354.00, p < 0.000), and their interaction (F(7,182) = 10.02, p < 0.008). No significant difference was observed for treatment (F(1,26) = 0.00), p = 0.97), treatment × age (F(7,182) = 0.00, p = 0.985), and the treatment × age × ROI (F(7,182) = 0.71, p = 0.669). The post hoc test of significant age × ROI simple main effects analysis revealed age differences in the amygdala (p < 0.000, 95% CI [−0.022, −0.010]), hippocampus (p < 0.000, 95% CI [−0.021, −0.011]), thalamus (p < 0.000, 95% CI [−0.023, −0.009]), hypothalamus (p < 0.000, 95% CI [−0.027, −0.013]), basal forebrain septum (p < 0.000, 95% CI [−0.024, −0.009]), inferior colliculi (p < 0.000, 95% CI [−0.031, −0.017]), neocortex (p < 0.000, 95% CI [−0.018, −0.006]), midbrain (p < 0.000, 95% CI [−0.032, −0.018]), and thalamus (p < 0.000, 95% CI [−0.023, −0.009]). See Supplementary Table 14 for descriptive group statistics.
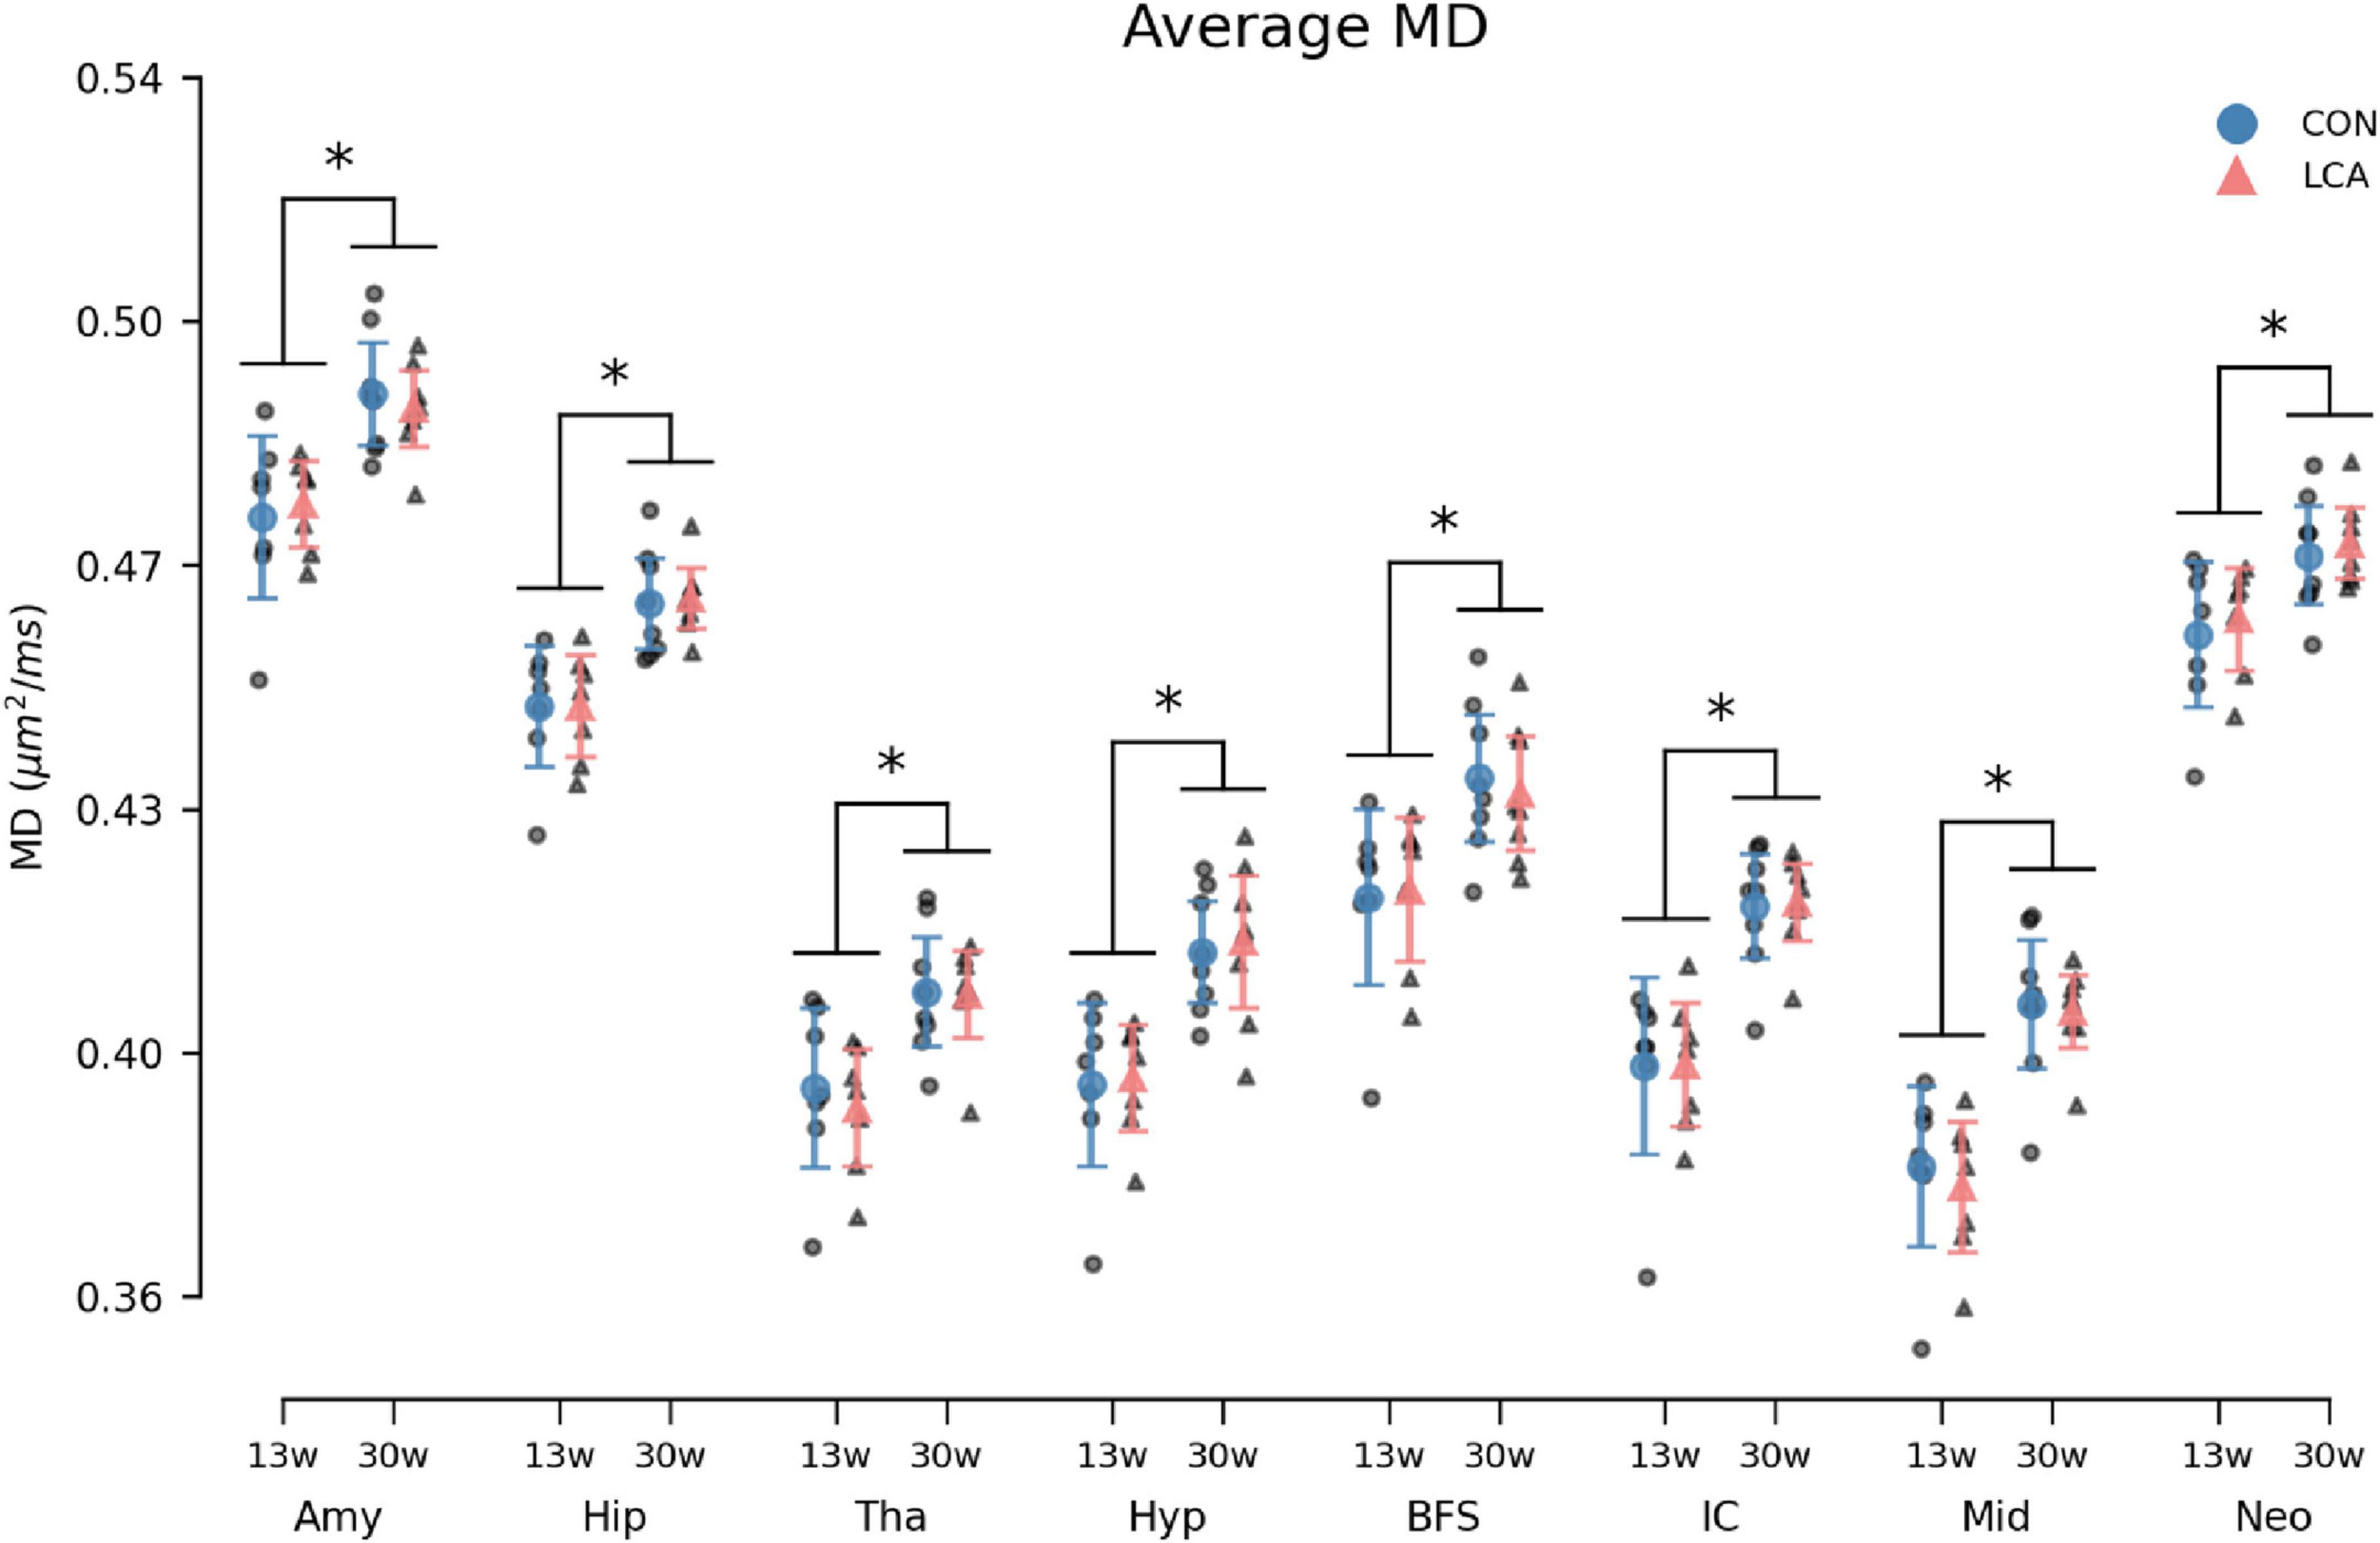
Figure 10. Average MD in the eight ROIs for each of the four groups. Group means with 95% CI are superimposed on the individual observations. Within all ROIs, the MD increases with age, but no differences are observed between the LCA and CON groups of the same age. See Supplementary Table 14 for detailed descriptive statistics. 13w, 13 weeks old; 30w, 30 weeks old; Amy, amygdala; hip, hippocampus; tha, thalamus; hyp, hypothalamus; BFS, basal forebrain septum; IC, inferior colliculi; neo, neocortex; mid, midbrain; tha, thalamus. *Age difference (p < 0.05).
3.3.5 Fractional anisotropyThe FA showed concordant trends with the MK and the MD by exhibiting an age-related difference within the ROIs but with no difference between the treatments (Figure 11). The three-way permutation ANOVA found significant terms for age (F(1,26) = 46.35, p < 0.000), ROI (F(7,182) = 204.00, p < 0.000), and their interaction (F(7,182) = 6.59, p < 0.000). The treatment (F(1,26) = 0.07), = p = 0.793), treatment × age (F(7,182) = 0.00, p = 0.968), treatment × age × ROI (F(7,182) = 0.26, p = 0.971) revealed no significant effects. The post hoc test of significant age × ROI simple main effects analysis revealed age differences in amygdala (p < 0.000, 95% CI [0.025, 0.052]), hippocampus (p < 0.000, 95% CI [0.042, 0.057]), thalamus (p < 0.000, 95% CI [0.026, 0.047]), basal forebrain septum (p < 0.004, 95% CI [0.014, 0.037]), inferior colliculi (p < 0.004, 95% CI [0.005, 0.018]), neocortex (p < 0.000, 95% CI [0.034, 0.047]), midbrain (p < 0.000, 95% CI [0.028, 0.057]), thalamus (p < 0.000, 95% CI [0.026, 0.047]). See S
留言 (0)