Cardiorespiratory fitness (CRF) is the capacity of the circulatory and respiratory systems to deliver oxygen to skeletal muscles during physical activity and is widely recognized as one of the strongest predictors of survival in the general population (1–3). In clinical practice, CRF is usually measured by peak oxygen consumption (VO2peak), which is typically indexed to total body mass, i.e., VO2peak/mass (Figure 1A) (1).

Figure 1. Generalized oxygen consumption equation and body compartments for scaling. (A) The generalized equation for peak oxygen consumption with a constant representing the metabolic equivalent at rest; a mass term, which would ideally reflect the energetic mass; and a “workload term,” which reflects absolute exercise intensity. (B) Illustrated criteria for body size-independent scaling and calibration among the subgroups. (C) Body mass can be assessed using different compartments. LBM measures the specific tissue compartment after the exclusion of the FM and bone mineral content. BCM measures the overall cell mass of the body, usually with K isotope methods. Both LBM and BCM better relate to the metabolically active tissue. (D) Summary of the aims of the study.
While indexing VO2peak to total body mass partially adjusts for body size differences, it does not fully account for variations in metabolically active tissue or differences in body composition. In fact, studies have shown that indexing to total body mass underestimates CRF in women, older adults, and individuals with obesity (4, 5). An ideal metric for scaling VO2peak would provide unbiased CRF estimates after accounting for differences in exercise capacity (6). Practically, this is tested by assessing the relationship between indexed VO2peak and body size (Figure 1B). To improve VO2peak indexing, several approaches have been considered including allometric scaling (body sizea, where a is an exponent), the use of different body compartments, or a combination of both approaches. At the molecular level, the body can be divided into lean body mass (LBM), fat mass (FM), and mineral content; at the cellular level, the body is divided into body cell mass (BCM), extracellular solids, extracellular fluids, and fat (Figure 1C) (5, 7). Compared to LBM, BCM better accounts for age-related increases in extracellular solids or fluids, which are generally not metabolically active (5, 7).
Evidence for allometric scaling of total body mass or LBM comes from both animal and clinical studies. In a 1981 study, Taylor et al. found that maximal VO2 scales allometrically with body mass, with an exponent of 0.79 (95% CI: 0.75–0.83) in wild animals and 0.77 (95% CI: 0.68–0.85) in domestic animals (8). In a recent meta-analysis of 36 studies involving 6,514 participants, Lolli et al. reported that the pooled allometric exponent for indexed aerobic capacity was 0.70 (95% CI: 0.64–0.76) for total body mass and 0.90 (95% CI: 0.83–0.96) for fat-free mass (9). In the DR's EXTRA study, Krachler et al. also confirmed that VO2peak scales more closely to LBM compared to total mass and Kohler et al. showed the potential added benefit of BCM-based scaling (5).
Although the allometric studies showed that scaling to mass0.70 provided better body size independence than indexing to total body mass, we hypothesized that including height, sex, and age in the allometric scaling would better account for metabolically active tissue. Therefore, the first objective of this work was to develop and validate a body size-independent scaling metric for VO2peak. Here, we introduce a novel metric, referred to as exercise body mass (EBM) that includes mass, height, age, and sex factors (Figure 1D). Building on the EBM concept, our second objective was to develop a well-calibrated workload (WL) equation that not only adjusts for treadmill speed (Sp) and fractional grade (fGr) (10) but also for heart rate reserve (HRR) (11). Integrating the two equations, we derived and validated a generalized VO2peak equation expressed as constant × EBM × WL, where the constant represents one metabolic equivalent of task (MET). The calibration of this equation was compared to the standard equation VO2peak = 3.5 × mass × WL across the spectrum of age, sex, and body mass index (BMI). Finally, we determined whether the calibration for the generalized equation also holds in patients with heart failure (HF), as these patients often have sarcopenia or frailty (12).
2 Materials and methods 2.1 Study cohortsThis study included two exercise cohorts, i.e., the Fitness Registry and the Importance of Exercise National Database (FRIEND) registry (13) and the Stanford exercise testing (SET) registry (14). A third cohort, the Diet Intervention Examining the Factors Interacting with Treatment Success (DIETFITS) (15), was used to determine associations between EBM and directly measured LBM.
The FRIEND registry is a multi-institutional initiative established in 2014 with a primary goal of establishing reference CRF values in the United States across the adult life span (13). Cardiopulmonary exercise testing (CPX) laboratories from California, Connecticut, Indiana, Illinois, Louisiana, Maryland, North Carolina, Tennessee, and Texas contributed data to the registry (16). The procedures used for acquiring and managing the FRIEND registry data have been previously reported (17, 18). In brief, all the CPX laboratories contributing data to the FRIEND registry used valid and reliable calibration and testing procedures, and experienced personnel qualified to conduct exercise tests to maximal exertion (17). For the current study, participants who completed a graded exercise treadmill test with a peak respiratory exchange ratio (RER) ≥1.0, age ≥18 and ≤79 years, and BMI between 18.5 and 40 kg · m−2 were considered for inclusion. To select an apparently healthy group, participants with cardiovascular disease (CVD), HF, chronic lung disease, chronic kidney disease (CKD), chronic liver disease, endocrine disorders, neurological disorders, or diabetes mellitus were excluded.
The SET registry includes individuals who underwent CPX at Stanford University Medical Center since April 2007. Stanford's CPX personalized ramp is based on an initial assessment of the Veterans Specific Activity Questionnaire (VSAQ) (19). For the validation cohort, we selected two groups of individuals: (1) a lower-risk group without a diagnosis of CVD or HF with an age-predicted CRF >80% according to the Wasserman formula and a minute ventilation/carbon dioxide production (VE/VCO2) slope <32 (n = 198); and (2) patients with HF or cardiomyopathy (n = 1,339).
The DIETFITS was a randomized controlled weight loss trial comprising 609 participants assigned to either healthy low-carbohydrate or healthy low-fat diets (15). Dual-energy x-ray absorptiometry (DXA) scans were performed on 466 participants at the baseline visit using a Hologic QDR-4500 W fan-beam scanner (Bedford, MA, USA) based on the manufacturer's guidelines. A three-compartment model quantifying LBM, fat mass, and bone mineral content was used.
2.2 Data collectionFor each cohort, data collection included demographics (age, sex, and race), vital signs (blood pressure and heart rate), and anthropomorphic data (height, body mass, and BMI). Exercise variables included Sp, fGr, HRR, and VO2peak (measured using open-circuit spirometry). The literature-based WL was calculated using Kokkinos et al.’s formula derived from the FRIEND registry: VO2peak = Mass (kg) × [Sp (m/min) × (0.17 + fGr × 0.79) + 3.5] divided by one MET (∼3.5 ml O2 · kg−1 · min−1 (10).
2.3 Statistical analysesThe analyses were performed using Python 3.10. Continuous variables were presented as mean and standard deviation (SD) or interquartile range as appropriate and categorical variables as percentages. Upset plots were used to present the prevalence of co-morbidities in the FRIEND registry. For regression analyses, linear multivariable backward-weighted regression was used, in which variables with p > 0.05 were removed sequentially. For the log-linear modeling, the natural logarithmic of VO2peak or mass and height were used and then transformed to their multiplicative expression.
2.3.1 Deriving EBM to index Vo2peak and its body compartment correlates 2.3.1.1 Deriving the EBM terms using a multivariable multiplicative modelThe natural logarithm (ln) of VO2peak was used as the dependent variable while the independent variables consisted of ln(mass), ln(height), sex, age terms (age, age2, and age3), Sp, fGr, and HRR. The coefficients obtained in this model were used to express EBM as Massa × Heightb × Male factor (ec) × exp(d × Age factor), where a, b, c, and d are coefficients. Interactions with sex were tested and retained if they significantly differed from a common allometric model. An approximation of the allometric EBM equation was also derived using weighted least square regression, where EBM was the dependent variable and mass, height, and age were the independent variables; such expression would be considered valid if it presents an R2 close to unity and minimal variance.
2.3.1.2 Testing body size independence for EBM scaling of Vo2peakBody size independence for scaling occurs when no significant relationship is observed between an indexed variable and the body size metric. Since VO2peak also depends on exercise intensity, we not only tested body size independence in the entire cohort but also in different WL categories and in men and women separately.
2.3.1.3 Biological plausibility of EBM assessment using body compartment correlatesThe DIETFITS has an age range of 20–50 years old and allows the testing of mass and height allometric coefficients as well as sex factor in this age range. Using the DIETFITS cohort, we assessed the linear relationship between EBM and LBM0.9 with an intercept at the origin. We chose an allometric coefficient of 0.9 for LBM based on the meta-analysis of Lolli et al. (9). To visualize whether EBM could theoretically approximate BCM, we converted EBM to EBM1.11 and plotted the resulting values over the age range; EBM was adjusted to a power of 1.11 (the inverse of 0.9) to provide an equivalent non-allometric expression of BCM. In this plot, we superposed the measured BCM values of the study of St-Onge et al. in healthy individuals with a BMI <35 (digitized curves from the original study) (20).
2.3.2 Deriving a novel WL equation based on EBM 2.3.2.1 Deriving a WL equation integrating external and internal factorsUsing VO2peak/EBM, we derived a WL equation using an additive linear backward regression, entering as independent variables the horizontal (Sp) and vertical (Sp × fGr) components (treadmill external factors) as well as the internal factor of HRR. A constant of 11 was used as the equivalent of 1 MET assuming a height for men of 1.75 m and a BMI of 25 kg · m−2 (i.e., 76.6 kg); this constant was derived by assuming 1 MET was equivalent to 3.5 ml · min−1 · kg−1, dividing by the EBM formula and an age of 20 years old, and rounding to the closest integer (more details in Supplementary Methods).
2.3.2.2 Calibration between CRF and WL among different subgroups according to age, sex, and BMI, and external validationWe tested the calibration of the generalized equation in subgroups according to age, sex, and BMI by evaluating the mean slope between VO2peak and the VO2peak generalized equation (11 × EBM × WL). Radar plots were used to present the average slope according to age (<40, 40–60, >60 years) and BMI (<25, 25–30, >30 kg · m−2) in men and women. A slope of 1 indicates a good calibration; a slope >1 represents a higher VO2peak index than the WL estimates of CRF while a slope <1 represents a lower VO2peak index than the WL estimates of CRF. The equation was then tested externally in the SET registry in patients without HF and within the CRF range according to the Wasserman formula.
2.3.3 Quantifying the difference in CRF when scaling to total body mass or EBMWe compared the differences between VO2peak indexed to total body mass or that indexed to the EBM standard in the men and women (BMI < 25 kg · m−2), normal weight and obese (BMI < 25 vs. >30 kg · m−2), and younger and older age (<40 vs. >60 years) subgroups. The effect size was measured using relative mean ratios (%) and the Cohen's D effect size. Partition plots were used to visualize VO2peak indexed to total body mass or EBM, with values standardized for one MET. For total body mass, the constant used was 3.5 ml · min−1 · kg−1 and for EBM, the constant was 11.
2.3.4 The CRF/WL ratio in patients with HFIn the patients with HF or cardiomyopathy from the FRIEND registry, the VO2peak index may be lower than WL due to the influence of anaerobic metabolism, sarcopenia, or fluid overload. We, therefore, assessed the average slope VO2peak/WL relationship in patients with HF. We also validated the average underestimation in the SET registry.
3 Results 3.1 The FRIEND cohortA total of 5,618 individuals met the inclusion criteria for the apparently healthy group (Figure 2) and 7,240 patients with CVD were included, of which 1,007 had a diagnosis of HF. The most common co-morbidities were CVD (52.6%) followed by diabetes mellitus (11.9%) and pulmonary disease (5.2%) (Supplementary Figure S1). The characteristics of the FRIEND cohort are presented in Table 1. In the apparently healthy individuals, the average age was 44 ± 13 years, with 57% men and a mean BMI of 26 ± 4 kg · m−2. The mean RER was 1.17 ± 0.10, with a percentage age-predicted heart rate (21) of 100 ± 7% and VO2peak of 35.6 ± 10.6 ml · kg−1 · min−1. When compared to the apparently healthy group, the individuals with CVD were older, had higher BMIs, and had lower VO2peak values.
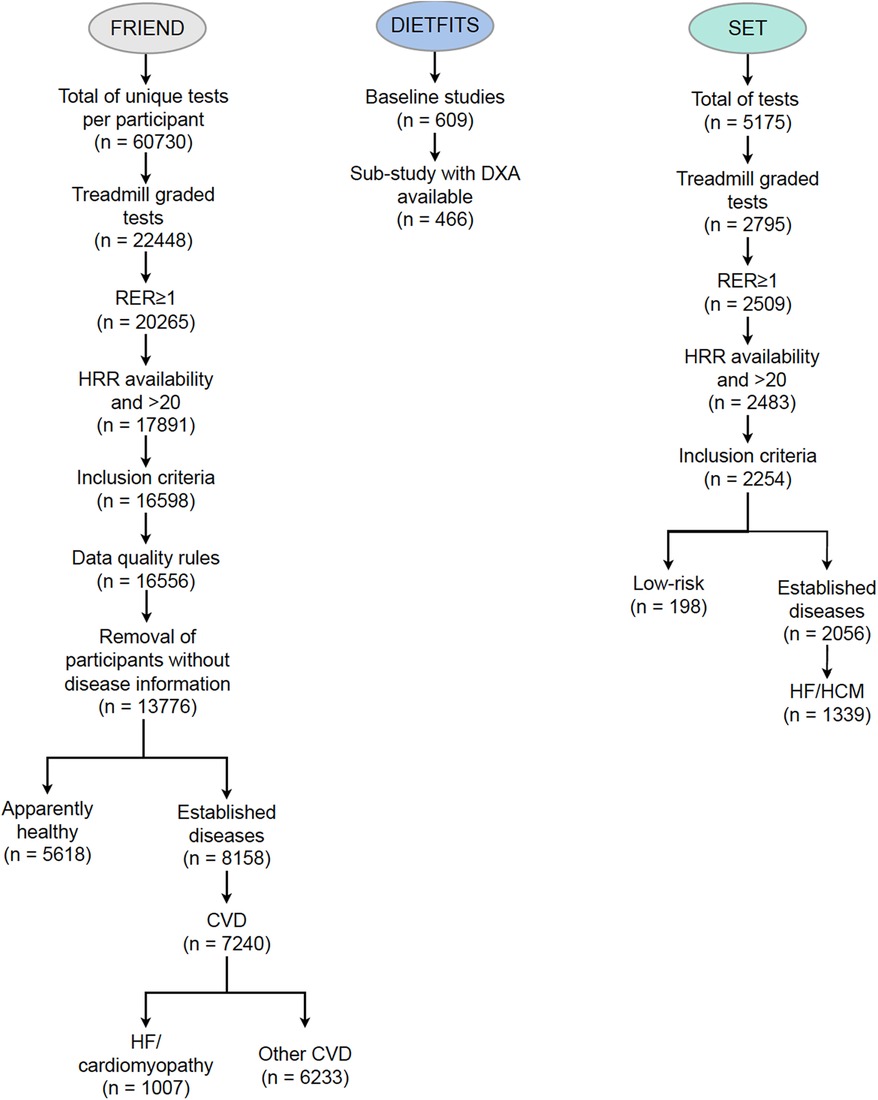
Figure 2. Consort diagram for the FRIEND (derivation cohort), SET (external validation cohort), and DIETFITS (contextualization cohort) datasets. CVD, cardiovascular disease; DIETFITS, Diet Intervention Examining the Factors Interacting with Treatment Success; DXA, dual-energy x-ray absorptiometry; FRIEND, Fitness Registry and the Importance of Exercise National Database; HCM, hypertrophic cardiomyopathy; SET, Stanford exercise testing.
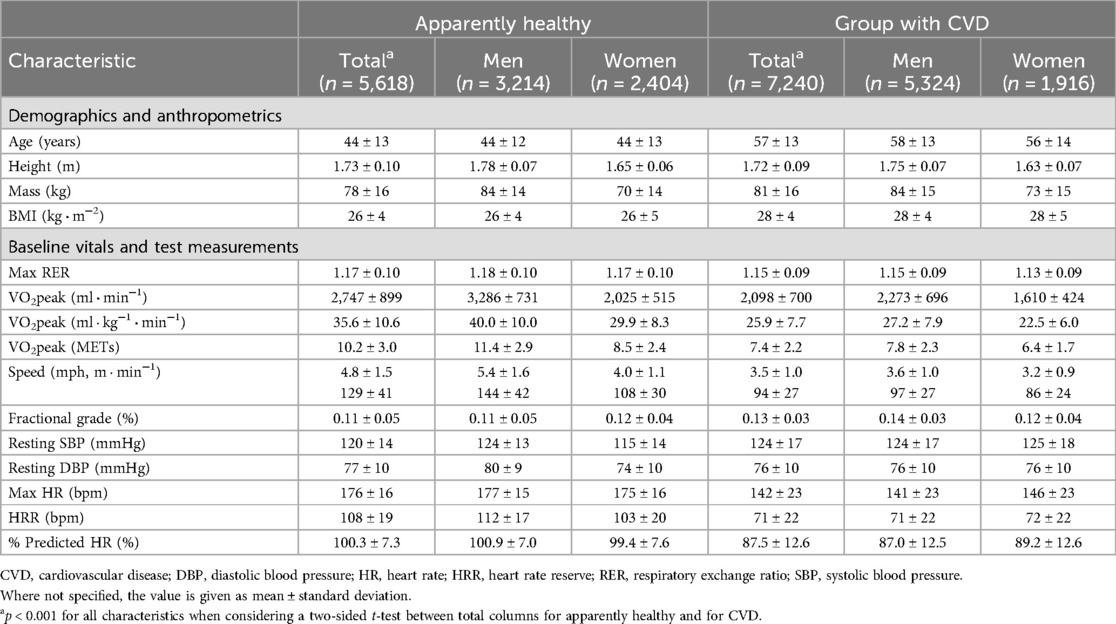
Table 1. Clinical characteristics of the FRIEND population.
3.2 Deriving EBM for indexing Vo2peak and showing its clinical implications 3.2.1 Deriving the EBM equationThe multivariable model allowing the derivation of EBM terms had a coefficient of determination of 0.83, P < 0.001, with normally distributed residuals (Supplementary Figure S2). Considering fAge = Age/100, EBM was expressed as (Figure 3):
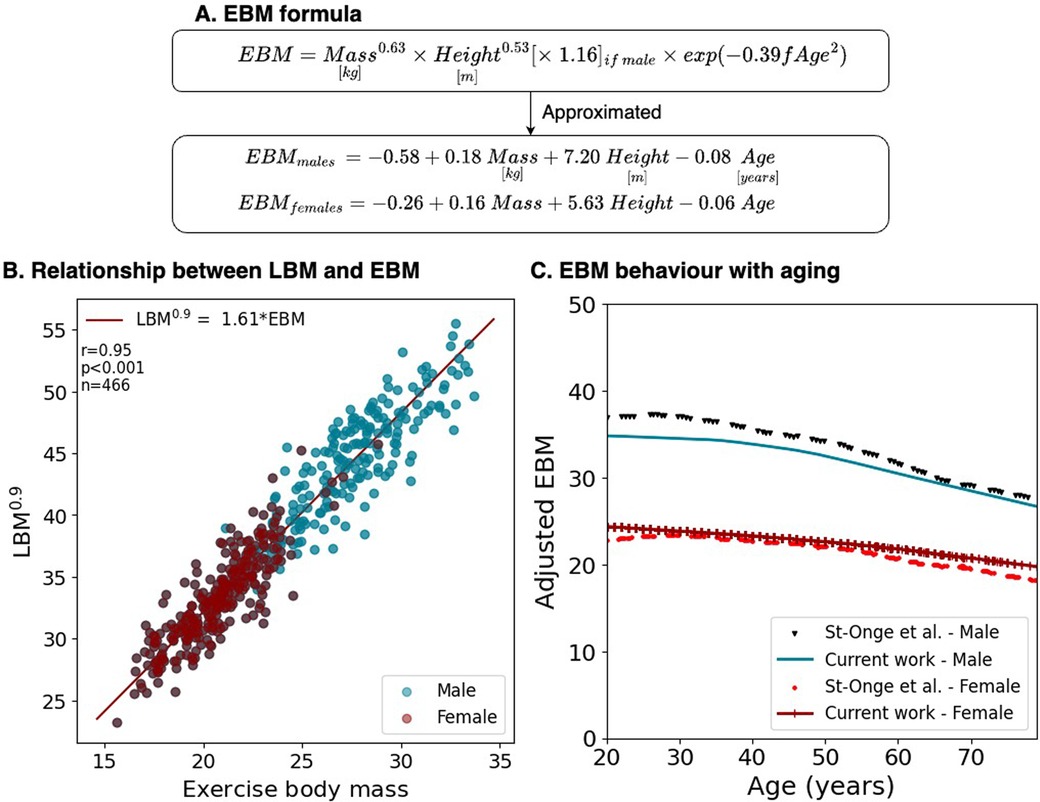
Figure 3. EBM compared to measured values. (A) Formulation considering mass and height allometries, sex, and fractional age (fAge = Age/100). (B) The relationship between EBM and LBM in DIETFITS. (C) Adjusted EBM behavior with aging compared to measured BCM.
EBM=Mass(kg2)0.63×Height(m2)0.53×1.16(ifmale)×exp(−0.39×fAge2)This equation can be approximated to the following additive with a correlation close to 1 and minimal residuals (Supplementary Figure S3):
EBMmales=−0.58+0.18Mass(kg)+7.20Height(m)−0.08Age
EBMfemales=−0.26+0.16Mass(kg)+5.63Height(m)−0.06Age
3.2.2 Testing body size independence for EBM indexing of Vo2peakScaling to EBM provided body size-independent scaling of VO2peak with no relationship with EBM (p < 0.01) (Table 2). In contrast, scaling to total body mass was significantly associated with the majority of WL intervals in men and women. When compared to scaling to Mass0.7, scaling to EBM resulted in lower absolute correlations with several intervals, particularly with 8–8.9 METs for men and with the 6–6.9 and 7–7.9 MET intervals for women.
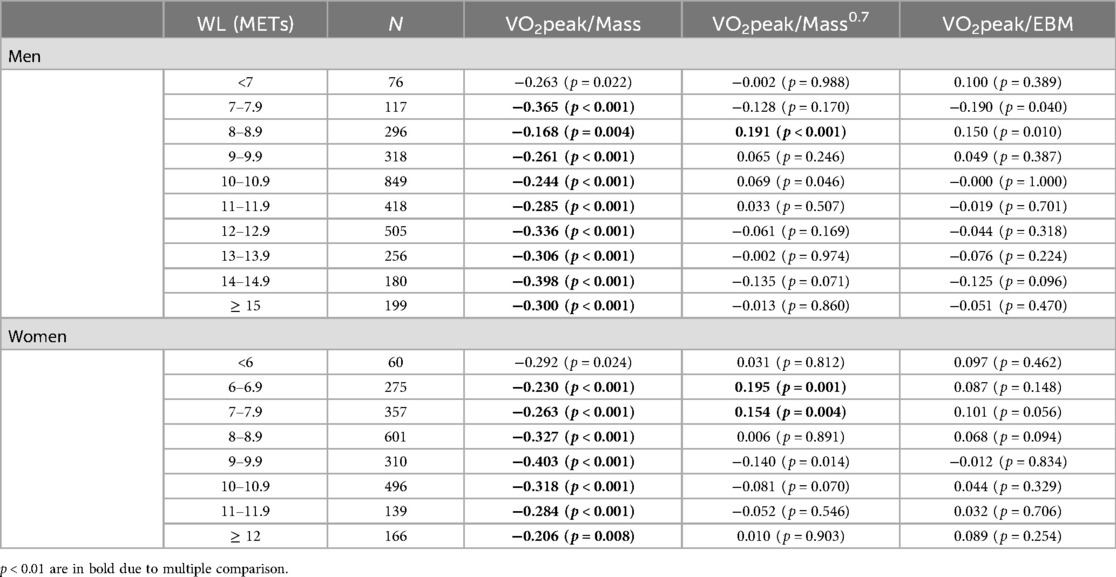
Table 2. Body size independence of VO2peak indexed to Mass compared to Mass0.7 and EBM in terms of correlation coefficients.
3.2.3 Biological plausibility of the EBM formulaThe characteristics of the DIETFITS cohort are summarized in Supplementary Table S1. The average age was 39 ± 7 years and the BMI ranged from 25 to 40 kg · m−2. A strong linear correlation was observed between LBM0.9 and EBM with r = 0.95, p < 0.001, where LBM0.9 = 1.61 · EBM with similar slopes for men and women (Figure 3). To determine whether the age factors in the EBM formula were biologically plausible, we superposed the EBM1.11 and BCM values over time from the study of St-Onge et al. (20) using isotope 40K (Supplementary Figure S4 for the raw data), as shown in Figure 3. This assumes that BCM would also scale to a power of 0.9 during treadmill exercise.
3.3 Deriving a new WL equation based on EBM 3.3.1 Deriving a WL equation integrating external and internal factorsUsing multivariable weighted regression, we derived the generalized equation of VO2peak expressed as VO2peak = 11 × EBM × WL, with the WL term given by
WL(METs)=2+Sp(mph)[1.06+5.22×fGr]+0.019×HRR(bpm).
The overall relationship between the observed and predicted VO2peak had an R2 of 0.85, p < 0.001. The WL formula based on EBM yielded, on average, a higher estimated WL than the one derived using Kokkinos et al.’s formula (WLKokkinos = 0.88·WLEBM) with higher values at a lower WL (Supplementary Figure S5).
3.3.2 Calibration between the observed and predicted Vo2peakRadar plots show the average calibration slope stratified according to the age, sex, and BMI subgroups for total body mass and EBM standards (Figure 4). These demonstrate better calibration when using the EBM-based generalized equations. Underestimation of CRF using VO2peak/total body mass for a given WL was worst (p < 0.001) in women, in older individuals, and in individuals with obesity.
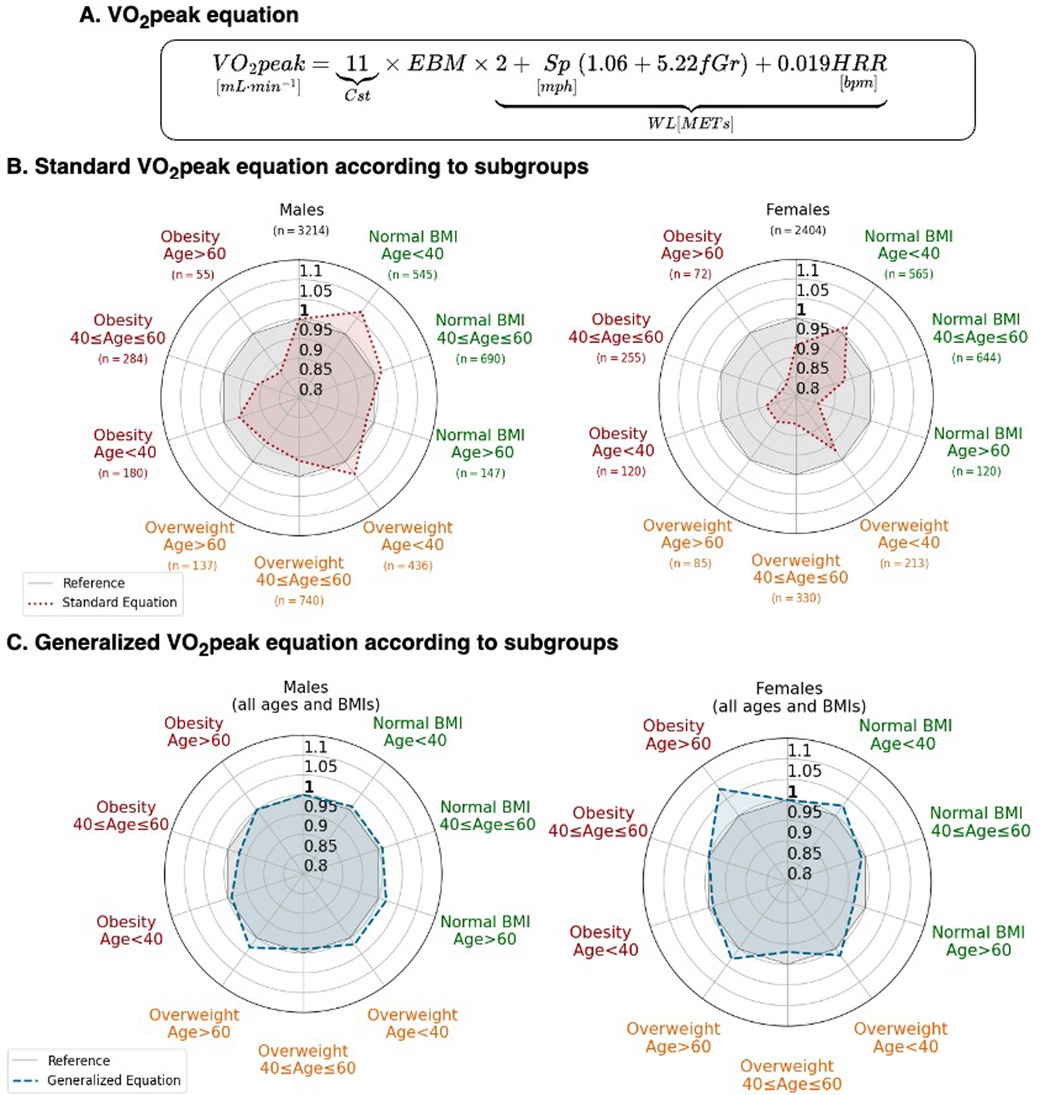
Figure 4. The generalized VO2peak equation based upon EBM. (A) Formulation considering EBM. (B) Predicted VO2peak standard equation (red) compared. (C) Predicted VO2peak allometric equation (blue). For both (B,C), values lower than 1 represent VO2peak overestimation by the equation, and greater than 1, an underestimation. The gray reference zone corresponds to a slope of 1. fGr, fractional grade; HRR, heart rate reserve; Sp, speed in mph.
3.3.3 Validation in the SET registryThe characteristics of the patients in the SET registry are presented in Supplementary Table S3. The equation was well-validated in the SET registry with an average slope of 1.0 (r = 0.92, p < 0.001) (Figures 5A,B). The subgroup analyses by sex, age, and BMI also demonstrate a well-calibrated equation (Supplementary Table S4).
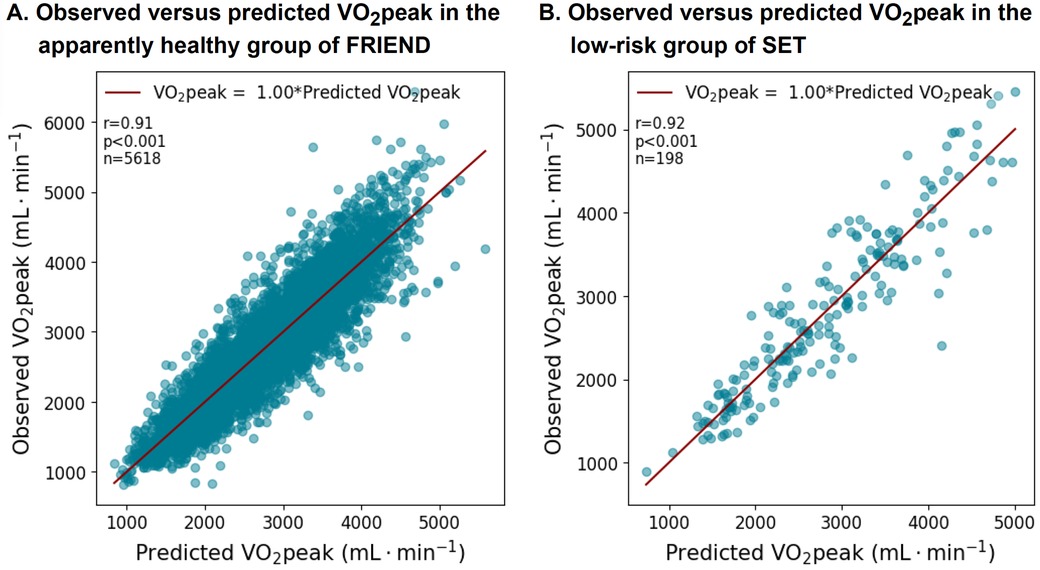
Figure 5. VO2peak equation performance in the apparently healthy subgroups from the FRIEND (derivation) and the SET registries (validation).
3.4 Quantifying the difference in CRF when using the total body mass or EBM standardThe partition plots of the VO2peak index for total mass or EBM (presented as METs) are presented in Figure 6. Smaller differences between men and women, older and younger, and obese and normal individuals were observed when using the EBM standard compared to the total mass standard (Figure 6, Supplementary Figure S6).
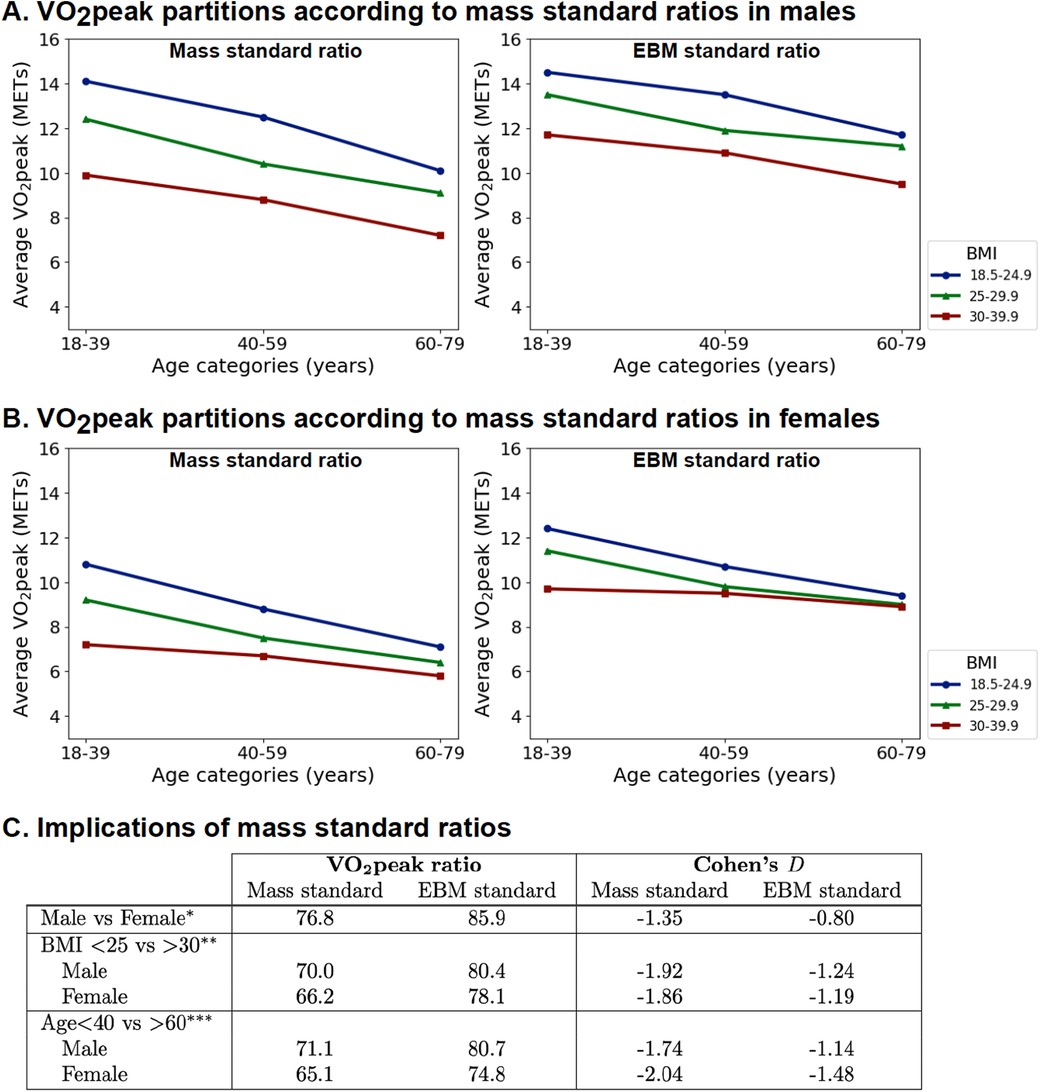
Figure 6. Indexing VO2peak to EBM instead of mass reduces age, sex, and BMI differences. (A) Partition analysis for men. (B) Partition analysis for women. (C) Comparison of mean VO2peak ratios and Cohen's D effect size (*BMI < 25 and age <40 years; **age <40 years; ***BMI < 25; comparison of all subgroups in Supplementary Figure S5).
3.5 The CRF/WL relationship in patients with HFIn both the FRIEND and SET registries, patients with HF had on average a lower slope compared to apparently healthy individuals as presented in Figure 7 and Supplementary Table S2. Supplementary Table S5 summarizes the main equations related to this work.
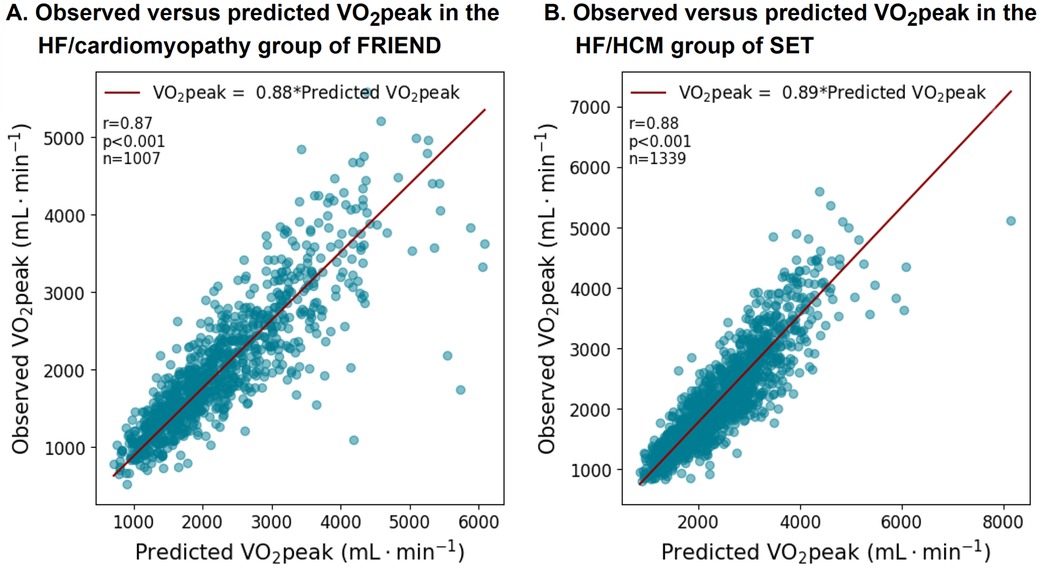
Figure 7. VO2peak equation performance in the patients with HF subgroups in the FRIEND (derivation) and SET registries (validation). The VO2peak to workload ratio was on average lower in the patients with HF.
4 DiscussionIn this study, we developed a body size-independent scaling factor for VO2peak. EBM provided body size-independent scaling with robust calibration across different ages, sexes, and BMI categories. This has important implications for accurate reporting of CRF in the general population. In addition, our novel WL equation incorporates HRR, which can provide better estimates of energy expenditure during treadmill exercise testing. Finally, we found that in patients with HF, VO2peak was often lower than the WL-predicted values, which may be due to an increased reliance on anaerobic metabolism, the presence of sarcopenia, or fluid overload.
Scaling plays a central role in comparative biology as it reduces differences associated with body size and composition (6). This is particularly relevant when comparing men and women, younger and older individuals, or individuals with normal weight and obesity. Several studies have shown that VO2peak scales to body size according to a log-linear relationship, providing the basis for allometric scaling (6, 8, 9, 22). In 1981, Taylor et al. conducted a landmark study to determine whether VO2max is scaled proportionally to mass (8). Their study included both domestic and wild animals spanning several orders of magnitude of mass (7.2 g–263 kg) and testing for VO2max following training sessions in all the animals. They found that VO2max scaled to 0.79 (0.75–0.83) in wild animals and to 0.77 (0.68–0.85) in domestic animals. In a recent meta-analysis of 36 studies involving 6,514 participants, Lolli et al. found that the pooled allometric exponent for indexed aerobic capacity was 0.70 (95% Cl of 0.64–0.76) for whole body mass and 0.90 (95% Cl of 0.83–0.96) for fat-free mass (9). A similar mass coefficient of 0.71 was also found in groups of prepubertal, circumpubertal, and adult subjects after accounting for differences in height (23).
Original to our study, we validated, in a large cohort, a body size-independent scaling metric for VO2peak. EBM was closely related to LBM and followed the age-associated decrease in BCM described by in previous works (20, 24). Scaling to EBM attenuated differences in VO2peak associated with sex, age, or obesity. Scaling to Mass0.7 also yielded overall good body size-independent scaling but had the disadvantage of not considering stature or integrating sex differences in body composition. In addition, when scaling to EBM, the sex gap in younger individuals of approximately 10%–15% was consistent with performance difference reported in athletes (25). Using the simplified additive equation for EBM will likely facilitate clinical adoption and have a similar expression as the national health and nutrition examination survey (NHANES) equations for LBM (26). The second original contribution of our study was the development of a WL equation that incorporates HRR; this will provide more personalized estimates of aerobic capacity (11). Compared to the Kokkinos equation (10), the new WL equation provides higher estimates at lower Sp and fGr, reflecting the reduced efficiency of slower locomotion (27–29). This explains why the intercept of the equation was likely higher than unity with a higher early increment.
The goal underpinning the generalized equation is to improve the consistency of CRF reporting across the general population. For instance, at the same Sp, fGr, or HRR, apparently healthy individuals will, on average, have similar aerobic capacity regardless of age, sex, or BMI. The EBM equation is an average scaling tool and not a substitute for direct measurements of LBM or BCM. Specific considerations are needed for trained athletes and frail individuals with sarcopenia: athletes generally have a higher proportion of BCM, while frail individuals with sarcopenia have a lower proportion (30, 31). Without these adjustments, CRF may be overestimated in athletes and underestimated in individuals with sarcopenia. The lower calibration slope observed in patients with HF from both the FRIEND and SET registries could be due to variations in body composition (such as sarcopenia or fluid overload) or increased reliance on anaerobic metabolism. Tanabe et al. (32) previously reported a discrepancy in measured and estimated VO2peak (or WL) in patients with HF using an ergocycle (32). Although we were able to confirm the 20% higher estimates, these were reduced to 10% differences after adjusting for HRR.
While our study is the largest to empirically validate a scaling metric for VO2peak, several limitations need to be highlighted. First, the EBM formula is based on a United States population of mainly white participants and further adjustment for different races and ethnicity will need to be studied. Second, we did not account for duration of exercise or holding the handrails of the treadmill in our WL estimates. Third, other factors such as peak blood pressure, environment, and diurnal rhythm can also influence VO2peak and will require further study. We were also not able to compare EBM to measure LBM in the FRIEND cohort itself due to a lack of DXA, requiring another cohort (DIETFITS) for this task. In addition, the developed equations are specific for treadmill CPX. Finally, future refinements in an EBM formula should consider correction factors for athletic status and sarcopenia/frailty.
In conclusion, the EBM formula enables body size-independent scaling of VO2peak and more consistent and equitable reporting of CRF. Incorporating HRR in the WL equations also has the added advantage of a more personalized estimate of aerobic capacity during exercise.
Data availability statementThe datasets presented in this article are not readily available because of ethical restrictions. Requests to access the datasets should be directed to Francois Haddad, fhaddad@stanford.edu.
Ethics statementThe studies involving humans were approved by FRIEND: Ball State University; SET and DIETFITS: Stanford University. The studies were conducted in accordance with the local legislation and institutional requirements. The ethics committee/institutional review board waived the requirement of written informed consent for participation from the participants or the participants’ legal guardians/next of kin because each contributing site obtained local research ethics board approval (or waiver of consent) prior to submitting data.
Author contributionsES: Conceptualization, Formal Analysis, Visualization, Writing – original draft. NC: Writing – review & editing. BC: Writing – review & editing. TK: Writing – review & editing. CG: Data curation, Writing – review & editing. RA: Data curation, Writing – review & editing. LK: Data curation, Writing – review & editing. MH: Data curation, Writing – review & editing. EA: Writing – review & editing. JC: Conceptualization, Data curation, Writing – review & editing. JM: Conceptualization, Data curation, Writing – review & editing. FH: Conceptualization, Formal Analysis, Visualization, Writing – original draft.
FundingThe author(s) declare financial support was received for the research, authorship, and/or publication of this article. This study was funded by the Stanford Cardiovascular Institute and the Wu Tsai Human Performance Alliance at Stanford University.
AcknowledgmentsWe would like to acknowledge the FRIEND collaborating centers for their contribution to the registry. We also acknowledge the Wu Tsai Foundation and the Stanford Cardiovascular Institute for their support for this exercise study. We express our gratitude to James Peterman for the preparation of the data.
Conflict of interestThe authors declare that the research was conducted in the absence of any commercial or financial relationships that could be construed as a potential conflict of interest.
The author(s) declared that they were an editorial board member of Frontiers, at the time of submission. This had no impact on the peer review process and the final decision.
Publisher's noteAll claims expressed in this article are solely those of the authors and do not necessarily represent those of their affiliated organizations, or those of the publisher, the editors and the reviewers. Any product that may be evaluated in this article, or claim that may be made by its manufacturer, is not guaranteed or endorsed by the publisher.
Supplementary materialThe Supplementary Material for this article can be found online at: https://www.frontiersin.org/articles/10.3389/fcvm.2024.1393363/full#supplementary-material
References1. Ross R, Blair SN, Arena R, Church TS, Despres JP, Franklin BA, et al. Importance of assessing cardiorespiratory fitness in clinical practice: a case for fitness as a clinical vital sign: a scientific statement from the American Heart Association. Circulation. (2016) 134:e653–99. doi: 10.1161/CIR.0000000000000461
PubMed Abstract | Crossref Full Text | Google Scholar
2. Guazzi M, Adams V, Conraads V, Halle M, Mezzani A, Vanhees L, et al. Clinical recommendations for cardiopulmonary exercise testing data assessment in specific patient populations. Circulation. (2012) 126:2261–74. doi: 10.1161/CIR.0b013e31826fb946
PubMed Abstract | Crossref Full Text | Google Scholar
3. Kaminsky LA, Arena R, Myers J, Peterman JE, Bonikowske AR, Harber MP, et al. Updated reference standards for cardiorespiratory fitness measured with cardiopulmonary exercise testing. Mayo Clin Proc. (2022) 97:285–93. doi: 10.1016/j.mayocp.2021.08.020
PubMed Abstract | Crossref Full Text | Google Scholar
4. Krachler B, Savonen K, Komulainen P, Hassinen M, Lakka TA, Rauramaa R. Cardiopulmonary fitness is a function of lean mass, not total body weight: the DR’s EXTRA study. Eur J Prev Cardiol. (2015) 22:1171–9. doi: 10.1177/2047487314557962
PubMed Abstract | Crossref Full Text | Google Scholar
5. Kohler A, King R, Bahls M, Gross S, Steveling A, Gartner S, et al. Cardiopulmonary fitness is strongly associated with body cell mass and fat-free mass. Scand J Med Sci Sports. (2018) 28:1628–35. doi: 10.1111/sms.13057
PubMed Abstract | Crossref Full Text | Google Scholar
6. Nevill AM, Holder RL. Scaling, normalizing, and per ratio standards: an allometric modeling approach. J Appl Physiol (1985). (1995) 79:1027–31. doi: 10.1152/jappl.1995.79.3.1027
PubMed Abstract | Crossref Full Text | Google Scholar
7. Wang Z, Heymsfield SB, Ying Z, Pierson RN Jr, Gallagher D, Gidwani S. A cellular level approach to predicting resting energy expenditure: evaluation of applicability in adolescents. Am J Hum Biol. (2010) 22:476–83. doi: 10.1002/ajhb.21020
PubMed Abstract | Crossref Full Text | Google Scholar
8. Taylor CR, Maloiy GM, Weibel ER, Langman VA, Kamau JM, Seeherman HJ, et al. Design of the mammalian respiratory system. III scaling maximum aerobic capacity to body mass: wild and domestic mammals. Respir Physiol. (1981) 44:25–37. doi: 10.1016/0034-5687(81)90075-X
PubMed Abstract | Crossref Full Text | Google Scholar
9. Lolli L, Batterham AM, Weston KL, Atkinson G. Size exponents for scaling maximal oxygen uptake in over 6500 humans: a systematic review and meta-analysis. Sports Med. (2017) 47:1405–19. doi: 10.1007/s40279-016-0655-1
PubMed Abstract | Crossref Full Text | Google Scholar
10. Kokkinos P, Kaminsky LA, Arena R, Zhang J, Myers J. New generalized equation for predicting maximal oxygen uptake (from the fitness registry and the importance of exercise national database). Am J Cardiol. (2017) 120:688–92. doi: 10.1016/j.amjcard.2017.05.037
PubMed Abstract | Crossref Full Text | Google Scholar
11. Swain DP, Leutholtz BC, King ME, Haas LA, Branch JD. Relationship between% heart rate reserve and% VO2 reserve in treadmill exercise. Med Sci Sports Exerc. (1998) 30:318–21. doi: 10.1097/00005768-199802000-00022
留言 (0)