Ferroptosis is a regulated form of programmed cell death that is mechanistically distinct from other pathways such as apoptosis and necroptosis (Dixon et al., 2012). It results from an imbalance between a cell’s oxidant and antioxidant mechanisms, leading to excessive accumulation of polyunsaturated fatty acid hydroperoxides (PUFA-OOHs) within the plasma membrane (Kuang et al., 2020; Do et al., 2023; Chen et al., 2021a; Barayeu et al., 2023).
Reactive oxygen and nitrogen species (ROS/RNS) have been implicated in lipid peroxidation through both non-enzymatic and enzymatic pathways (Panasenko et al., 1995; Weidinger and Kozlov, 2015; Su et al., 2019). Non-enzymatic pathways involve the elevation of ROS/RNS levels, often as a result of the iron-mediated Fenton reaction (Fenton, 1894; Haber and Weiss, 1934). Enzymatic pathways, on the other hand, are mediated by enzymes such as lipoxygenase (LOX) and cyclooxygenase (COX), especially 15-lipoxygenase (15LOX) which demonstrates significant pro-ferroptotic peroxidation activity towards double-PUFA-PEs (Phosphatidylethanolamines containing two PUFA tails in sn1 and sn2) (Seiler et al., 2008; Ding et al., 2003; Yang et al., 2016; Kagan et al., 2021; Samovich et al., 2024).
Cellular antioxidant defenses include mevalonate-dependent mechanisms (Sun et al., 2023), as well as compounds like vitamin E (α-tocopherol) (Hu et al., 2021). Enzymes such as superoxide dismutase (SOD), catalase (CAT) (Chen et al., 2021b), ferroptosis suppressor protein 1 (FSP1) (Doll et al., 2019), calcium-independent phospholipase A2β (iPLA2B) (Sun et al., 2021), and inducible nitric oxide synthase (iNOS) (He et al., 2022) play crucial roles in modifying oxidative stress and protecting cells from lipid peroxidation damage. Of particular importance is glutathione peroxidase 4 (GPX4), which catalyzes the reduction of PUFA-OOHs to non-toxic alcohols (PUFAs-OH), effectively countering ferroptosis (Ursini et al., 1982; Liu et al., 2018; Yang et al., 2014; Moon et al., 2019).
Lipid peroxidation can alter the composition of the membrane and affect its physical properties, potentially causing damage (Neto and Cordeiro, 2016; Wong-Ekkabut et al., 2007). To understand how membrane composition is modified during ferroptosis, it is essential to investigate the mechanism of PUFA peroxidation (Figure 1). PUFAs are fatty acids containing two or more double bonds and at least one bis-allylic carbon atom (Wong-Ekkabut et al., 2007), serving as substrates for oxidation by ROS/RNS as well as LOXs. This oxidation involves hydrogen abstraction from bis-allylic carbon atoms, yielding a pentadienyl radical (PUFA°), which quickly interacts with molecular oxygen to generate a peroxyl radical (PUFA-OO°). These peroxyl radicals take hydrogen from other PUFAs, resulting in the formation of lipid hydroperoxides (PUFA-OOH) and the generation of new pentadienyl radicals. Lipid hydroperoxides then interact with Fe2+ to produce lipid alkoxyl radicals, which in turn abstracts hydrogen from adjacent PUFAs, thus propagating the radical chain reaction. Alternatively, they may take hydrogen from antioxidants, convert them into stable oxidized forms, and produce new hydroperoxides-a process known as the termination pathway (Porter, 1986; Marnett, 1987). In the presence of electron donors such as antioxidants (e.g., alpha-tocopherol) and other PUFAs, peroxyl radicals predominantly yield primary hydroperoxides with a trans(E)-cis(Z) configuration. However, in their absence, the primary hydroperoxide undergoes β-fragmentation to form secondary hydroperoxides with a trans(E)-trans(E) configuration (Schneider, 2009) (Figure 1).
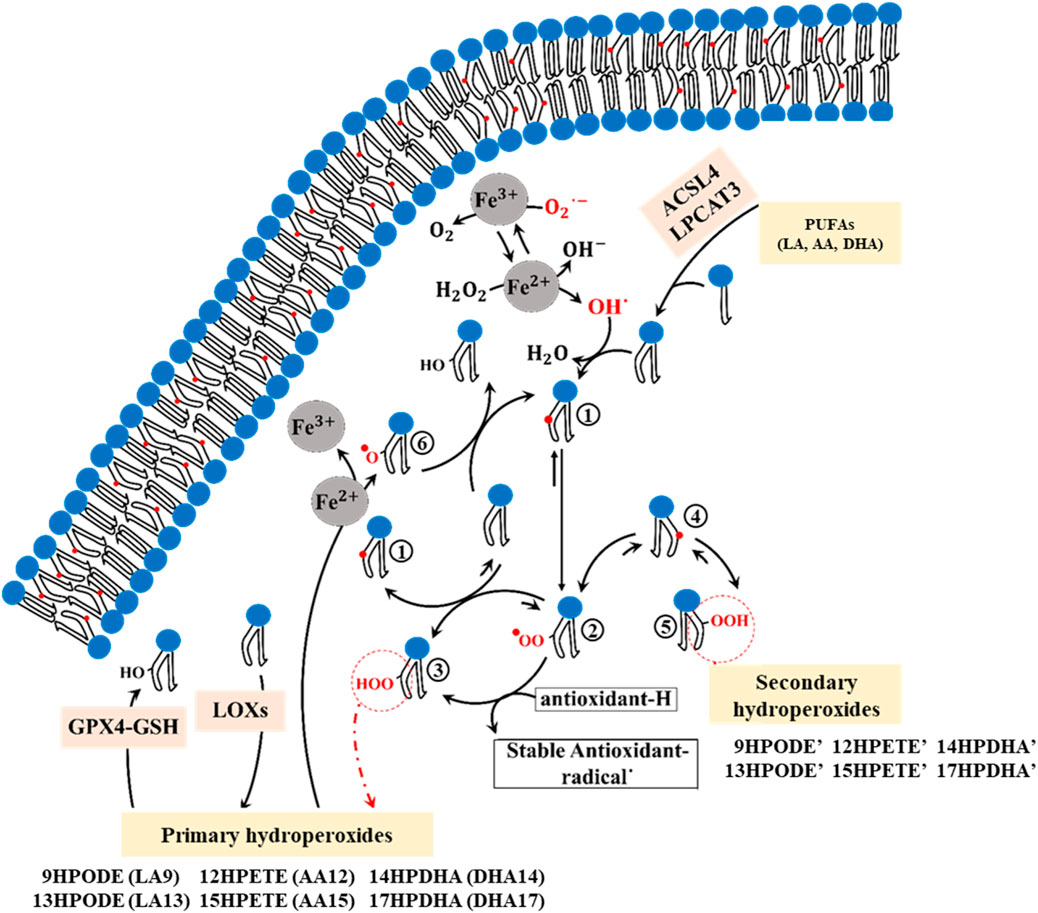
Figure 1. The chemical mechanism of PUFA peroxidation encompasses multiple sequential steps. 1; Formation of the cisoid pentadienyl radical, 2; Formation of the peroxyl radical, 3; Formation of the primary trans-cis hydroperoxides (9HPODE: 9-hydroperoxy-10E,11Z-octadecadienoic acid, 13HPODE: 13-hydroperoxy-9Z,11E-octadecadienoic acid, 12HPETE: 12-hydroperoxy-5Z,8Z,10E,14Z-eicosatetraenoic acid, 15HPETE: 15-hydroperoxy-5Z,8Z,11Z,13E-eicosatetraenoic acid, 14HPDHA: 14-hydroperoxy-4Z,7Z,10Z,12E,16Z,19Z-docosahexaenoic acid, 17HPDHA: 17-hydroperoxy-4Z,7Z,10Z,13Z,15E, 19Z-docosahexaenoic acid), 4; Formation of the transoid pentadienyl radical, 5; Formation of the Secondary trans-trans hydroperoxides (9HPODE’: 9-hydroperoxy-10E,12E-octadecadienoic acid, 13HPODE’: 13-hydroperoxy-9E,11E-octadecadienoic acid, 12HPETE’: 12-hydroperoxy-5Z,8E,10E,14Z-eicosatetraenoic acid, 15HPETE’: 15-hydroperoxy-5Z,8Z,11E,13E-eicosatetraenoic acid, 14HPDHA’: 14-hydroperoxy- 4Z,7Z,10E,12E,16Z,19Z-docosahexaenoic acid, 17HPDHA’: 17-hydroperoxy- 4Z,7Z,10Z,13E,15E, 19Z-docosahexaenoic acid), 6; Formation of the lipid alkoxyl.
The enzymes acyl-CoA synthetase long-chain family member 4 (ACSL4) and lysophosphatidylcholine acyltransferase 3 (LPCAT3) are required for inducing ferroptosis in cells (Kagan et al., 2017; Li et al., 2020). ACSL4 prepares PUFAs, particularly arachidonic acid (AA, 20:4 n- 5Z,8Z,11Z, 14Z) and linoleic acid (LA, 18:2 n-9Z, 12Z), for incorporation into membrane phospholipids by the LPCAT3 enzyme (Yuan et al., 2016; Doll et al., 2017; Wang and Tontonoz, 2019; Küch et al., 2014). These PUFAs are classified into omega-3 and omega-6 groups, both of which play crucial roles in inducing ferroptotic cell death (Trostchansky and Rubbo, 2019). While both LA (omega-6) and AA (omega-6) can be oxidized by ROS, AA serves as the primary substrate of LOX enzymes (Kagan et al., 2017; Trostchansky and Rubbo, 2019; Vickers, 2017; Ito et al., 2019; Shah et al., 2018). Notably, in human red blood cell plasma membranes, the three most common PUFAs are LA, AA, and docosahexaenoic acid (DHA, 22:6 n-4Z,7Z,10Z,13Z,16Z, 19Z) (Yawata, 2006). During ferroptosis, these PUFAs become susceptible to autoxidation by iron, as well as oxidation through LOX and COX enzymes, and ROS/RNS (Trostchansky and Rubbo, 2019). A variety of hydroperoxide isomers can be produced through both autoxidation and enzymatic oxidation of LA, AA, and DHA, including LA-9HPODE (hydroperoxyoctadecadienoic acid: 9OOH, 10E, 12Z), LA-13HPODE (hydroperoxyoctadecadienoic acid: 13OOH, 9Z, 11E), AA-12HPETE (hydroperoxyeicosatetraenoic acid: 12OOH, 5Z, 8Z, 10E, 14Z), AA-15HPETE (hydroperoxyeicosatetraenoic acid: 15OOH, 5Z, 8Z, 11Z, 13E), DHA-14HPDHA (Hydroperoxydocosahexaenoic acid: 14OOH, 4Z, 7Z, 10Z, 13Z, 15E, 19Z), and DHA-17HPDHA (Hydroperoxydocosahexaenoic acid: 17OOH, 4Z, 7Z, 10Z, 12E, 16Z, 19Z) (Trostchansky and Rubbo, 2019).
The lipid composition and the asymmetric distribution of lipids between membrane layers significantly influence the physical properties and functions of a membrane (Moon et al., 2019; van Meer, 2011). This distribution is regulated by proteins known as flippases and floppases in human red cell membranes (Marquardt et al., 2015; Devaux et al., 2008; Bevers et al., 1999), leading to an enrichment of phosphatidylcholine (PC) and sphingomyelin (SM) in the outer layer, and phosphatidylethanolamine (PE) and phosphatidylserine (PS) in the inner monolayer (Verkleij et al., 1973; Mohandas and Gallagher, 2008). While the cholesterol content of mammalian cell membranes is known to be approximately 50% of the phospholipid content, the exact distribution of cholesterol between bilayers remains debated (Yawata, 2006; Marquardt et al., 2015; Marquardt et al., 2016; Choubey et al., 2013).
This study aimed to investigate the intricate interplay between ferroptosis-induced lipid peroxidation and the dynamics of protein-free membranes. However, biological membranes typically exhibit a protein-to-lipid ratio of 1:50 to 1:100 (Ryan et al., 1988; Jeon et al., 2016), and protein crowding can significantly influence membrane structure and fluidity.The size of a protein’s hydrophobic region affects local lipid packing trough hydrophobic mismatch (Jensen and Mouritsen, 2004; Mitra et al., 2004); larger hydrophobic regions stretch surrounding lipids, decreasing their area per lipid (APL), while smaller regions have the opposite effect (Jensen and Mouritsen, 2004; Mitra et al., 2004). As protein concentration increases, APL generally decreases, and lipid lateral diffusion is reduced (Frick et al., 2007; Goose and Sansom, 2013), as normal Brownian motion shifts to non-Gaussian, anomalous diffusion patterns (Jeon et al., 2016; Javanainen et al., 2013). This crowding also leads to a reduction in membrane permeability (Jan Akhunzada et al., 2019).
In protein-free membranes, diffusion typically occurs on the scale of hundreds of nanoseconds (Javanainen et al., 2013) but in protein-crowded environments, diffusion slows dramatically, with normal diffusion beginning in the range of tens of microseconds and potentially extending to milliseconds in highly concentrated systems (Javanainen et al., 2013). This timescale exceeds the computational capacity of even the most advanced simulation systems.
Using molecular dynamics (MD) simulations, we examined the structural and dynamic alterations occurring within lipid membranes under ferroptotic conditions and assessed their impact on permeability to doxorubicin (DOX), a widely used chemotherapeutic agent. The connection between DOX and ferroptosis is in their association with ROS generation and PUFA peroxidation (Zhao et al., 2023; Hajipour Verdom et al., 2018; Micallef et al., 2020). Our study includes a range of modifications, including changes in membrane thickness, lipid mobility, and permeability, to elucidate the potential mechanisms underlying cellular responses to ferroptosis. Our findings provide valuable insights into the molecular basis of ferroptosis and its implications for cellular function and integrity. Understanding these processes is crucial for developing targeted interventions against ferroptosis-associated pathologies, making our study significant in the context of biotechnological and biomedical investigation.
Models and methodsModels ConstructionThe red blood cell plasma membrane was used to model both native and ferroptosis-induced membranes. This membrane’s lipid composition has been well-characterized by experimental techniques (Yawata, 2006; Yawata et al., 1984; Cooper, 1970; Van Deenen and De Gier, 1974). For the native membrane model, we used experimentally determined mole fractions of key phospholipid groups like PC, PE, PS, and SM. Fatty acid types and components for each group and membrane layer were selected based on Supplementary Data (Yawata, 2006) (Supplementary Table S1). To simplify the membrane model, phosphatidylinositol (Pi) was replaced with PS. Both Pi and PS contain a negative electric charge, though Pi constitutes a minor mole fraction in plasma membranes. Cholesterol, crucial for maintaining plasma membrane stability and function, was included at a molar ratio of 0.5 relative to total phospholipids, approximately reflecting its concentration in erythrocyte membranes (Yawata, 2006). Despite some studies suggesting symmetric cholesterol distribution between membrane layers and others indicating higher concentrations in the inner monolayer. We modeled symmetrical cholesterol distribution between the inner and outer layers to account for these uncertainties. The Phospholipid composition of the inner and outer layers was defined based on the details provided in Supplementary Tables S1, S2.
To derive the ferroptosis membrane, we replaced PUFA-containing phospholipids (PUFA-pls) of the native membrane with their hydroperoxide derivatives (Hpds) as described in Supplementary Table S3. Hydroperoxyl (OOH) groups were added to PUFA chains of phospholipids containing LA, AA, or DHA following experimental patterns shown in Supplementary Figures S1–S3. Since we did not find experimental data supporting the exact ratios of these oxidized isomers, for phospholipids containing solely LA, AA, or DHA in the sn-2 position, half were replaced with the Hpds 9HPODE (∼4.3 mol%), 12HPETE (∼5.6 mol%), or 14HPDHA (∼4 mol%), and the other half with 13HPODE (∼4.6 mol%), 15HPETE (∼5.6 mol%), or 17HPDHA (∼4 mol%), respectively. Phospholipids containing LA, AA, or DHA in sn-1/sn-2 positions incorporated isomers containing 13HPODE/9HPODE (∼1.6 mol%), 15-HPETE/12HPETE (∼2.3 mol%), or 17-HPDHA/14HPDHA (∼1.6 mol%), respectively. As observed, double hydroperoxidized phospholipids are present in low ratios in our modeled ferroptosis membrane. Recently Dr. Samovich et al. showed that these double hydroperoxidized phospholipids play a crucial role in ferroptosis induction (Samovich et al., 2024).
Supplementary Figures S1–S3 show the hydroperoxidized phospholipids containing HPODEs, HPETEs, and HPDHAs. The connectivity shapes, atom types in the CHARMM36 force field (Klauda et al., 2010; Bjelkmar et al., 2010; Piggot et al., 2012), and charge definitions of phospholipids with Hpds from both isomers of LAs, AAs, and DHAs are defined in Supplementary Tables S4–S6. The CHARM-GUI interface (Wu et al., 2014; Jo et al., 2008; Jo et al., 2009) was used to model the native membrane composition based on Supplementary Table S2. The ferroptosis membrane was constructed using the Packmol package (Martínez et al., 2009), maintaining a similar composition to the native membrane but substituting phospholipids containing LA, AA, and DHA with their Hpds. The distance at which the molecules’ atoms were allowed to assemble around each other in Packmol was set by the tolerance parameter, which was 2 Å. Simulation boxes containing 200 phospholipids and 100 cholesterol molecules were generated for both membranes using parameters listed in Supplementary Table S7.
Molecular dynamics simulationsWe performed all-atom MD simulations using GROMACS (version 2018.1) (Abraham et al., 2018) and the CHARMM36 force field to simulate four MD simulations: two simulations for the native membrane (n = 2) and two for the ferroptosis membrane (n = 2). The reported results of each modeled membrane are the average of the two related simulations. Graphs were plotted using the xmgrace plotting tool (Cowan and Grosdidier, 2000) and MD snapshots of the membranes were analyzed using VMD (Visual Molecular Dynamics) software (Humphrey et al., 1996).
Initially, energy minimization for all systems was conducted using the steepest descent minimization algorithm over 100,000 steps. The energetically minimized systems were then equilibrated in the NVT ensemble using the leap-frog integrator in a two-step equilibration process (Bussi et al., 2007; Alipour et al., 2023). The first equilibration step was performed for 1500 picoseconds (ps) at 305 K (K), followed by a second equilibration step for 2500 ps at 310 K. During NVT equilibration, a time step of 2 femtoseconds (fs) was used, and temperature coupling was achieved with the velocity rescale thermostat (Bussi et al., 2007).
Subsequent NPT ensemble equilibration involved semi-isotropic pressure control at 1 bar using the Parrinello-Rahman barostat (Parrinello and Rahman, 1981) with a time step of 2 fs. The pressure was adjusted in four steps: 1250, 1500, 2500, and 5000 ps, while maintaining a constant temperature of 310 K. All restraints were removed in the final step of the NPT equilibration. Throughout the equilibration and production steps, the Verlet list update method was used as the cutoff scheme, with the neighbor list updated every 20 steps. The cutoff distance for the neighbor list (rlist) was set to 1.2 nm (nm). For Lennard-Jones and short-range electrostatic interactions, a cutoff of 1.2 nm was applied, and long-range electrostatic interactions were computed using the particle mesh Ewald (PME) method (Cheatham et al., 1995).
The production step of the simulations was performed for 500 ns (n = 2) using a time step of 2 fs, a temperature of 310 K, and a pressure of 1 bar. The leap-frog algorithm was employed to integrate Newton’s equations of motion during this step. The root-mean-square deviation (RMSD) of the systems reached a steady state, indicating that the simulated structures were relatively stable. Additionally, it was observed that the n1 and n2 simulations of each native and ferroptosis membrane showed a high degree of similarity (Supplementary Figure S4).
Deuterium order parameter (SCD)We calculated the deuterium order parameter SCD (Piggot et al., 2017) to obtain the rotational diffusion (motional order) of the acyl chains relative to the membrane normal (z-axis). A low SCD value indicates that the acyl chains have high motional freedom, while a high SCD value suggests a rigid, crystal-like membrane state with limited freedom of motion (Yeagle, 2016). An SCD = 1 indicates that lipid tails are aligned along the membrane normal, whereas an SCD = −0.5 indicates perpendicular orientation (Yeagle, 2016). The SCD can be experimentally obtained through techniques like electron spin resonance (ESR) and 2H-13C NMR, as well as through simulations (Yeagle, 2016; Vermeer et al., 2007). In MD simulations, SCD calculates the orientation of C-H bonds relative to the membrane normal (Yeagle, 2016; Karami and Jalili, 2015), using the following Equation 1.
SCD=123 cos2θj-1(1)Where θj is the angle between the Cj−1 and Cj+1 atoms axes and the membrane normal, which defines the orientation of the molecule within the bilayer.
Lipids lateral diffusionThe lateral diffusion coefficient (D) of lipids reflects the Brownian motion associated with the exchange of lipids within the membrane (Wong-Ekkabut et al., 2007). To obtain D values, we first calculated the mean-square displacements (MSD) using Equation 2 and then applied the Einstein relation (Equation 3). Here, nspecies represents the number of lipid species, and ri (t) denotes the position of lipid i at time t. Before MSD calculation, we subtracted the motion of the monolayers and the center of mass of the membranes.
MSD=1nSpecies∑i=1nspeciesrit−rit=02(2)Dlateral=14 limt→∞ddt MSD(3)Two important factors influencing D are the free area theory and the activation energy barrier of Brownian motion (Falck et al., 2004). The free area theory relates lateral mobility to the available free area per molecule (af) and the lipid packing, represented by the cross-sectional area per lipid (al) as shown in Equation 4. The activation energy barrier, described by the Boltzmann relation, must be overcome for diffusion to occur between sites.
Force field parametersThe topological parameters for phospholipids, cholesterol, water, and ions were obtained from the CHARMM36 force field. The TIP3P water molecules were utilized for the simulation. To identify the OOH groups of oxidized phospholipids, additional parameters were used from CGenFF (Vanommeslaeghe et al., 2010) and Julian Garrec’s work (Garrec et al., 2014). These parameters were calculated based on the B3LYP/6-31G* quantum mechanics theory using Gaussian G9 and the FFTK program. The hydroperoximethane (CH3COOH) was employed as the model molecule. Parameters for bond stretching, angle, dihedral angles, and charge parameters were determined accordingly (Supplementary Tables S8–10).
Potential of mean force (PMF)We used the umbrella sampling method (Torrie and Valleau, 1977) to calculate the pure free-energy barrier (∆GPB) or the potential of mean force (PMF) for the passage of DOX across the four systems comprising two modeled membranes. The topology parameters of DOX were provided by CGenFF. Initially, we obtained the initial structures from steered molecular dynamics (SMD) (Isralewitz et al., 2001), where DOX was moved with a force constant of 100 kJ.mol−1.nm−2 and a velocity of 0.001 nm.ps−1 from the outer aqueous phase (z = 4.0 nm) to the inner aqueous phase (z = −4.0 nm) through the membrane models selected from 500 ns simulation (n = 2). We divided this process into 40 windows, each 0.2 nm apart within our membranes. Each window was simulated for 20 ns in the NPT ensemble, with the first 10 ns serving as the equilibrium phase. Subsequently, we generated the PMF profiles using the WHAM analysis method (Kumar et al., 1992).
Furthermore, we utilized the inhomogeneous solubility-diffusion model (Marrink and Berendsen, 1994; Dickson et al., 2017) to calculate the permeability coefficient of DOX in membrane models. The permeability coefficient was determined using Equation 5, which considers the ∆GPB and the diffusion coefficient (D) of DOX at specific z-positions within the model membranes. The diffusion coefficient can be calculated using the force autocorrelation method (Marrink and Berendsen, 1994). Here, R represents the ideal gas constant (8.314 J.mol−1.K−1) and T denotes the temperature (298 K).
P=∫−4nm4nme∆GPBz1RTDz−1(5)Results and discussioniMass density profilesWe calculated the mass density profile of individual components as a function of distance from the membrane center for both native and ferroptosis membranes, illustrating their positions and water permeation (Figures 2, 3; Supplementary Tables S1, S12). Figures 2A, 3 demonstrate that water molecules penetrated deeper into the ferroptosis membrane, indicating increased water permeability. However, despite heightened permeability, the water density at the center of the membrane is negligible, suggesting that the membrane’s integrity was maintained under ferroptosis conditions. This finding aligns with other studies that did not observe pore formation when bilayers underwent hydroperoxidation (Jurkiewicz et al., 2012; Weber et al., 2014).
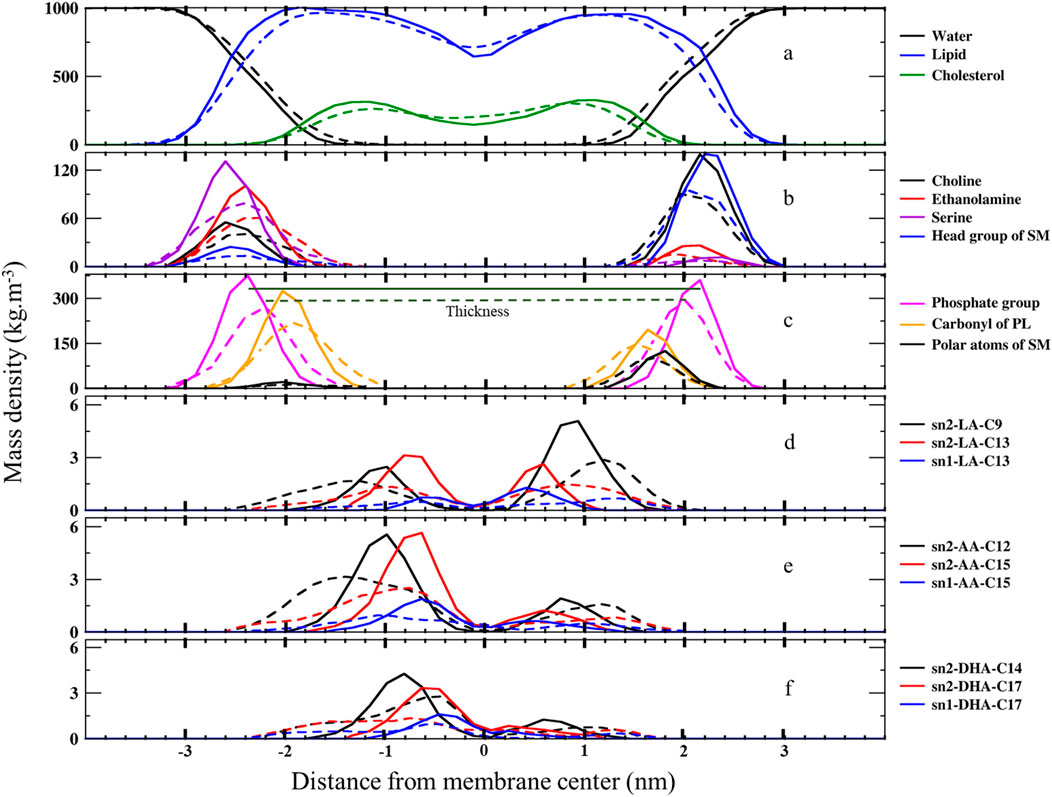
Figure 2. The mass density profiles along the bilayer normal (z-direction) from the center of the membranes over the last 400 ns (n = 2) for (A) water, lipids, and cholesterol, (B) lipid head groups, (C) carbonyl and phosphate groups, and (D) carbons bonded to OOH moieties in LAs, AAs, and DHAs. The solid lines represent the native membrane, while the dashed lines represent the ferroptosis membrane.
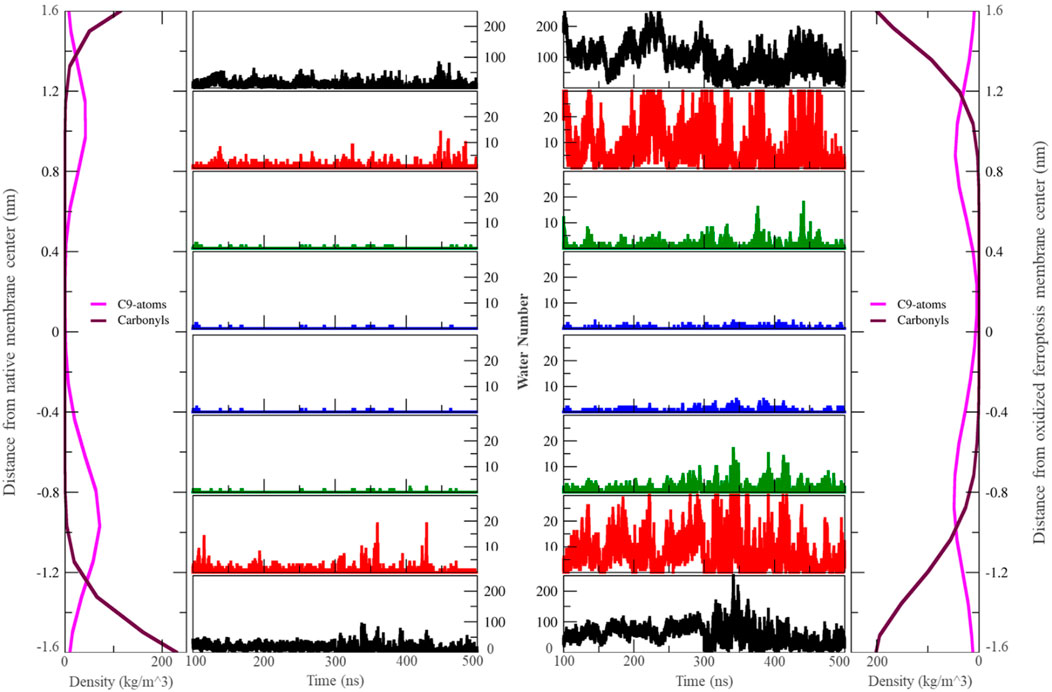
Figure 3. The number of water molecules located in different zones around the center of the membrane varies over the last 400 ns (n = 2). Each zone is separated by 0.4 nm. In this context, “carbonyls” refer to the carbonyl groups of phospholipids, and ‘C9-atoms’ are associated with the ninth carbon atom in the lipid tails (left: native membrane, right: oxidized ferroptotic membrane).
The minimal lipid density at the center (Z ∼ 0) denotes the random packing of lipid chains. We also found slightly increased lipid density in the central region of the ferroptosis membrane, potentially due to the interdigitated lipids from different layers (Wong-Ekkabut et al., 2007; Kumar et al., 2018; Mason et al., 1997). Furthermore, we observed another structural modification: in the native membrane, cholesterol resided near the tails proximate to the polar interface, while in the ferroptosis membrane, cholesterol shifted toward the center.
Moreover, the density profiles of choline, serine, ethanolamine, and head group of SM in the inner layer of the ferroptosis membrane shifted approximately 0.2 nm, 0.4 nm, 0.4 nm, and 0.4 nm toward the center, respectively, compared to the native membrane. Similarly, in the outer layer, these profiles shifted approximately 0.2 nm, 0.4 nm, 0.2 nm, and 0.4 nm toward the center, respectively, with peak positions 0.2 nm closer to the core. These results indicated that the ferroptosis membrane is generally thinner than the native membrane (Figure 2B; Supplementary Table S12).
In addition, the density profiles of polar atoms such as phosphates, carbonyls, and polar atoms of SMs (-CO-NH-C-C-OH), shifted 0.2 nm toward the core in both layers of the ferroptosis membrane compared to the native membrane. Their peak positions were closer to the core by approximately 0.17 nm, 0.1 nm, and 0.1 nm in the inner layer and by about 0.15 nm, 0.1 nm, and 0.2 nm in the outer layer (Figure 2C; Supplementary Tables S11, S12).
Furthermore, Figure 2D shows that the density profiles for carbon atoms with OOH groups in the ferroptosis membrane were more widely distributed toward the polar interface compared to the native membrane. In LAs, oxidized C13 in both sn1 and sn2 positions were more widely distributed than oxidized C9 in sn2. Similarly, in AAs, oxidized C15 in sn1 and sn2 were more widely distributed than oxidized C12 in sn2. In DHAs, oxidized C17 in sn1 and sn2 were more widely distributed than oxidized C14 in sn2. These findings suggest that OOH groups closer to the chain ends induce more significant structural modifications by moving more strongly toward the polar interface. This phenomenon aligns with the Whisker model proposed for the structure of oxidized cell membranes (Sun et al., 2021; Greenberg et al., 2008).
Supplementary Table S13 presents the thickness and area per lipid of our simulations, alongside other experimental and simulation results for comparison. We determined membrane thickness by measuring the distance between phosphate peaks in the inner and outer layers (Supplementary Table S11; Figure 2C). Recent studies using high-resolution X-rays to obtain structural properties of erythrocyte membrane domains identified two states: ordered (lipid tails in all-trans configurations) and disordered (bent lipid chains) (Himbert et al., 2017). The ordered domain thickness was 4.6 nm, which is close to our 4.52 nm native membrane simulation result. Meanwhile, the disordered domain thickness was 4.1 nm, similar to our 4.2 nm ferroptosis membrane simulation. These measurements indicate a 0.32 nm decrease in thickness from the native to the ferroptosis membrane. The thicknesses of the inner and outer layers of the native and ferroptosis membranes were 2.37/2.15 nm and 2.2/2.0 nm, respectively. Notably, the outer layer was thinner than the inner layer in both membranes. Results indicate that ferroptosis decreased the thickness of inner/outer layers by 0.17/0.15 nm. Additionally, the inner and outer layers of the ferroptosis membrane had a 0.06 nm2 larger area per lipid compared to the native membrane. These results are consistent with previous studies (Wong-Ekkabut et al., 2007; Himbert et al., 2017; Yang et al., 2020) shown in Supplementary Table S13 (see Supplementary Material for more discussion), which confirm the reliability of our all-atom force field parameters in defining HPds in the membrane. Our model membranes also closely match to experimental thickness and area results.
The increased lipid surface area in the ferroptosis membrane is attributed to interactions between the oxide groups and the polar interface, as well as the bending of lipid chains. Other studies also observe hydroperoxide groups near the polar interface (Garrec et al., 2014). This increase in lipid surface area is a notable structural change that can significantly impact membrane dynamics and function.
Lipid-order parameterWe measured SCD values for all carbon atoms in individual fatty acids to compare their motional freedom in detail (Figures 4, 5). The order parameter profile exhibits a plateau state for palmitic acids (PAs, 16:0, SCD ∼0.3–0.4) and stearic acids (SAs, 18:0, SCD ∼0.23–0.38) at different sn1 and sn2 positions in various lipids, from C4 to C9 (Figures 4A,B). The SCD then rapidly decreases down the chain to its lowest value, aligning with results from spectroscopic techniques (Vermeer et al., 2007; Galiullina et al., 2019). This indicates that the hydrocarbon chain near the glycerol backbone has low motional freedom and is more aligned with bilayer normal, while the core region exhibits greater fluidity with low alignment with bilayer normal. The SCD order parameter for all carbons in PAs and SAs shifts to lower values in the ferroptosis membrane (Figures 4D,E), suggesting that even non-oxidized tails in ferroptosis membranes have greater fluidity compared to the native membrane. Meanwhile, Figure 4C shows the order parameter profile for oleic acids (OA, C18:1 n-9) in the native membrane, exhibiting a plateau state (SCD ∼0.25–0.35) from C3-C7, rapidly dropping to its lower value around double bond, C9-C10, before rising once more from C12-C15, as experimentally confirmed (Karami and Jalili, 2015; Hoopes et al., 2011). This demonstrates that the presence of a double bond on C9-C10 in OAs causes a decrease in fluidity in the end portion below the double bond, compared to stearic acids.
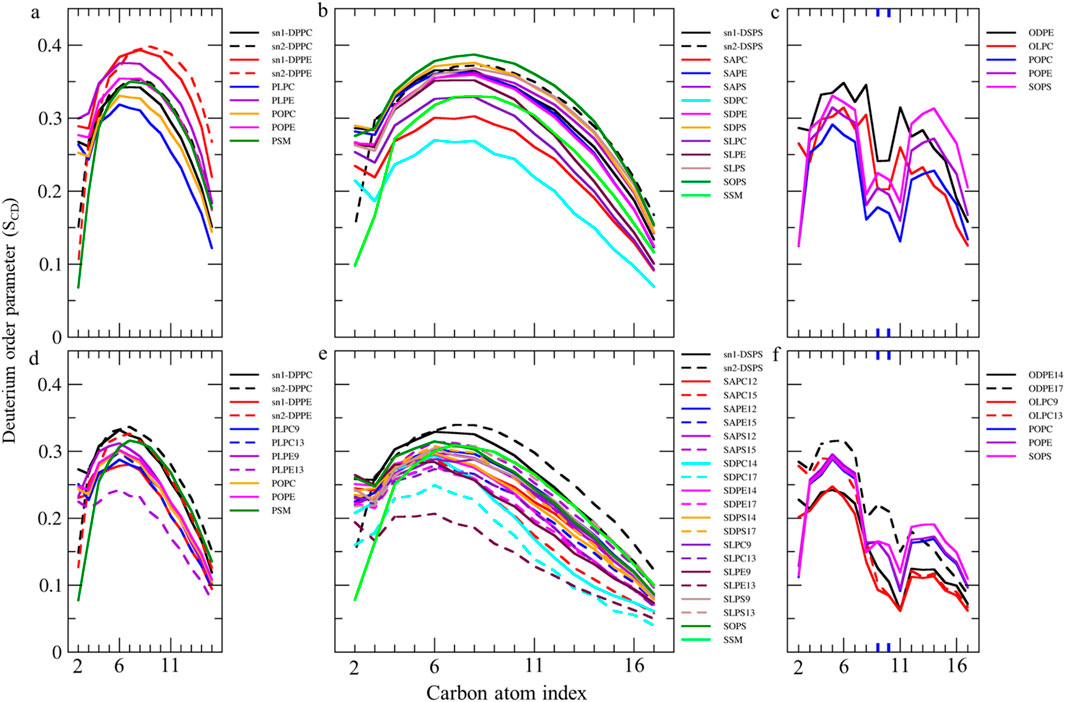
Figure 4. Deuterium order parameter SCD profiles over the last 400 ns (n = 2) for PALs, SAs, and OAs in the (A–C) native and (D–F) ferroptosis membranes. The carbon index ranges from the carbonyl carbon (+1) to the penultimate carbon. The carbons participating in double bonds are labeled in blue and shown as thicker lines.
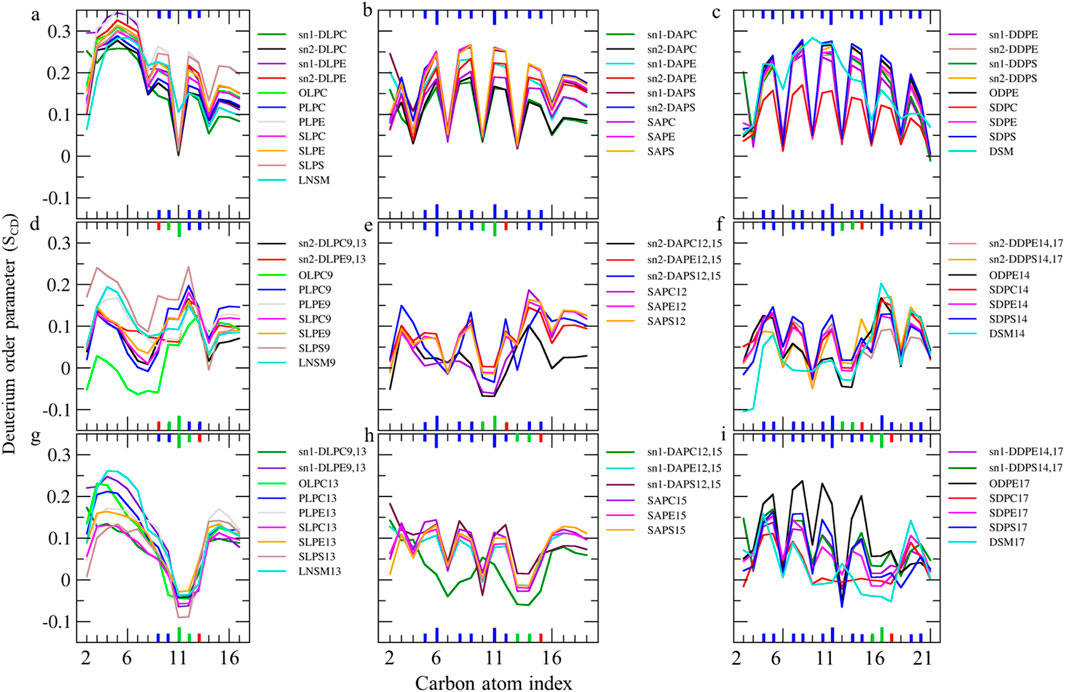
Figure 5. (A–C) Deuterium order parameter SCD profiles over the last 400 ns (n = 2) for LAs, AAs, and DHAs in the native membrane. (D–I) The SCD profiles of their hydroperoxide products, such as LAs9, AAs12, DHAs14, LAs13, AAs15, and DHAs17 for the ferroptosis membrane. The carbon index ranges from the carbonyl carbon (+1) to the penultimate carbon. The carbons participating in cis and trans double bonds are labeled in blue and green, respectively, and shown as thicker lines. Carbons carrying the OOH moiety are marked in red and shown as thicker lines.
Furthermore, the order parameter for the carbon atoms in OAs shifts to lower values in the ferroptosis membrane (Figure 4F), suggesting that monounsaturated tails have greater fluidity compared to the native membrane. This increased fluidity in both saturated and monounsaturated fatty acid chains in the ferroptosis membrane indicates a significant alteration in the membrane’s physical properties under ferroptotic conditions. This could have substantial implications for membrane permeability and the overall cellular response during ferroptosis.
The order parameter of PUFAs is illustrated in Figure 5. In Figure 5A, the profile for LAs in the native membrane shows a plateau state from C3 to C7 (SCD ∼0.22–0.35). The SCD then drops at C8, increases at the double bond (C9-C10), drops again at C11, increases at the second double bond (C12-C13), decreases at C14, and finally increases again towards the chain end. This pattern indicates that the double bonds in LAs reduce fluidity in the tail end compared to stearic acids, resembling the effect of the double bond in OAs.
Additionally, Figures 5D,G shows the order parameter for hydroperoxidized LAs isomers, specifically 9HPODE (LA9) and 13HPODE (LA13), respectively. For LA9, the order parameter reduces from C3 to C9 compared to the native membrane due to the oxidation at C9. However, the order parameter increases at C11 due to the formation of a new trans double bond. For LA13, the order parameter significantly reduces from C9 to C13 due to the oxidation at C13. Consequently, hydroperoxidation at C9 disrupts the order in the region proximal to the glycerol backbone, while oxidation at C13 disrupts the order in the mid-chain region.
As shown in Figures 5B,C, the order parameter profiles in the native membrane for AA and DHA in phospholipids exhibit frequent rises and drops, with high order parameters at double bond carbons and low order parameters between continuous double bonds consistent with previous findings (Hyvönen and Kovanen, 2005; Saiz and Klein, 2001). Figures 5E,H, shows significantly reduced order parameters for hydroperoxidized AA isomers 12HPETE (AA12) and 15HPETE (AA15) compared to native membrane. The most disordered regions localize to the hydroperoxide moiety, specifically spanning C10 to C12 for AA12 and C13 to C15 for AA15. Similarly, Figures 5F,I, show significantly reduced and disturbed order parameters for hydroperoxidized DHA isomers 14HPDHA (DHA14) and 17HPDHA (DHA17) compared to the native membrane. The most disordered regions for DHA14 span C13 to C14 and for DHA17 span C16 to C17, indicating the localization of disorder around the hydroperoxide groups.
In addition to the individual SCD values, the average SCD of each fatty acid in sn1 and sn2 of all phospholipids was plotted for both membranes (Table 1; Figure 6). The average SCD of nearly all oxidized and non-oxidized lipid tails in sn1 and sn2 decreased in the ferroptosis membrane compared to the native membrane, suggesting that the ferroptosis membrane is generally more fluid than the native membrane.
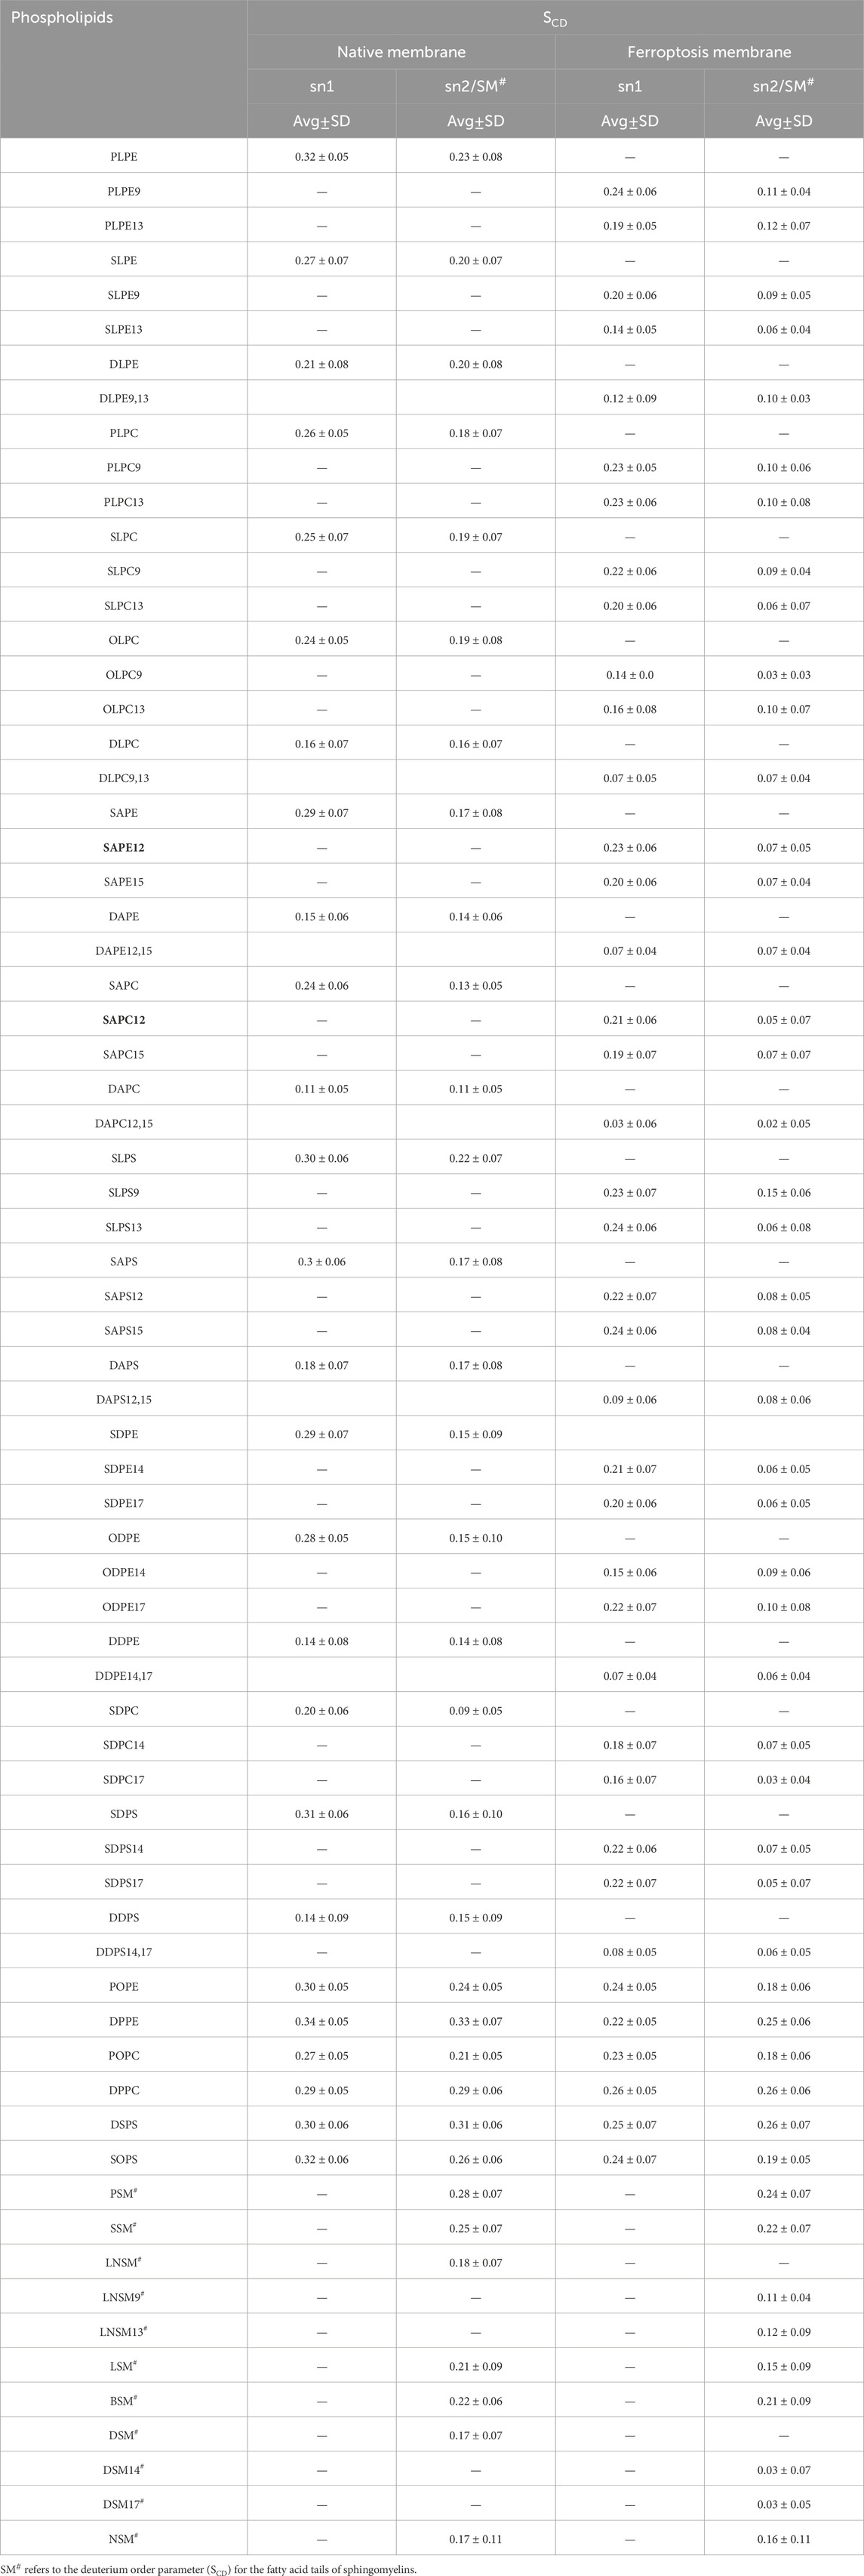
Table 1. The average deuterium order parameter (SCD) and standard deviation (SD) values over the last 400 ns (n = 2) for the sn-1 and sn-2 chains of phospholipids, as well as the fatty acid tails of the sphingomyelins (SM#) in the native and ferroptosis membranes.
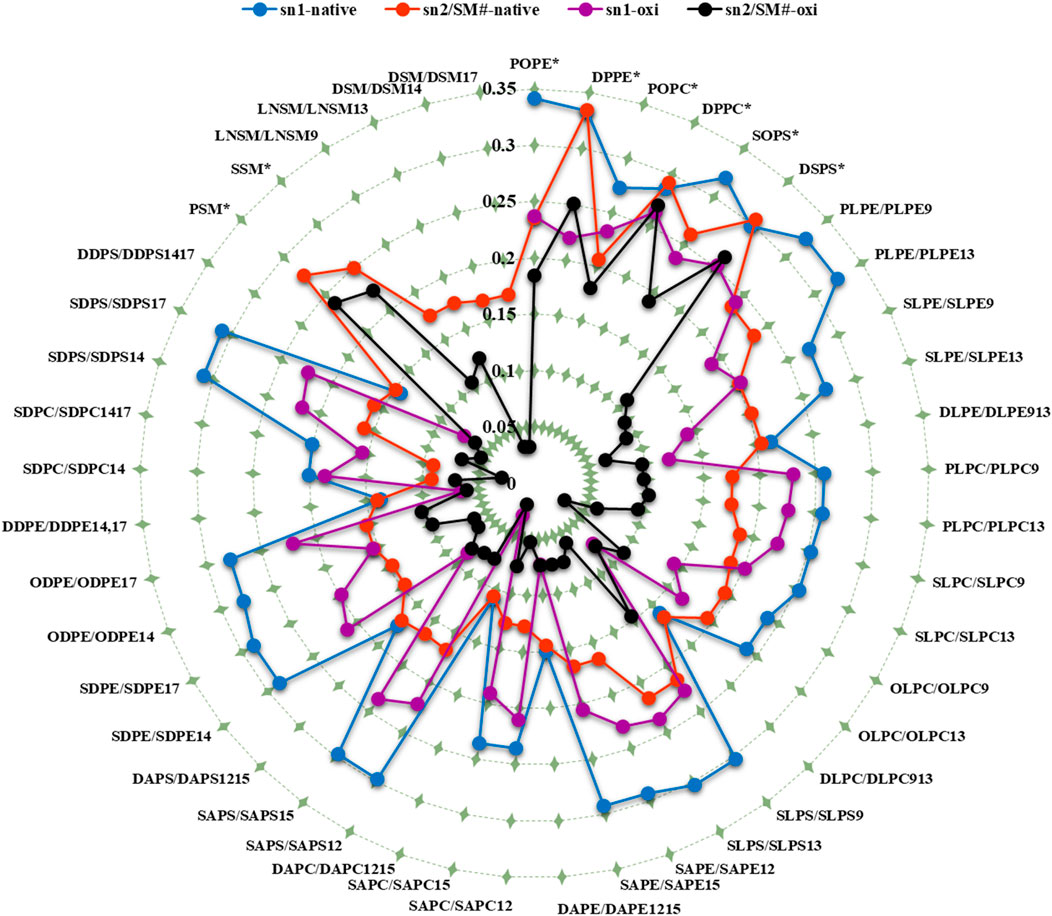
Figure 6. The average deuterium order parameter (denoted as <SCD>) over the last 400 ns (n = 2) for the sn-1 and sn-2 chains of phospholipids, as well as the fatty acid tails of the sphingomyelins (SM#), is compared between the native and ferroptosis membranes over the last 400 ns. For instance, the notation “PLPE/PLPE9” indicates that PLPE is present in the native membrane, while PLPE9, its oxidized isoform, is found in the ferroptosis membrane. The symbol “*” denotes non-oxidized lipids that exist in the ferroptosis membrane like their presence in the native membrane. The term “oxi” in the figure legend refers to the SCD of lipid tails in the ferroptosis membrane.
Additionally, the average SCD values of the same fatty acids in both sn1 and sn2 positions were calculated (Table 2). Results show that the average SCD of identical fatty acids in the sn1 and sn2 positions are nearly equal in both native and ferroptosis membranes, indicating motional degrees of freedom of acyl chains are independent of their position on phospholipids (see Supplementary Material for more discussion). Furthermore, although average SCD values were identically high for PAs and SAs, they successively decreased from PAs and SAs to OA, LA, AA, and DHA. This decrease results from kinks in polyunsaturated chains creating more free space, preventing the dense adjacent tail packing, and enabling greater freedom of movement.

Table 2. The average SCD for similar fatty acids in the sn-1, sn-2, and sphingomyelin over the last 400 ns (n = 2).
Figures 4, 5 demonstrate that when a polyunsaturated fatty acid occupies the sn2 position, the sn1 fatty acid exhibits a lower order compared to when a saturated fatty acid is in the sn2 position. This indicates that the presence of polyunsaturated chains in the sn2 position disrupts the ordering of the sn1 chains more than saturated chains do. Moreover, some phospholipids exhibit significant variations in the order parameters of the same acyl chains between native and ferroptosis membranes. This variation likely stems from the influence of nearby lipids, especially cholesterol, which plays a crucial role in modulating membrane order and dynamics (Yeagle, 2016) [see Supplementary Material for more discussion (Supplementary Figure S5)].
Overall, our results indicate that fatty acid oxidation increases the motional freedom of both oxidized and adjacent non-oxidized acyl chains. This heightened motional freedom in the membrane interior can enhance permeability to small molecules. High-ordered membranes are generally less permeable to water and other small molecules. Therefore, the increased fluidity and reduced order parameters observed in ferroptosis membranes suggest higher permeability compared to native membranes. Additionally, the variations in acyl chain order parameters arise from their proximity to cholesterols and other low-ordered chains. These findings highlight the critical roles of fatty acid oxidation, lipid composition, and cholesterol content in modulating membrane properties and permeability.
Lipid tails geometryTo determine the phospholipid structure, we analyzed the shapes of individual molecules by calculating the interior angles of lipid tails. We also calculated tilt angles representing tail and segment orientation relative to the membrane normal and membrane-water interface (Figure 7). Average angles were calculated for all phospholipid types in both native and ferroptosis membrane monolayers, including those with LAs (Supplementary Table S14), AAs (Supplementary Table S15), DHAs (Supplementary Table S16), and non-PUFAs (Supplementary Table S17). Furthermore, Table 3 shows average angles for four phospholipid groups (LA, AA, DHA, non-PUFA) in both monolayers using Supplementary Table Data. To analyze angle distributions, these four groups were examined in both native and ferroptosis membrane monolayers (Figure 7). This provided insights into phospholipid structural properties and membrane organization, detailed in the Supplementary Material.
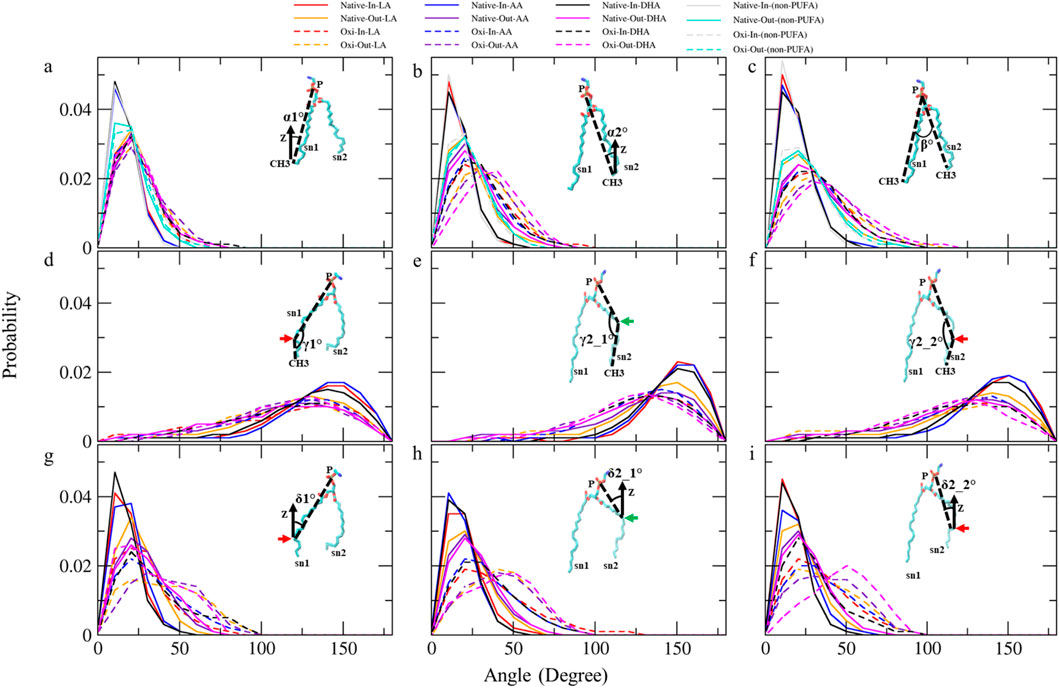
Figure 7. The analyses of angle distribution of lipid tails over the last 400 ns (n = 2) using various angles. Each angle is defined between two vectors (v1 and v2) representing different parts of the lipid tail. (A) α1° (v1: (P)-(sn1-CH3) and v2: (Z-axis)), (B) α2°(v1: (P)-(sn2-CH3) and v2: (Z-axis)), (C) β° (v1: (P)-(sn1-CH3) and v2: (P)-(sn2-CH3)), (D) γ1° (v1: (P)-(sn1-COOH) and v2: (sn1-COOH)-(sn1-CH3)), (E) γ2_1° and (F) γ2_2° (v1: (P)-(sn2-COOH) and v2: (sn2-COOH)-(sn2-CH3)), (G) δ1° (v1: (P)-(sn1-COOH) and v2: (Z-axis)), (H) δ2_1° and (I) δ2_2° (v1: (P)-(sn2-COOH) and v2: (Z-axis)).The angles capture the orientation and conformational changes of the lipid tails in the native and ferroptosis membranes. The term “Oxi” refers to the Ferroptosis membrane. (the green/red arrows refer to the carbons which carry the OOH group in oxidized tails at various positions (LA: C9, AA: C12, DHA: C14)/(LA: C13, AA: C15, DHA: C17)).
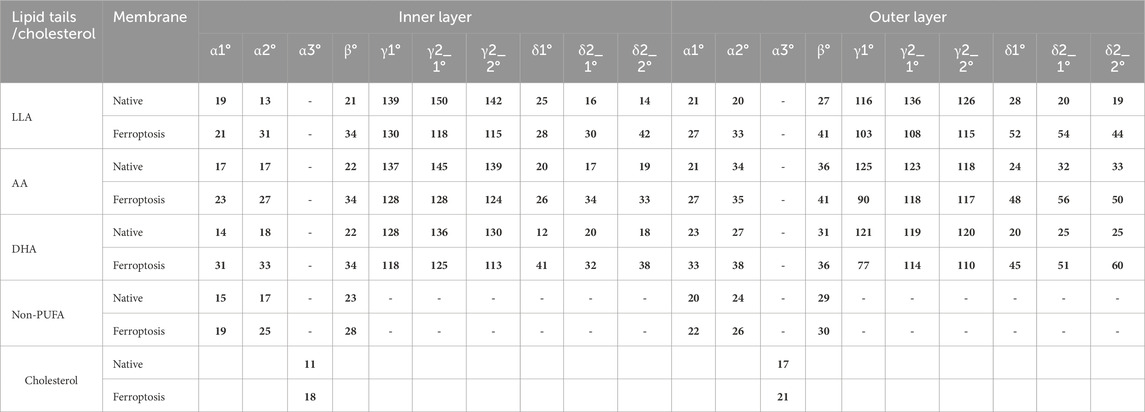
Table 3. The average tilt and inner angles of phospholipids containing LAs, AAs, DHAs, and non-PUFA tails, and the average tilt angle of the cholesterol over the last 400 ns (n = 2). Each angle is defined between two vectors, v1 and v2.
Table 3 shows the average α1 angles of LA, AA, DHA, and non-PUFA phospholipids increased in both ferroptosis monolayers versus native. Additionally, Figure 7A shows the α1 profiles of these groups shifted to higher angles in both ferroptosis monolayers. Similarly, average α2 angles increased for these groups in both ferroptosis monolayers (Table 3). The α2 profiles also shifted to higher angles (Figure 7B). The α1 and α2 increases were more significant for hydroperoxidized PUFA versus non-PUFA phospholipids, indicating more interfacial orientation in ferroptosis. Increased α1 and α2 correspond to greater area per lipid and decreased the thickness of the ferroptosis membrane. Moreover, Average β angles increased for all groups in both ferroptosis monolayers (Table 3). Figure 7C shows β profiles shifted to higher angles, with more significant shifts for hydroperoxidized PUFA phospholipids. The enhancement in β indicates an increase in the angle between sn1 and sn2 chains, also increasing area per lipid and decreasing thickness.
In both monolayers of the ferroptosis membrane, average angles of γ1, γ2_1, and γ2_2 decreased for LAs, AAs, and DHAs compared to the native membrane (Table 3). Similarly, Figures 7D–F show the decreased γ1, γ2_1, and γ2_2 angles for these groups in the ferroptosis membrane. The lower γ1, γ2_1, and γ2_2 angles indicate more significant bending at oxidation sites and shorter chain lengths. These results suggest a greater increase in bend angles at oxidation sites for the ferroptosis membrane phospholipids versus the native membrane. In addition, LAs, AAs, and DHAs showed increased average angles of δ1, δ2_1, and δ2_2 in both ferroptosis monolayers (Table 3). Figures 7G–I demonstrate shifts to higher angles for δ1, δ2_1, and δ2_2 in both monolayers, indicating pulling of oxidized carbons (OOH moiety) towards the lipid-water interface, resulting in a decrease in chain length on the z-axis. These findings suggest increased bending to polar interface at oxidation sites in ferroptosis phospholipids. Notably, the outer monolayer angles of δ1, δ2_1, and δ2_2 were higher at the oxidation site of tails, indicating a greater outer monolayer impact in the ferroptosis conditions compared to the inner layer.
Significant geometry differences were observed between the monolayers in the native and ferroptosis membranes. In both membranes, α1, α2, β, δ1, δ2_1, and δ2_2 were higher in the outer monolayer, indicating it is thinner than the inner layer. This was supported by the analysis of the APL and monolayer thickness confirming a larger APL and thinner thickness in the outer monolayers (Supplementary Table S13). These variations are likely attributable to the lipid composition, with the outer layer containing 143 lipids compared to 157 in the inner layer. The outer layer is predominantly composed of PC and SM, while the inner layer consists mainly of PE. The hydrophobic -N(CH3)3+ groups in PC and SMs lipids form clathrate-like structures, allowing hydrogen bonding with water molecules and thereby extending the APL. In contrast, PE lipids directly hydrogen bond with water, condensing their head group APL and increasing the monolayer thickness (Petrache et al., 2000).
The significant structural changes observed in ferroptos
留言 (0)