Microsatellites (MS) are highly polymorphic regions of DNA widely employed in fields such as oncology, forensics, plant breeding, comparative genomics, and microorganism research (Chambers and MacAvoy, 2000; Das et al., 2019). However, initiating studies on these repetitive elements can be challenging due to the fragmented nature of the existing knowledge. This fragmentation may arise from several factors, including the use of different synonymous terms, the variety of available methodologies, and the inherent limitations of the technique, all of which can pose challenges for researchers in the field (Vieira et al., 2016).
It has been approximately 35 years since the term Microsatellite (MS) was first introduced (Litt and Luty, 1989). Since then, these repetitive sequences have been referred to by diverse names. The most recurrent synonyms used almost interchangeably to MS in the literature and throughout this paper are Simple Sequence Repeats (SSRs) and Short Tandem Repeats (STRs). However, they are also mentioned in studies regarding Variable Number Tandem Repeats (VNTR), Simple Sequence Tandem Repeats (SSTR), Inter Simple Sequence Repeats (ISSR), Simple Sequence Length Polymorphisms (SSLP), and Sequence-Tagged Microsatellites (STMS) (Mudunuri et al., 2010b; Marwal et al., 2014; Jilani and Ali, 2022; Park et al., 2022).
Traditional methodologies for SSR exploration involve genomic fragmentation, microsatellite enrichment, and clone library construction, utilizing techniques such as PCR amplification in biological samples, gel electrophoresis, and Sanger sequencing. These methods have long been the cornerstone of wet laboratory experiments and are still widely employed in fields such as forensic identification, where length polymorphisms of certain STR markers in alleles are analyzed to compare individuals and determine, for example, paternity (Haddrill, 2021). While these techniques have significantly advanced the field, they often face practical challenges, including the need for laboratory infrastructure, equipment, reagents, and specific primers for SSR analysis. These factors contribute to high costs and labor-intensive procedures, particularly in large-scale studies (Thiel et al., 2003; Oliveira et al., 2008; Churbanov et al., 2012; Metz et al., 2016; Das et al., 2019; Guang et al., 2019; Luo et al., 2020).
The rise of Next-Generation Sequencing (NGS) platforms has been progressively shifting the emphasis from studying a few markers towards whole-genome analysis and population genetics (Vieira et al., 2016; Alves et al., 2022). Genome sequencing has become faster and more affordable, enabling the sequencing of hundreds of genomes and transcriptomes of key organisms (Guang et al., 2019), while generating large amounts of publicly available sequence data in databases (Alves et al., 2023). The direct sequence to SSR approach offers a distinct advantage over enrichment-based strategies, as it eliminates the need for prior selection of specific motifs or prior knowledge of the genomic SSR content (Castoe et al., 2012).
In silico analysis, which involves exploring microsatellites directly from sequence data through computational techniques, has emerged as a promising approach to manage the significant volume of data and expedite processing while maintaining precision (Oliveira et al., 2008; Vieira et al., 2016). This method is becoming increasingly prevalent for microsatellite discovery and marker development, as it is more efficient and cost-effective (Sharma et al., 2007; Churbanov et al., 2012; Vieira et al., 2016; Umang et al., 2022). A key advantage is that users can freely download genomes from databases such as NCBI and use free computational tools - referred to here as SSR tools - to perform microsatellite identification (also known as SSR mining or prospection), analysis, and even develop new markers, design primers, and simulate primer amplification in silico (da Costa Pinheiro et al., 2022). However, it is important to recognize that despite the potential of in silico SSR analysis, wet lab methodologies continue to play a crucial role, particularly in validating computational predictions and providing critical biological insights (Li et al., 2020).
Regarding the identification of microsatellites through computational methods, numerous tools have been developed over the years, primarily to address gaps identified in existing software, allowing for more sensitive and efficient analysis of these repetitive elements (Pickett et al., 2016). Some older but well-established tools continue to be widely cited in the literature, such as TRF (Benson, 1999) and RepeatMasker (Tarailo-Graovac and Chen, 2009), while new ones are continually emerging, including EasySSR (Alves et al., 2023) and MegaSSR (Mokhtar et al., 2023). The diversity of these tools is evident in various aspects such as execution, input type, and outputs, offering researchers a broad range of options tailored to different datasets and experimental needs (Merkel and Gemmell, 2008; Mathur et al., 2020).
The abundance of tools available for SSR analysis presents a challenge for researchers seeking the most suitable option for their specific needs. This situation often initiates a cycle: a researcher searching for a tool may encounter numerous options but feel uncertain about which to choose. Consequently, many tend to select tools based on their visibility in methodologies or high citation rates. While these tools might be perfectly suitable, some researchers may find them lacking, necessitating adaptations to their work or the development of new tools, often unaware that alternatives with the desired functions may already exist. The fragmentation of the SSR literature further complicates this process, making it challenging to identify these alternative tools. This cycle not only boosts the citation counts of popular tools but also leads to the continual emergence of new tools, many of which are innovative and more efficient, while others may offer redundant functions and performance (Mudunuri et al., 2010b; Lim et al., 2013).
Despite the availability of insightful reviews on microsatellite prediction software over the past decades, the accelerating pace of development in the field leads to rapid information obsolescence (Leclercq et al., 2007; Sharma et al., 2007; Merkel and Gemmell, 2008; Mudunuri et al., 2010b; Lim et al., 2013; Zribi et al., 2016; Mathur et al., 2020). For example, new tools have been introduced, and some of the listed tools are no longer operational, emphasizing the need for ongoing reviews to ensure that the information presented remains current and comprehensive regarding the maximum number of available tools (Mathur et al., 2020).
This paper presents an exhaustive examination of the current state of the art microsatellites mining tools. To provide guidance to users of SSR tools, it comprises two main sections: “Section 1: A guide to what are microsatellites” – the SSR section, and “Section 2: A guide to tools for identifying microsatellites” – the tools section. Advanced readers may focus on the section of interest without detriment to understanding if they skip one of the sections. However, for readers seeking a comprehensive understanding, reading the SSR section is recommended to grasp the main concepts that will aid in understanding what SSRs are and assist in interpreting many of the terms used in the parameters and outputs of the SSR tools. In the tools section, the goal was to gather as many SSR tools as possible, group these tools into subgroups to facilitate analysis, and provide informational tables highlighting various criteria that can influence tool selection. Lastly, the discussion highlights key factors influencing tool selection, addressing the question, “How to choose the best tool?”. The purpose of this article is not to indicate the best SSR tools but to serve as a guiding resource for users, helping them understand what microsatellites are and assisting them in the conscientious selection of the most suitable tool for their specific research requirements.
2 Section 1: a guide to what are microsatellitesMicrosatellites are short repetitions in tandem of motifs consisting of 1–6 base pair (bp), that may appear with or without interruptions, distributed across the genomes of all known organisms, including eukaryotes, prokaryotes, and viruses, as well as in some organelles (Chambers and MacAvoy, 2000; Sahu et al., 2020). A single genome can contain thousands of distinct microsatellite loci, as illustrated in Figure 1, where three SSR loci were compared in two circular genomes of prokaryotes. SSR loci are particularly useful in fields where the polymorphism of specific loci can be compared and analyzed to establish close relationships, such as in paternity testing in forensics (Vieira et al., 2016).
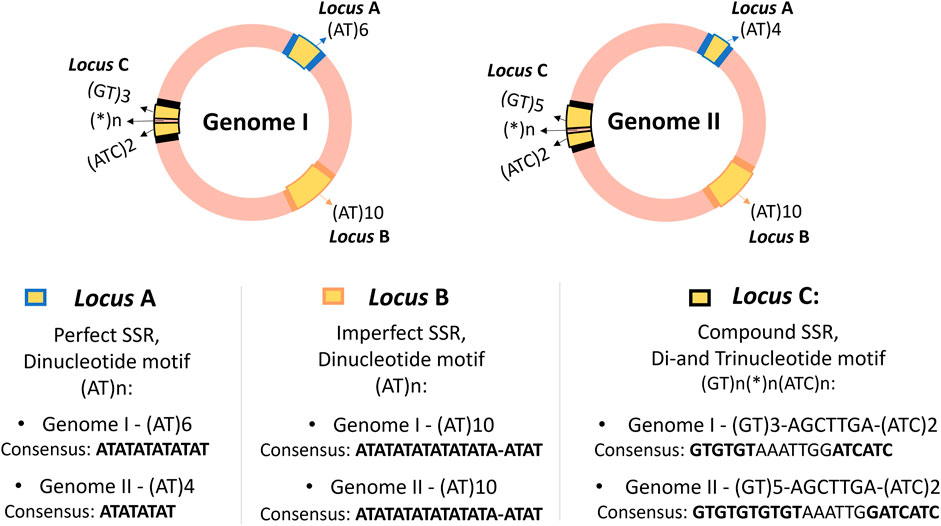
Figure 1. Representation of three SSR loci in two hypothetical circular genomes of closely related prokaryotes, showing the distribution of SSR loci, their flanking regions, classification, and consensus sequence of the loci. The genomes are highlighted in pink, with SSR loci in yellow (loci A, B, and C) and flanking regions in blue, orange, and black. Although SSRs are also present in eukaryotic genomes, they are didactically illustrated as prokaryotic circular genomes for easier visualization of locus positions. The loci are present in both genomes, suggesting they could be molecular marker candidates. The same motifs can appear in different regions, as seen with loci A and B with the motif (AT)n, but they are considered distinct SSR loci based on flanking regions and genetic context, not just the repeat motif. This example also illustrates possible variations without generalizing polymorphism patterns, serving only to demonstrate examples of Perfect, Imperfect, and Compound SSR loci. Loci A and C show length polymorphism, while locus B shows no length polymorphism, despite presenting a conserved deletion in one of its repeats.
To truly understand what microsatellites are, however, this section aims to go beyond this traditional definition. It is anticipated that Figure 1 may prompt questions in the reader’s mind, as they may not yet be familiar with the specific terminology. To fully comprehend the advanced concepts illustrated in Figure 1, it is advisable to first understand that SSRs are polymorphic repetitive elements and to grasp their importance and classifications. Readers are encouraged to revisit this figure after reading this section. This deeper understanding will allow not only a clearer interpretation of SSRs but also aid in making sense of the outputs from SSR tools and extracting biological meaning from the computational predictions.
2.1 Repetitive elements, tandem repeats and microsatellitesGenomes consist of numerous DNA sequences organized into arrays of different sizes. As depicted in Figure 2, a continuous segment of DNA is called a sequence and is categorized into (i) unique DNA sequences and (ii) repeated DNA sequences, also known as Repetitive Elements or repeats (Richard et al., 2008). Unique segments are non-repetitive, while repetitive elements appear multiple times in the genome (Agarwal and States, 1994; Chambers and MacAvoy, 2000; Richard et al., 2008; da Silva Lopes et al., 2015). Repetitive Elements (RE) can be classified into two groups: (i) Dispersed or Interspersed repeats and (ii) Tandem repeats (Figure 2) (Richard et al., 2008; Lerat, 2010; Girgis and Sheetlin, 2013; Dumbovic et al., 2017; Srivastava et al., 2019).
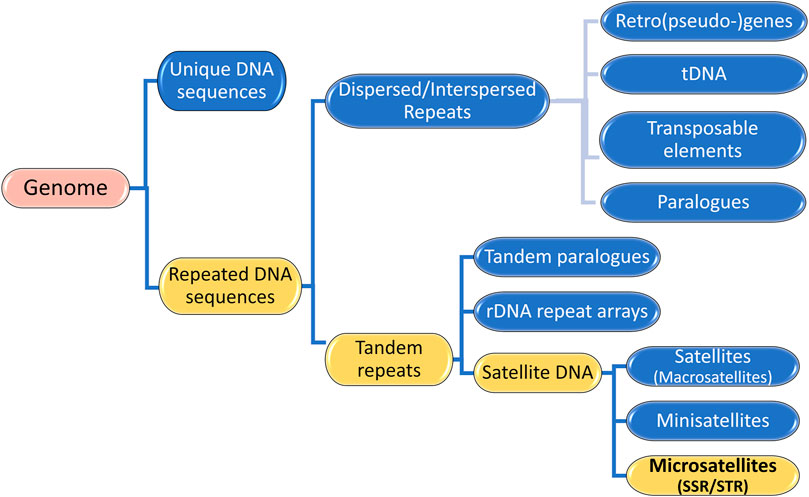
Figure 2. Genome Composition: Unique DNA sequences and Repeated DNA sequences. The illustration highlights that Microsatellites are Satellite DNA, a subcategory of Tandem Repeats, which are Repetitive Elements in a Genome.
Tandem repeats (TR) comprise repetitive sequences that occur head-to-tail arrangement and their classification includes (i) gene tandems, (ii) ribosomal DNA (rDNA) repeat arrays, and (iii) satellite DNA (Figure 2) (Richard et al., 2008; Lerat, 2010). A tandem repetition locus is an array with size of “k” base pairs (bp), consisting of “w” iterations of a repeat motif with “n” nucleotides, being mutable regions flanked by sequences that are usually conserved (Figure 3) (Alves et al., 2023). Satellite DNA, a type of tandem repeat, can be further classified as (i) satellite or macrosatellite, (ii) minisatellite or (iii) microsatellite (Figure 2) (Lim et al., 2013; Avvaru et al., 2018). As illustrated in Figure 3, this classification is based on the size of the repeated nucleotide pattern, designated as “n” or “motif”. If the repeat motif has large periods, exceeding 100 bp, it is named macrosatellite; those with periods exceeding 10 bp are known as minisatellites, while microsatellites are short tandem repeats with motifs of “n” ≤ 6 bp (Buschiazzo and Gemmell, 2006; Kelkar et al., 2010; Chen et al., 2011a; Lim et al., 2013; Saeed et al., 2016; Dumbovic et al., 2017; Guang et al., 2019; Alves et al., 2023).
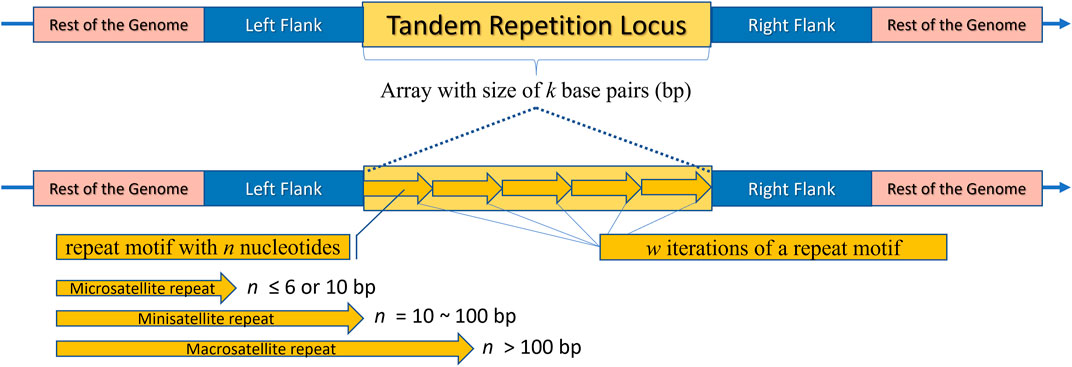
Figure 3. Schematic representation of a Tandem Repeat locus structure. The rest of the genome is highlighted in pink, flanking regions in blue, and the repeat locus itself in yellow. The locus consists of an array with a size of “k” base pairs. The bottom part of the image shows an enlarged view of the locus, where arrows are repeated side by side “w” times, representing the tandemly repeated motifs. It is noteworthy that each arrow represents an illustrative motif, which is a pattern composed of “n” nucleotides. Depending on “n”, the locus can be classified as a Microsatellite, Minisatellite, or Macrosatellite.
Nevertheless, there is no consensus regarding the classification of microsatellites and minisatellites, which has led to distinct categorizations among researchers (Chambers and MacAvoy, 2000; Lim et al., 2013; Alves et al., 2023). While most papers define SSRs as 1 to 6 base pair repeats, some consider larger motifs up to 10 bp still as SSR. This results in a microsatellite threshold ranging from 6 to 10 bp (Richard et al., 2008; Churbanov et al., 2012; Korotkov et al., 2021). The terminology surrounding the variable number of tandem repeats (VNTRs) also faces challenges in terms of consensus. Some authors classify these sequences as synonymous with minisatellites, while other researchers categorize them within the broader group of microsatellites and minisatellites (Karaca et al., 2005; Zribi et al., 2016; Lu et al., 2021).
The repetitive nature of these regions often results in sequencing errors, misalignment, and incomplete assemblies, especially when using short-read sequencing. This is a critical limitation, as many pathogenic STR alleles are longer than short reads (Uguen et al., 2024). Frequently, this leads to the absence of these regions from reference genomes or their misplacement within the genomic context. However, despite once being regarded as non-functional or “junk” DNA, numerous repeats have since been identified as important structural or evolutionary markers (Dumbovic et al., 2017). Recent advances in long-read sequencing and alignment tools have enhanced SSR detection by capturing full repeat regions, overcoming some limitations inherent to short-read (Editorial Nature, 2024).
2.2 Importance of microsatellitesSSR loci are highly polymorphic, prone to genetic mutations due to errors in DNA replication, recombination, or defective mismatch repair (dMMR), leading to microsatellite instability (MSI) (Yamamoto et al., 2024). This instability can result in the addition or deletion of SSR motifs (Figure 1), leading to length polymorphism and the generation of new inheritable SSR alleles (Jäger, 2022; Mokhtar et al., 2023). An allele with a frequency exceeding 1% within a population is considered polymorphic (Xia et al., 2016; Das et al., 2019; Guang et al., 2019).
Due to their significant role in genetic variation, SSRs have emerged as valuable molecular markers for genetic analysis. Their high variability and polymorphism, along with co-dominant inheritance and non-random distribution in the genome, contribute to their utility (Palliyarakkal et al., 2011). Moreover, the reproducibility of SSRs and the specific design of primers facilitate their amplification (Untergasser et al., 2012), enabling differentiation within and between populations (Marwal et al., 2014; Alves et al., 2023). Researchers explore various aspects of MS, including their incidence, frequency, prevalence, abundance, distribution, polymorphisms, composition, information content, localization, transferability, and associations with other sequence elements (Thiel et al., 2003; Sharma et al., 2007; Jilani and Ali, 2022).
SSRs widespread presence allows for comprehensive studies of DNA, transcribed sequences, and their corresponding proteins, as they can be found in both coding and non-coding regions, and are identifiable in various contexts, including sequenced DNA, assembled genomes, genes, and expressed sequence tags (ESTs) (Thiel et al., 2003; Karaca et al., 2005; Mathur et al., 2020).
In addition, MS have diverse applications across various fields. They are associated with over 30 human genetic diseases (Marwal et al., 2014; Lu et al., 2021) and very important in oncology (Baudrin et al., 2018). For instance, Indels in coding microsatellites (cMS) within tumor suppressor genes like TGFBR2 and ACVR2 act as key drivers of cancer progression in mismatch repair-deficient (MMRd) cells, generating immunogenic frameshift peptide (FSP) neoantigens. Darwinian selection favors cMS mutations that enhance cell survival and tumor growth, resulting in their accumulation. Thus, MMRd cancers are immunogenic not only due to a high number of somatic mutations but also the abundance of FSP-derived epitopes generated by these indels (Hernandez-Sanchez et al., 2022).
In forensics, STRs can be used for identification and parentage determination, as they form a “genetic fingerprint” for each individual (Haddrill, 2021; Jäger, 2022). By analyzing the distribution of specific STR alleles across populations, researchers can uncover group relationships and trace migration patterns, providing insights into human evolutionary history (Editorial Nature, 2024). Moreover, MS have been linked to influencing virulence in pathogens (Reneker et al., 2004) and can serve as biomarkers in fungi (Sokolova et al., 2022), protozoa (Durigan et al., 2018), bacteria (da Costa Pinheiro et al., 2022), and viruses (Laskar et al., 2022). They can also be applied in diagnostics, as exemplified by the investigation of leprosy transmission utilizing microsatellite typing through amplification of compound SSR loci (Mohanty et al., 2019).
Furthermore, SSRs are widely applied in plant research and breeding, providing insights into genetic diversity, population structure, and evolutionary patterns (Biswas et al., 2018). They aid in crop improvement by identifying alleles linked to desirable traits (Oliveira et al., 2008), and can play a crucial role in conservation biology by assessing genetic diversity in endangered plants (Yuan et al., 2018). Additionally, SSRs help trace the evolutionary history of plant species, providing insights into their adaptation and divergence (Morgante et al., 2002; Oliveira et al., 2008; Yuan et al., 2018).
2.3 Classifications of microsatellitesIn the literature it is usual to see SSR categorized based on various parameters (Figure 1). Common classifications include those based on repeat classes, perfection level, and tract composition, as illustrated in Figures 4, 5. Additional sub-classifications may be applied depending on specific research objectives (Mudunuri and Nagarajaram, 2007; Chen et al., 2011b; Ledenyova et al., 2019; da Costa Pinheiro et al., 2022).
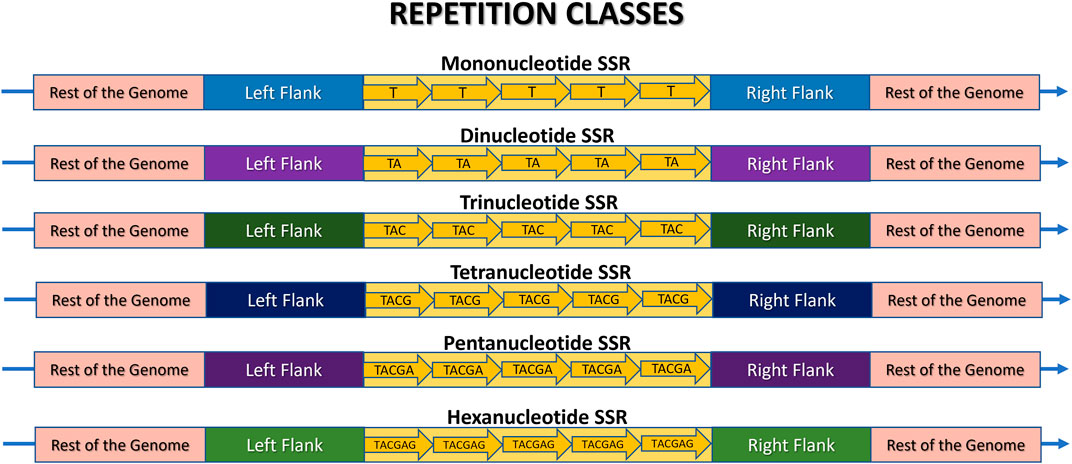
Figure 4. Schematic representation of a Microsatellite locus structure and its various repeat classes: mono-, di-, tri-, tetra-, penta-, and hexanucleotide sequences. The rest of the genome is highlighted in pink, the flanking regions are in different colors to indicate their presence in the same genome, but at different positions, and the SSR locus itself is in yellow. Each arrow represents an illustrative motif, which is a pattern composed of “n” nucleotides iterated “w” times. In this example, w = 5 for didactic comparison purposes. Thus, the illustrative mononucleotide (n = 1) is represented as (T)5, the dinucleotide (n = 2) as (TA)5, the trinucleotide (n = 3) as (TAC)5, the tetranucleotide (n = 4) as (TACG)5, the pentanucleotide (n = 5) as (TACGA)5, and the hexanucleotide (n = 6) as (TACGAG)5.

Figure 5. Schematic representation of a Microsatellite locus structure and its classification as Simple (Perfect, Imperfect) or Compound. The rest of the genome is highlighted in pink, the flanking regions are in different colors to indicate their presence in the same genome, but at different positions, and the SSR locus itself is in yellow. The arrow indicates the repeats. In Perfect SSRs, all repeat motifs are identical. In imperfect SSRs, almost all motifs are identical, but there are mismatches in one or more of them, highlighted in red. In compound repeats, there are two or more motifs composing the same SSR, which can be perfect or imperfect, and can be adjacent (side by side) or interrupted, meaning they are separated by a maximum distance.
2.3.1 Based on repetition classesMicrosatellites can be classified into repetition classes based on the size “n” of their repeated nucleotide pattern, which is commonly referred to as the motif (Figure 3). As illustrated in Figure 4, the repetition classes of SSRs include: (i) Mononucleotide, which consists of “w” repetitions of a single nucleotide (n = 1), for example, (T)5; (ii) Dinucleotide, composed of “w” repetitions of a pair of nucleotides (n = 2), such as (TA)9; (iii) Trinucleotide, characterized by “w” repetitions of three nucleotides (n = 3), such as (TAC)12; (iv) Tetranucleotide, consisting of “w” repetitions of four nucleotides (n = 4), e.g., (TACG)8; (v) Pentanucleotide, formed by “w” repetitions of five nucleotides (n = 5), for instance (TACGA)4; and (vi) Hexanucleotide, consisting of “w” repetitions of six nucleotides (n = 6), such as (TACGAG)5 (Sharma et al., 2007; Sahu et al., 2020).
Usually, SSR tools permit users to define the minimum number of repetitions (w) that must occur for a motif (n) to be considered an SSR. In instances where the tool identifies a repetition of the motif with fewer than the specified repetitions, that SSR will not be included in the final output (Alves et al., 2023). It is worth noting that there is no standard value for this parameter, as it can vary depending on the specific organism under study. Therefore, it is advisable for users to consult relevant literature on the organism in question to identify the most suitable parameters for their study (Oliveira et al., 2008).
2.3.2 Based on perfection levelAs SSRs are prone to suffer mutations, they can be classified as (i) Perfect SSR (p-SSR or pSSR) or (ii) Imperfect SSR (i-SSR or iSSR) (Figure 5) (Mokhtar and Atia, 2019; Song et al., 2021).
Perfect microsatellite tracts, also referred as Pure or Exact, consist of motifs that are replicated multiple times with precise replication of the exact pattern, such as (AT)20 and the examples in Figure 4, without any deviations. However, as mutational events occur, mismatches can arise, leading to disruptions in the p-SSR through base substitutions or nucleotide insertions or deletions (INDELs) (Figure 5). Consequently, the p-SSR is transformed into an imperfect SSR when the copies deviate by at least one base pair. The i-SSR may also be referred to as Approximate or Interrupted (Sharma et al., 2007; Lim et al., 2013; da Costa Pinheiro et al., 2022). For example, if the p-SSR (AT) 20 was interrupted due to an insertion of a “G” it would be classified as an i-SSR (AT) 12 G (AT) 8 by some SSR mining tools (Alves et al., 2023).
Most research in this field has concentrated on perfect repeats, given their association with selective forces and higher length polymorphism. Consequently, the prevalence of SSR tools with algorithms that can only identify perfect SSR (Mudunuri and Nagarajaram, 2007; Behura and Severson, 2015; Ledenyova et al., 2019). In contrast, imperfect SSRs are more stable and less susceptible to slippage mutations, resulting in less length polymorphism but featuring INDELs, which can be valuable for studying single nucleotide polymorphisms (SNPs) (Metz et al., 2016; Guang et al., 2019). It is worth noting that when mismatches are allowed in SSR tools, some SSRs previously identified as p-SSR may be elongated and reclassified as i-SSR arrays (Alves et al., 2023).
2.3.3 Based on tract compositionMicrosatellite tracts may exhibit two distinct compositions. They may either comprise a single motif or a combination of motifs. In this way they can be categorized as (i) Simple SSRs or (ii) Compound SSRs (c-SSRs, cSSRs) (Figure 5) (George et al., 2015; Sahu et al., 2020; Song et al., 2021).
Simple SSRs comprise p-SSR and i-SSR and consist of loci with a unique motif repeated in tandem, such as (TA)7. Compound microsatellites, also referred as Fuzzy or Interrupted by authors, arise from mutations or imperfections in SSR (George et al., 2015). They are loci composed of two or more simple SSR motifs, that might be adjacent or interrupted, separated by a nucleotide sequence (Chen et al., 2011b; Ledenyova et al., 2019). For instance, in Figure 5, “X” represents the sequence interrupting the two parts of the SSR in (TA)3-X-(AGTC)2. In Figure 1 simple and compound SSR loci are illustrated and compared in two hypothetic circular genomes.
In the context of SSR mining tools, whether two simple microsatellites are regarded as a c-SSR is contingent upon the distance between motifs resulting from the interrupting sequence. For instance, two SSRs separated by distances falling within a specified range (dMAX) may be regarded as a single c-SSR tract. However, depending on the dMAX set by the user, it is possible that some C-SSRs could be considered as two distinct SSRs (Alam et al., 2019).
2.3.4 Based on genomic contextMicrosatellites can be classified as either (i) Coding SSRs, if they are fully or partially situated within coding regions, or (ii) Non-coding SSRs, if they are located in regions that do not encode proteins (Mudunuri and Nagarajaram, 2007; da Costa Pinheiro et al., 2022; Alves et al., 2023).
The presence of SSRs in coding regions results in the emergence of these repetitive patterns in transcribed sequences and in their proteins, reflecting potential associations with genes and phenotypes (Vieira et al., 2016).
In general, the most SSRs are present at intergenic and non-coding regions, and less frequent in exons and genic regions (Srivastava et al., 2019). This is primarily attributed to the high mutation rate of microsatellites, which could potentially disrupt gene expression (Vieira et al., 2016). Most coding regions are composed of SSRs with tri- and hexanucleotide motifs. This is likely due to the selective pressure against mutations that could alter the reading frame (Li et al., 2002; Vieira et al., 2016). The length variations of SSRs within exons have been associated with various diseases, including Huntington’s and Spinocerebellar Ataxia (Srivastava et al., 2019).
Some SSR mining tools can ascertain whether an SSR resides in a coding region, although this requires the input of an additional file by the user, in which the regions that are and are not genetic should be indicated (Alves et al., 2023).
2.3.5 Based on mutability and array lengthRegarding their mutability, microsatellites can be categorized as: (i) Hypermutable SSRs, which consist of multiple repeat units that exhibit high rates of INDELs; (ii) Mutable SSRs, which have intermediate-length repeat tracts and therefore lower mutation rates; and (iii) Proto-mutable SSRs, which consist of a small number of repeat units and exhibit mutation rates slightly higher than the average for the genome (Bidmos and Bayliss, 2014).
There is an additional classification that considers mutability and array length, designated “k” This classification is as follows: (i) Class I, hypervariable markers, with arrays exceeding 20 base pairs (bp); (ii) Class II, potentially variable markers, with arrays from 12 to 20 bp; and (iii) Class III, SSRs, less variable markers, characterized by smaller arrays with less than 11 bp (Temnykh et al., 2001; Saeed et al., 2016).
Although the classifications in question might not be commonly employed in a general context, they do exist in certain tools designed to study polymorphic SSRs (PolySSRs). Consequently, this classification should be carefully considered, particularly by those engaged in the development of polymorphic SSR markers (Xia et al., 2016).
At this point, the reader has been introduced to the fundamental concepts and significance of microsatellites, which are crucial for understanding their applications in various fields. With this foundational knowledge, Figure 1 should now be more comprehensible, offering clarity on the discussed principles.
3 Section 2: a guide to tools for identifying microsatellitesThe standard procedure for in silico SSR analysis involves obtaining the DNA data to be analyzed and using it as input for an SSR tool. These tools typically identify SSRs and their positions in the sequence, enabling various analyses. However, the abundance of available tools may challenge users in identifying the most suitable one for their in silico studies (Alves et al., 2023). Considering that the reader now possesses understanding of the key concepts of MS, this section aims to provide a comprehensive analysis of the tools utilized for tandem repeat prospecting, focusing on microsatellite mining software, and provide guidance on selecting the most appropriate tool for their specific research needs.
To achieve this, a literature review was conducted on Pubmed with the terms “Review” and “SSR” or “STR” or “Microsatellites”, and after careful evaluation were included in the study all review papers that focused on tools for SSR mining. To find more tools, this was complemented by a comprehensive survey of the broader SSR literature, with particular attention to references made in papers that released new softwares. These articles often compare the newly launched tools with existing ones, enabling the identification of most tools released to date. A total of 74 tools were identified, with every SSR tool found included in the analysis. If a tool is not listed, it was likely not discovered by the authors at the time this paper was written. The citation index for each tool’s publication was obtained from Google Scholar, and citations were compared to determine which tools were most widely adopted by the scientific community. Their availability was assessed, and an in-depth analysis was conducted for each functional tool, including parameters, inputs, outputs, and other relevant aspects, which are discussed in the following sections.
3.1 Overview of all tools identified in this paper3.1.1 Previous reviews of microsatellite search toolsSeven reviews regarding SSR tools have been retrieved (Leclercq et al., 2007; Sharma et al., 2007; Merkel and Gemmell, 2008; Mudunuri et al., 2010b; Lim et al., 2013; Zribi et al., 2016; Mathur et al., 2020). The maximum number of tools mentioned in a single article was 25 (Sharma et al., 2007), and by combining the data from the authors, a total of 37 tools were identified, some of which were cited by most of the papers (Figure 6). The Tandem Repeats Finder (TRF) (Benson, 1999) stands out as the most frequently cited tool, having been cited by all the review papers. Second is Mreps (Kolpakov et al., 2003) mentioned in 06 papers, followed by Sputnik (La Rota et al., 2005), cited by 05 authors. Fourth on the list are IMEx (Mudunuri and Nagarajaram, 2007), Misa (Thiel et al., 2003) and STAR (Delgrange and Rivals, 2004), all of which are cited by the majority (04 out of 07 reviews). The remaining tools are mentioned in Tables 1, 2.
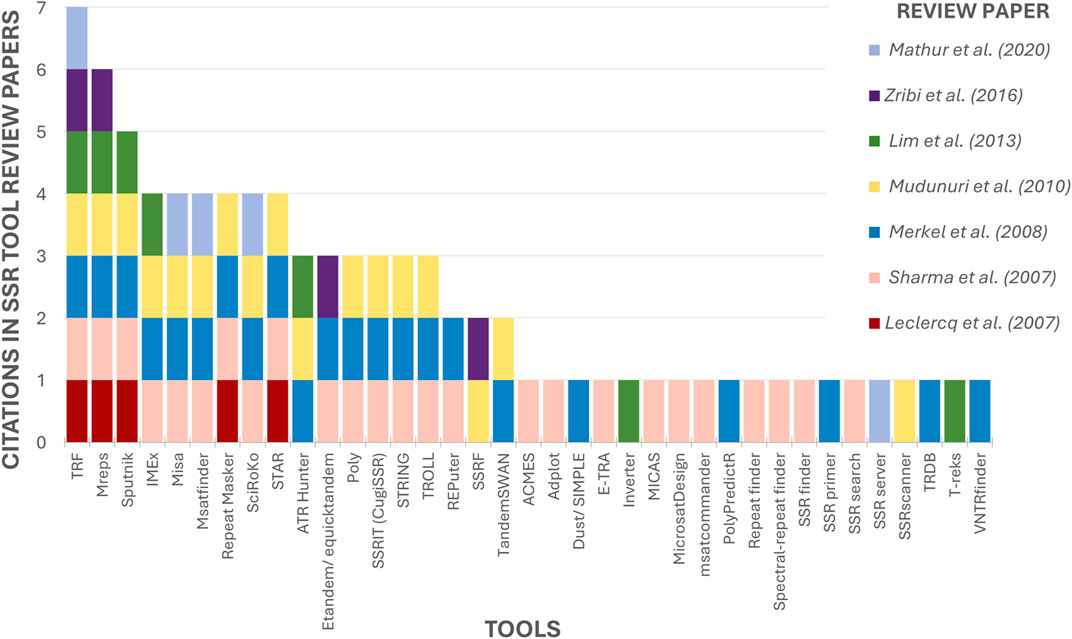
Figure 6. Ranking of mentioned tools by previous SSR tools Review papers. The X-axis contains the 37 tools mentioned in SSR tool review papers. The Y-axis indicates how many review papers cited each tool.
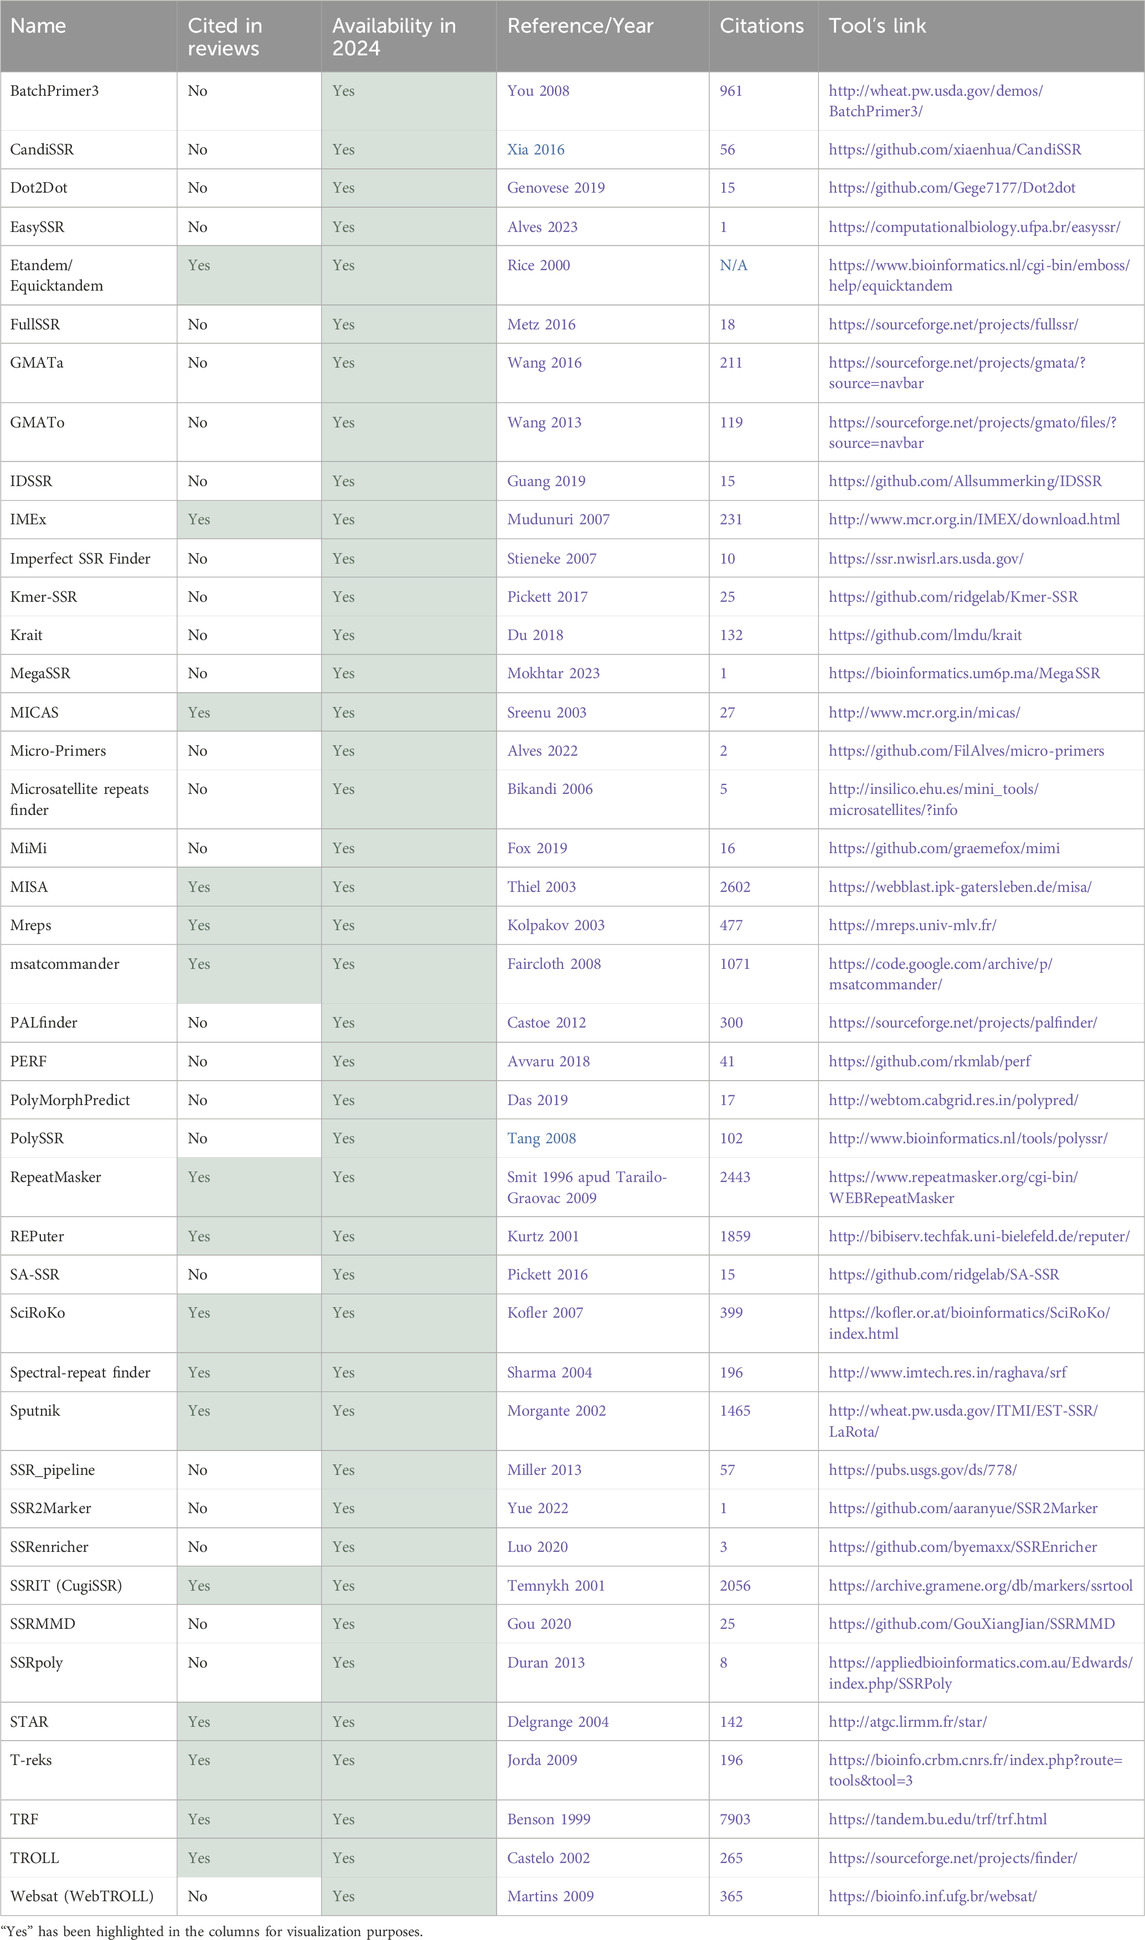
Table 1. Total tools identified part 1–42 tools available in 2024.
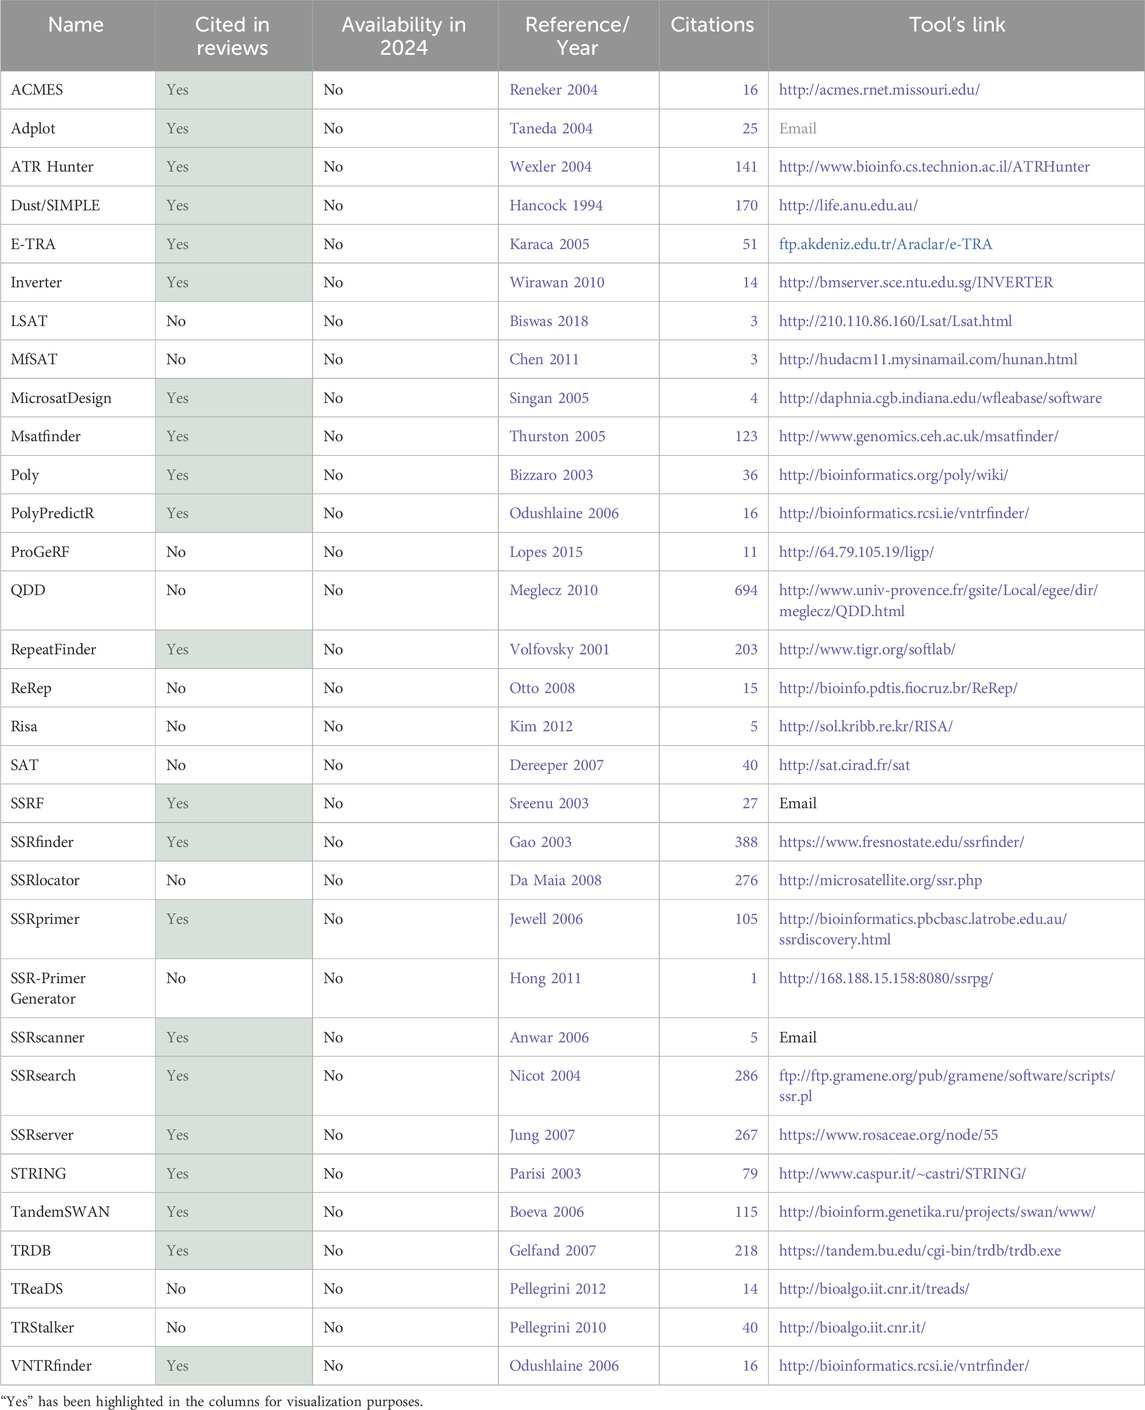
Table 2. Total tools identified part 2–32 tools not available in 2024.
Only 18 tools, approximately 49% of the total, were cited by more than one author (Figure 6), indicating that despite the numerous tools that exist, previous review articles have been limited to examining only a few of them. This shows that the current state of knowledge is scattered and that a comprehensive review such as the present study is needed to collect and analyze the maximum possible number of tools.
In addition to the 37 tools referenced in previous reviews, an exhaustive examination of microsatellite literature and an analysis of references cited in other published tools identified an additional 37 tools, resulting in a total of 74 tools that will be examined in the following sections. These tools were identified and summarized in Tables 1, 2, with further details provided in the subsequent sections.
3.1.2 Analysis of availability of the toolsThe first aspect that was considered was the tool’s availability for present-day usage by users. Given the dynamic nature of the field, there is a risk that individuals relying on previous review articles to guide their tool selection for methodologies might find their chosen tool non-operational. All 74 tools were assessed regarding their accessibility status. Multiple attempts were made to access the tools between 2023 and 2024 using the links provided in the papers. Figure 7A illustrates that only half of the total 74 tools had previously been cited in reviews. Of these 37 tools referenced in the review articles, only 16 are still available. This implies that 57% of the previously reviewed tools are no longer functional. Conversely, 70% of the tools identified in this article alone are available. Overall, out of the total of 74 tools initially identified, 42 remained functional and were summarized in Table 1, while the 32 tools not accessible at the time of analysis were labeled as not available and grouped in Table 2.
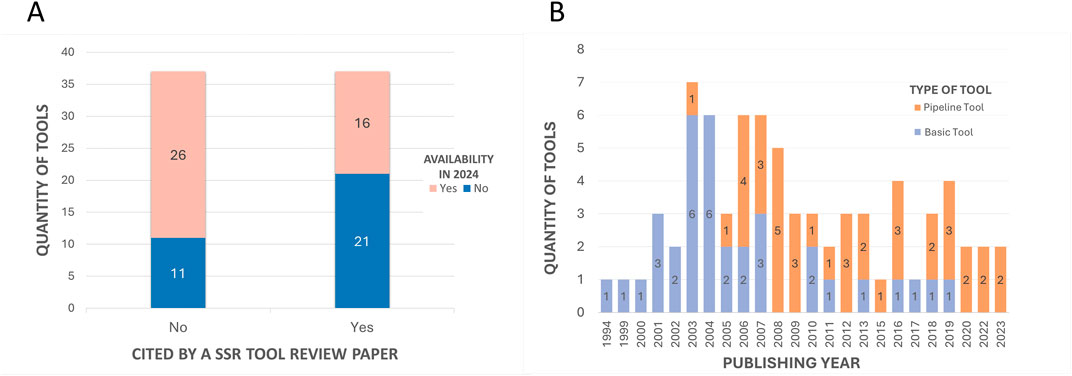
Figure 7. Quantitative comparisons with subclassifications. (A) - Comparison of the number of tools cited in previous SSR tool review articles and those cited exclusively in the current study, with subclassifications by the availability of tools. The “Yes” column on the right represents the 37 tools cited by the 07 previous review articles. The “No” column represents the other 37 tools mentioned in this article that were not mentioned in the other reviews. In both columns, the 42 tools that are available in 2024 (Table 1) are highlighted in pink, while the 32 that are no longer available (Table 2) are highlighted in blue. (B) - Comparison of the number of tools published per year with subclassifications by tool type. The subclassification includes basic tools (single-purpose tools that perform specific functionalities and/or serve as a base for others to integrate into the pipeline) or pipeline tools (tools that integrate several others).
3.1.3 Analysis of temporality of tool’s release and citationsThe historical development of microsatellite analysis can be traced through the papers of each tool (Tables 1, 2). These indicate a temporal range of release years between 1994 and 2023, as evidenced in Figure 7B. This suggests a dynamic evolution within the field, with the introduction of innovative tools and methodologies occurring continuously (Alves et al., 2022). Prior to 2005, the prevailing trend in the field was the development of basic tools that introduced new algorithms or approaches, performed specific functions, or served as a basis for integration into pipelines. From 2006 onwards, the focus has shifted to the release of pipeline tools, demonstrating a pattern where modern tools build upon established frameworks and incorporate additional features, to enhance analytical capabilities for various objectives.
The continuous release of new tools prompted an investigation into the relative prominence of these tools compared to older ones. The investigation also sought to determine whether the high citation counts for a tool could be attributed to the fact that it was mentioned in review articles. To test this hypothesis, the citation counts for each tool’s original papers were assessed using Google Scholar in early 2024 (Tables 1, 2).
A discrepancy was observed between the order of the tools most frequently mentioned in review articles (Figure 6) and their position in the citation ranking depicted in Figure 8. Nevertheless, a considerable number of the most frequently cited tools were referenced in review articles. At the time of analysis, TRF (Benson, 1999) remained the most frequently cited tool, with a substantial margin of citations over the second-ranked tool. Furthermore, some tools, despite being less frequently mentioned in review articles such as msatcommander (Faircloth, 2007), have received considerable citation counts. Conversely, the emergence of previously unmentioned tools with considerable citation indices, such as BatchPrimer3 (You et al., 2008) and GMATa (Wang and Wang, 2016), underscores the dynamic nature of the field.
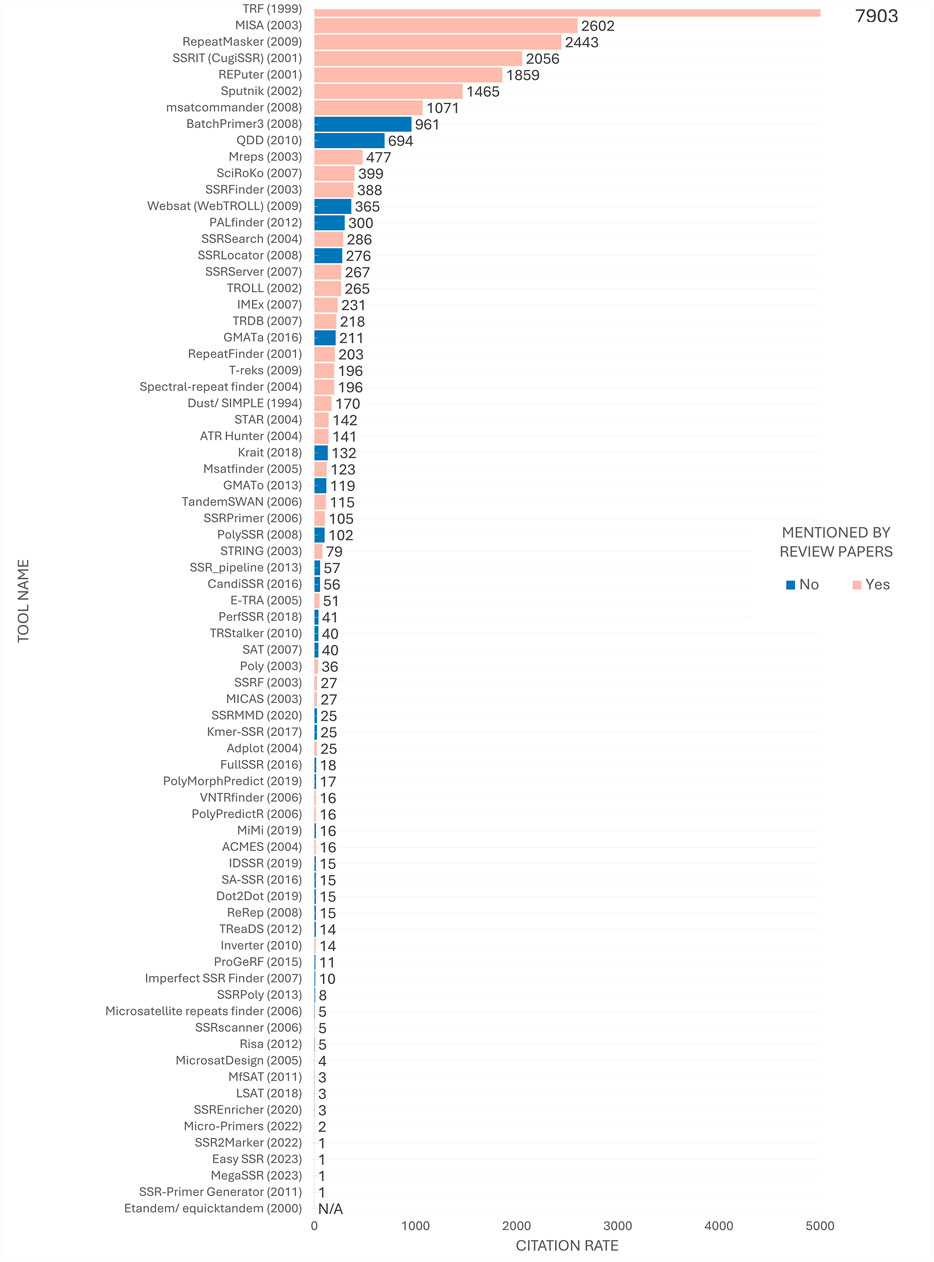
Figure 8. Citation ranking of SSR tools. Number of citations retrieved from Google Scholar in early 2024 by tool’s papers. The year of release is indicated in parenthesis next to the tool’s name for temporal comparison purposes. Tools mentioned in the review articles under study are highlighted in pink, while tools studied solely in the present study are highlighted in blue. The citation rate for the Etandem/equicktandem tools was considered N/A (Not Available) as their citations were combined with other tools citing EMBOSS, making it currently inviable to estimate the number of citations specifically for these tools.
Figure 8 also reveals that the top 20 most cited tools have remained in use for a minimum of a decade, indicating a concentration of citations in long-established tools over time. Conversely, despite their versatile features, more contemporary tools released in the last 5 years, such as EasySSR (Alves et al., 2023), MegaSSR (Mokhtar et al., 2023), Micro-primers (Alves et al., 2022), and SSR2Marker (Yue and Liu, 2022), appear not to have yet received substantial attention from the scientific community.
Although the tools on the top concentrate an impressive number of citations (Figure 8), this does not necessarily indicate that they are superior to others in the middle to bottom part of the citation ranking. If this were the case, there would be no incentive to develop new tools to address the limitations of existing ones (Sharma et al., 2007). Users often have specific expectations for tools that align with their research goals. While a suitable tool with the necessary features may exist, users may be unaware of it and therefore not use or cite it. Instead researchers may encounter difficulties in adapting their project to utilize a popular tool (Alves et al., 2023). Thus, the subsequent sections aim to disseminate knowledge regarding the tools, irrespective of the citation rate.
3.2 Comparison of the available toolsIn the previous subsection, the availability status of every tool was identified, providing a clear understanding of which ones are operational. To help users concentrate on viable options, this section compares the 42 functional programs featured in the main paper, as summarized in Table 1. However, although they were not included in the main text discussion, the 32 non-functional programs (listed in Table 2) were also evaluated and their data is available in Supplementary Table S1, acknowledging the possibility that some may become operational again in the future. The complete gathered data for all 74 tools is also provided in Supplementary Table S1, which includes not only the analyzed information but also filters to facilitate deeper analysis, along with more specific data for each tool reviewed, such as the parameters utilized, input and output formats, features, and availability of each tool. It is advisable that users download the Supplementary Table S1 and take it as a resource to consult while selecting the tool to use in their research.
To facilitate comparison, the tools were summarized based on their focus of analysis–Repetitive Elements (RE), Tandem Repeats (TR), and Short Tandem Repeats (STR). These categories were further divided by tool type (Basic or Pipeline Tool) and by their ability to identify only perfect SSRs (p-SSR) or both perfect and imperfect SSRs (i-SSR). The main data was presented in tables to enhance user access to the comparison of specific features, accompanied by a brief analysis of select attributes, including advantages, disadvantages, and the applicability of each tool to SSR research. The tools were analyzed and discussed in alphabetical order, without bias toward citations. However, if readers wish to consider citation frequency as a criterion, they can refer to Figures 6, 8 to identify the most popular tools in the literature. Additionally, advanced users with specific research questions or familiarity with SSR tools can focus primarily on the tables in the text and Supplementary Table S1 to compare relevant aspects. Users may also filter for suitable tools, in the tables and Supplementary Table S1, then compare and read the descriptions of those selected tools, rather than reviewing all descriptions, as many tools share similar functionalities.
3.2.1 Tools for detecting repetitive elements and tandem repeatsThe analysis identified nine tools with a generalist focus, comprising three tools for detecting RE and six tools for TR (Table 3). As illustrated in Figure 2, short tandem repeats (STRs) are a type of tandem repeat, which belongs to the broader category of repetitive elements. These tools were included because, although STR are not their sole focus, they represent a significant subgroup within the broader spectrum of repetitive elements and tandem repeats, thus are present in their outputs (Sharma et al., 2007). Many studies and reviews have applied these tools for STR analysis, given that they usually include parameters that can be personalized for identifying MS (Gao et al., 2003; Leclercq et al., 2007). Additionally, it is essential to highlight that their citation rates observed in Table 1 and Figure 8 may not exclusively reflect citations in SSR-related projects, as these tools can also detect other types of repeats.
留言 (0)