As a rain-fed crop, rice is particularly susceptible to various abiotic stresses, with drought stress being one of the most significant hindrances to its growth (Aslam et al., 2022; Mumtaz et al., 2020; Zhang et al., 2018). With climate change, the frequency and intensity of droughts are on the rise, exerting adverse effects on rice production (Giri et al., 2021; Korres et al., 2017; Pareek et al., 2020).
Nitrogen (N) is a vital nutrient crucial for plant growth and development. Paddy fields provide a growing environment for rice. The soil-water system in paddy fields can lead to N loss through processes such as ammonia volatilization, denitrification, and leaching, resulting in low N fertilizer use efficiency (Cao et al., 2016; Pang and Peng, 2010). When exploring the strategies to improve N use efficiency from the paddy field perspective, it is also essential to conduct relevant research on rice itself (Fan et al., 2008; Fan et al., 2011). The concept of nitrogen use efficiency (NUE) reflects the efficiency in converting input into output, with NUE for rice defined as the ratio of the shoot weight to unit N in shoots (Raghuram and Sharma, 2019). Drought stress significantly increases the N concentration in rice stems and leaves, leading to reduced N accumulation due to decreased dry matter accumulation (Niu et al., 2016; Zhu et al., 2017). Numerous studies have investigated the effects of drought stress on N metabolism, including its absorption, assimilation, and remobilization. Rice acquires N from the soil, with the inorganic N in the soil serving as the primary source. The available form of soil inorganic N dynamically changes with variations in soil water contents (Plett et al., 2020). NH4+ predominates in flooded soil, whereas NO3− prevails in dried soil (Malyan et al., 2021). An experiment utilizing polyethylene glycol (PEG) to induce drought stress in hydroponics demonstrated that NO3−-treated rice exhibited lower N absorption compared to NH4+-treated rice (Cao et al., 2018). Various studies have examined the activities of crucial enzymes involved in N metabolism, including nitrate reductase (NR), nitrite reductase (NiR), glutamine synthetase (GS), glutamate synthase (GOGAT), and glutamate dehydrogenase (GDH) (Cao et al., 2018; Zhong et al., 2018; Sánchez-Rodríguez et al., 2011; Xu and Zhou, 2006). However, the findings have been inconsistent. NR and NiR activities were increased in rice roots but decreased in rice leaves under PEG-induced drought stress (Cao et al., 2018), while an increase in NR activity in rice leaves was observed in a pot experiment under drought (Zhong et al., 2018). Drought stress inhibited GS and GOGAT activities and enhanced GDH activity in tomatoes, with the exception of one stress-tolerant cultivar (Sánchez-Rodríguez et al., 2011). The inhibitory effects of drought stress on NR, GS, and GDH activities gradually intensified with the severity and duration of the stress (Xu and Zhou, 2006). In addition, GS and GOGAT are also crucial in the recycling of ammonium released during photorespiration, an energy dissipation side reaction of photosynthesis (Kendall et al., 1986; Somerville and Ogren, 1980; Zeng et al., 2017). Photosynthesis in plants plays a principal role in converting solar energy into biomass. Drought typically leads to a reduction in photosynthesis in C3 plants followed by reduced biomass accumulation. Photorespiration is beneficial in maintaining photosynthesis in C3 plants under drought by reducing photoinhibition and supplying ribulose-1,5-bisphosphate (RUBP) (Flexas and Medrano, 2002; Wingler et al., 2000). However, the enhanced photorespiration in rice under drought may lead to a higher net loss of carbon and N in the forms of CO2 and NH3 released primarily through the glycine decarboxylation in the mitochondria, one important step of photorespiration (Kaachra et al., 2018). Meanwhile, the photorespiratory pathway can fix carbon in the forms of amino acids, thus increasing the rate of photosynthetic CO2 uptake (Busch et al., 2018). Amino acids, important nitrogenous compounds, that accumulate in large quantities under drought, can help plants defend against drought by contributing to osmotic regulation (Ashraf and Foolad, 2007; Li et al., 2010). There is a complex interaction between carbon metabolism and N metabolism. Therefore, more investigations are necessary to elucidate NUE and the underlying mechanisms under drought stress in rice.
Crop traits are determined by the intricate interplay between the genotype (internal factor) and the environment (external factor). Drought stress can influence the expression of certain genes associated with N metabolism (N-responsive genes) and the overexpression of specific genes can regulate crop growth under drought stress. In a previous study, drought stress upregulated the expression of two ammonium transporters (AMT1;2 and AMT1;3), while most nitrate transporters (NARs and NRTs) were downregulated (Cao et al., 2018). In flooded soil, the main inorganic N transporters in rice roots were ammonium transporters (OsAMT1 and OsAMT2 families) and nitrate transporters (OsNPF2.4, OsNRT1.1A, and OsNRT2.3), while, in upland soil, nitrate transporters (OsNRT1.1B and OsNRT1.5A) predominated (Wang et al., 2020). Furthermore, chloroplastic GS2 (OsGS2) genes, along with one cytosolic GS1 (OsGS1;1) gene, were implicated in regulating drought tolerance in a drought-tolerant cultivar (Singh and Ghosh, 2013). The overexpression of a cytosolic GS1 (GS1;2) gene in rice exacerbated its drought sensitivity compared to the wild type (Cai et al., 2009). Research has indicated that drought and salt tolerance (DST), a zinc-finger transcription factor, can modulate the NR 1.2 (OsNR1.2) gene, thus participating in nitrate assimilation under drought stress (Han et al., 2022). The co-overexpression of OsNRT2.3a and one nitrate transporter partner protein 2 (OsNAR2.1) gene has been shown to enhance agronomic NUE (Chen et al., 2020). However, there has been limited focus on genes contributing to NUE. Some scholars have recognized this gap and identified NUE-related genes (Kumari et al., 2021; Sharma et al., 2023). In these studies, NUE-related genes were identified as those that were simultaneously N-responsive and yield-related, while NUE was defined as yield per unit of N (i.e., NUEgrain, not NUE). Additionally, there may be shortcomings in the method used to identify NUE-related genes, as these studies primarily relied on the analysis of public data rather than direct NUE observations. It is crucial to define NUE-related genes as those directly involved in regulating NUE on the basis of real observations. Therefore, there is a need to comprehensively explore NUE-related genes at the whole-genome level based on actual NUE observations. Furthermore, research examining NUE-related genes under drought stress is notably lacking.
Transcriptomics represents the most promising avenue for unraveling the molecular intricacies of NUE. It allows for pinpointing differentially expressed genes (DEGs) under specific conditions, elucidating the physiological and phenotypic variations in crops on a genome-wide scale (Ahmad, 2022; Love et al., 2014). Several researchers have substantiated various functions, such as plant hormone signal transduction and carbon and N metabolism, implicated in the drought response at the molecular level (Ereful et al., 2020; Kaur et al., 2023; Park and Jeong, 2023; Zhang et al., 2017). These findings have furnished candidate genes for the development of drought-tolerant rice. Some candidate genes, like osmotic stress/ABA–activated protein kinase 3 (OsSAPK3), OsNAR2.1, and NAM/ATAF/CUC (NAC) domain transcription factor5 (OsNAC5), have been confirmed to enhance drought tolerance in rice through over-expression experiments (Chen et al., 2019; Jeong et al., 2013; Lou et al., 2023; Lv et al., 2023). However, these investigations have predominantly focused on DEGs and their molecular functions under drought stress and have not explored the correlation between these DEGs and external traits (phenotypic and physiological traits) under drought stress. A classical method for identifying genes that regulate external traits is weighted gene co-expression network analysis (WGCNA) (Langfelder and Horvath, 2008). Based on systems biology, this approach can categorize highly coordinated gene sets, known as modules. By examining the relationship between gene networks within these modules and external traits, WGCNA helps pinpoint hub modules and hub genes that regulate these traits. Several studies have utilized WGCNA to identify hub genes or molecular mechanisms governing various external traits, such as biomass (Xu et al., 2023), ear leaf N concentration (Gong et al., 2020a), and organic acid content (Wang et al., 2022a), among others, in response to growth disparities (Gong et al., 2020a) or environmental fluctuations (Wang et al., 2022b; Xu et al., 2023). The research of a previous study treated NUEgrain as an external trait and identified two network modules highly correlated with NUEgrain (Shanks et al., 2022). However, research on the highly correlated modules of NUE and NUE-related genes under drought stress is still lacking. In this study, we first applied WGCNA to identify NUE-related genes using data from a pot experiment. Subsequently, we identified DEGs associated with NUE under drought stress from the pool of NUE-related genes. This enabled us to uncover the hub genes among NUE-related DEGs that regulate NUE under drought stress.
The aim of this study is to enhance our understanding of the physiological changes and molecular mechanisms in rice NUE under drought stress. To achieve this, we conducted a pot experiment involving three different treatments: normal irrigation, mild drought stress, and severe drought stress. Throughout the experiment, we closely monitored the growth of the rice plants and analyzed the transcriptome of their leaves. Through the integration of rice transcriptome and physiological data, we identified two sets of candidate genes, referred to as NUE-related DEGs, which are likely to play pivotal roles in rice NUE under drought stress. Furthermore, we conducted functional analyses of these two sets of NUE-related DEGs and identified transcription factors, transporters, and protein kinases among them. Overall, this study is expected to shed light on the potential regulatory mechanisms involved in NUE adaptation to water-limited environments and provide a valuable gene list for developing drought-resistant crops with high NUE.
2 Materials and methods2.1 Plant materials, growth conditions, and stress treatmentsIn this study, we utilized the indica rice variety “Zuan Liang You Chao Zhan”. Thirty days after sowing, on 31 May 2021, the seedlings were transplanted into experimental pots at the Irrigation and Drainage Experimental Site of the State Key Laboratory of Water Resources Engineering and Management, Wuhan University (114°37′E, 30°54′N). The harvest took place on 12 October 2021. The experimental pots were filled with 6.4 kg of air-dried soil. Based on the USDA soil texture classification, the soil used in this study was identified as silt loam with 70.75% silt, 14.09% sand, and 15.15% clay. The total N content of the soil was 0.67 g kg−1.
We implemented three treatments: normal irrigation (WF), mild drought (WM), and severe drought (WS). In the WF treatment, a 5–50 mm water layer was maintained throughout the entire growth period. The WM and WS treatments had a 5–50 mm water layer until the tillering stage, after which the soil water potentials were maintained as the designed soil water potentials (−15 ± 5 kPa and −30 ± 5 kPa for WM and WS treatments, respectively). We monitored soil water contents to control the soil water potentials and the corresponding soil water contents at the designated soil water potentials were obtained by a soil water retention curve (Supplementary Figure S1A). To prevent the influence of rainfall, the rain shelter was closed on rainy days during the experiment. Then the designed soil water potentials were maintained through artificial water replenishment. Significant differences in soil moisture were observed across all four growth stages (Supplementary Figure S1B). Throughout the experiment, all treatments (WF, WM, and WS treatments) received the same adequate amount of nitrogen fertilizer. Additionally, each treatment included three pots, designated as WF-0, WM-0, and WS-0 treatments, without fertilizer during the experiment. The pots in the WF-0, WM-0, and WS-0 treatments were subjected to the same water management as their corresponding treated pots (WF, WM, and WS treatments).
2.2 Soil propertiesSoil samples from the pots in the WF, WM, and WS treatments were collected at the four main growth stages, with three repetitions per treatment. To ensure the comparability of soil samples across treatments, each soil sample was taken from the exact center of the pot after the pot was destructed. Each soil sample was divided into two portions: one for measuring soil moisture using the drying method, and the other for determining soil inorganic N concentrations utilizing an ultraviolet and visible light spectrophotometer (UV2700, Shimadzu, Japan). The soil inorganic N concentrations include soil NO3−-N and NH4+-N concentrations.
2.3 Rice physiological and morphological traitsFollowing the soil sample collection process described above, the aboveground parts of rice plants grown under WF, WM, and WS treatments were sampled with three biological replicates per treatment. The aboveground rice samples in each treatment were taken from the same three pots as the three soil samples. The aboveground rice was further divided into leaf, stem, and panicle components. The fresh weight (FW) of each tissue was recorded immediately after it was isolated from the aboveground rice. Subsequently, each plant tissue was dried at 105 °C for 30 min to deactivate enzymes and then at 80 °C until a constant weight was achieved, from which the dry weight (DW) was determined. The dried samples were then powdered, and the N concentration in each tissue was determined using the Kjeldahl method (Nelson and Sommers, 1973). Tissue N accumulation was calculated by multiplying the tissue DW by the tissue N concentration. The total aboveground N accumulation was obtained by summing up the N accumulation results for each aboveground tissue. The aboveground N concentration was determined as the N accumulation per unit of DW of the aboveground rice. The NUE can be calculated using Equation 1, as described in a previous study (Somaweera et al., 2016):
where NUE (g·g−1) is the nitrogen use efficiency, DW (g) is the aboveground dry weight, and N (g) is the aboveground N accumulation.
During the harvest period, aboveground rice in the WF, WM, WS, WF-0, WM-0, and WS-0 treatments was collected and divided into leaf, stem, and panicle components. The rice yield was determined based on the actual weight of the harvested grain in the pot. The aboveground DW, N accumulation, and NUE were determined using the same methods as described earlier.
2.4 Transcriptome analysis methodLeaf samples were collected concurrently with soil samples, with three biological replicates per treatment. Leaves were promptly excised from the plants, flash-frozen in liquid nitrogen, and transported to the Majorbio laboratory (Shanghai, China) for cryopreservation at −80°C. Transcriptome-wide analysis was conducted using RNA sequencing (RNA-seq). Total RNA was extracted, purified, and fragmented, followed by the construction of cDNA libraries. Subsequently, high-throughput sequencing was performed, and the resulting clean reads were aligned to the rice genome. Normalization of the data was carried out as transcripts per kilobase of exon model per million mapped reads (TPM) using RNA-Seq by Expectation Maximization (RSEM) (version 1.3.3) (Li and Dewey, 2011). The analyses were conducted on the online Majorbio Cloud Platform (www.majorbio.com). To identify DEGs, we employed DESeq2 (Version 1.24.0) with replicates, setting a false discovery rate (FDR) of <0.05, a fold change (FC) value of ≥2, and an adjusted p-value (p-adjust) of <0.05 as thresholds. Raw sequence data were submitted to the National Center for Biotechnology Information (NCBI) under the BioProject Submission ID PRJNA1108788 and used for bioinformatic analyses.
2.5 Gene co-expression network analysis and NUE-related geneWGCNA (Version 1.63) was employed for gene co-expression network analysis, and conducted separately for the vegetative and reproductive stages. First, genes with TPM values <1 and coefficients of variation <0.1 were filtered out. Subsequently, the soft-thresholding power (β) was determined based on the principle of scale-free topology. Module identification was then performed by setting the β value, the minimum number of genes per module (30), and the minimum eigengene-based module membership (0.30). Additionally, modules with a cluster distance below 0.25 were merged. Genes exhibiting similar expression patterns were grouped into the same module, while genes with dissimilar expression patterns were classified into the grey module. To conduct the analysis, we selected aboveground dry weight (ADW), aboveground nitrogen concentration (AN), aboveground nitrogen accumulation (ANA), and NUE in rice as the traits of interest. Pearson correlation was utilized to identify the hub modules. The genes belonging to these hub modules were aggregated to form the NUE-related gene set for subsequent analysis. Gene interactions were visualized using Cytoscape (version 3.6.0). The gene interactions were derived from the corresponding protein-protein interactions (PPIs) available in the STRING database version 11 (https://cn.string-db.org).
2.6 Functional enrichment analysisGene Ontology (GO) enrichment analysis and Kyoto Encyclopedia of Genes and Genomes (KEGG) enrichment analysis were conducted using Goatools (https://github.com/tanghaibao/GOatools) (Klopfenstein et al., 2018) and KOBAS (http://kobas.cbi.pku.edu.cn/home.do) (Xie et al., 2011), respectively. A GO term or KEGG pathway was considered enriched when the p-value was <0.05 and statistically significant when the Bonferroni-corrected p-value (p-adjust) was lower than 0.05.
2.7 Data mining for NUE-related DEGsWe focused on transcription factors (TFs), transporters, and protein kinases (PKs), which are known to play key roles in abiotic stress signaling and responses in plants (Gong et al., 2020b; Zhu, 2016). TFs were classified using the PlantTFDB database (http://planttfdb.gao-lab.org) (Jin et al., 2017), transporters were identified based on the Rice Transporters Database (https://ricephylogenomics.ucdavis.edu/transporter/), and PKs were recognized using the iTak database (http://itak.feilab.net/cgi-bin/itak/index.cgi) (Zheng et al., 2016).
2.8 Verification of RNA-seqTo validate the transcriptome sequencing results, real-time quantitative reverse transcription polymerase chain reaction (qRT-PCR) was conducted on five randomly selected DEGs. The primer sequences for these genes are provided in Supplementary Table S2. Each sample underwent three biological replications, and eEF1-α was used as the reference gene. The relative expression of DEGs was calculated using the 2−ΔΔCT method (Livak and Schmittgen, 2001).
2.9 Statistical analysisStatistical analyses were performed using SPSS statistical software (version 11.5, SPSS Inc., Chicago, IL, USA, 2003). Repeated measures analysis of variance (ANOVA) was employed to test for differences among treatments at a significance level of 0.05. Least significant difference (LSD) tests were used to compare the means of the soil inorganic N and rice traits among the WF, WM, and WS treatments in the four main growth stages. Duncan’s multiple-comparison tests were performed to determine the differences in rice traits among all treatments during the harvest period. The results of soil properties and rice traits were visualized using Origin 2021b.
3 Results3.1 Soil inorganic NFluctuations in soil moisture can have a notable impact on soil inorganic N concentrations. In the tillering stage, soil NO3−-N concentrations in the WM and WS treatments were significantly elevated compared to the WF treatment, exhibiting increases of 525.94- and 477.07-folds, respectively (Figure 1A). Furthermore, because fertilizer was applied additionally during the early heading stage, NO3−-N concentrations in the heading stage surpassed those observed in the jointing stage in all treatments. NH4+-N concentrations in all three treatments were notably higher at the tillering stage compared to other stages (Figure 1B). Notably, significant disparities in soil NH4+-N concentrations among the three treatments only emerged in the jointing stage.
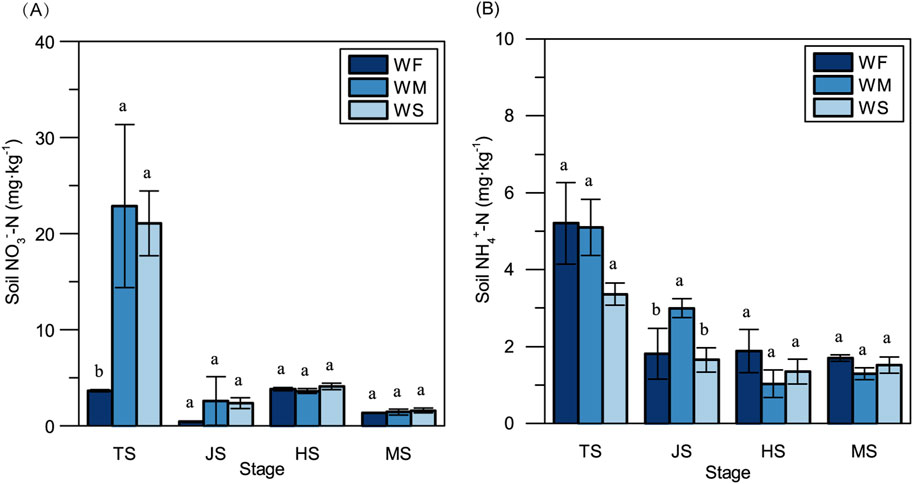
Figure 1. The soil NO3−-N concentration (A) and NH4+-N concentration (B) across three treatments at the four main growth stages. WF, WM, and WS denote normal irrigation, mild drought stress, and severe drought stress, respectively, while TS, JS, HS, and MS represent the tillering, jointing, heading, and maturing stages. The data and error bars in the figure represent the average value and standard deviation of three repetitions, respectively. Different lowercase letters for the same growth stage denote significant differences at 0.05 level by LSD test.
3.2 Rice physiological and morphological traitsAs shown in Figure 2A, rice plants subjected to WM and WS treatments were smaller and more compact in both the vegetative and reproductive stages compared to those in the WF treatment. Plants in the WF treatment consistently displayed significantly higher aboveground FWs compared to those in the WM and WS treatments across all four growth stages (Figure 2B). Notably, aboveground FWs in all three treatments experienced rapid increases during the vegetative stage, particularly in the WF treatment. Subsequently, in the heading stage, the aboveground FWs in all three treatments slightly increased, with no significant changes observed in the maturing stage. The trends in aboveground DWs among the WF, WM, and WS treatments across all four growth stages mirrored those in aboveground FWs (Figure 2C). Across all growth stages, the WF treatment consistently displayed significantly lower aboveground N concentrations and higher aboveground N accumulations compared to the WM and WS treatment (Figures 2D, E). Furthermore, rice in the WF treatment consistently exhibited higher NUE compared to rice in the WM and WS treatments at all growth stages, with differences ranging from 2.23% to 46.36% (Figure 2F). These results showed drought stress led to a significant reduction in NUE across growth stages, compared to the normal treatment.
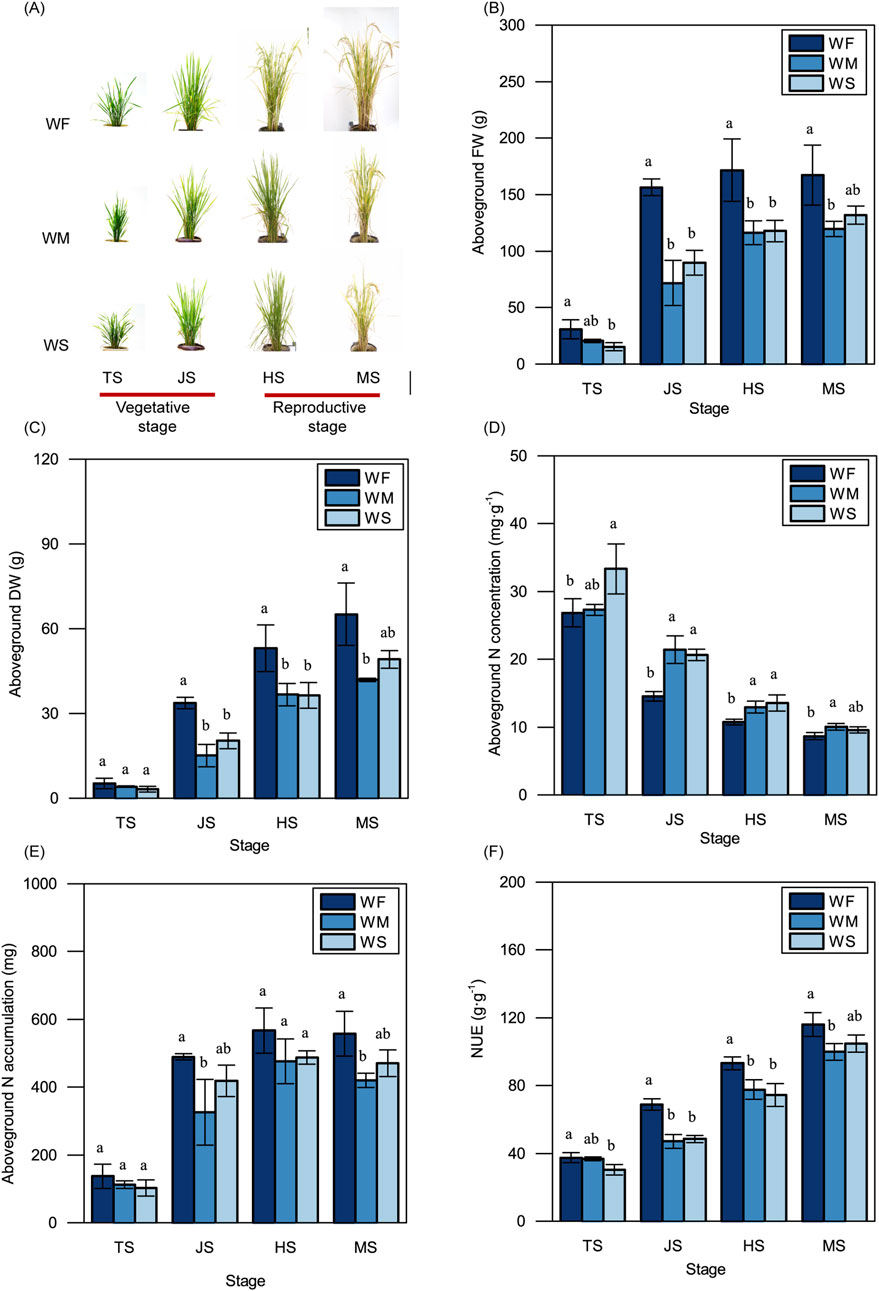
Figure 2. Rice plant growth. (A) Rice phenotype. Bar = 20 cm. (B–F) The variations in the aboveground fresh weight (FW) (B), dry weight (DW) (C), nitrogen concentration (N concentration) (D), nitrogen accumulation (N accumulation) (E), and nitrogen use efficiency (NUE) (F). WF, WM, and WS denote normal irrigation, mild drought stress, and severe drought stress, respectively, while TS, JS, HS, and MS represent the tillering, jointing, heading, and maturing stages. The data and error bars in the figure represent the average value and standard deviation of three repetitions, respectively. Different lowercase letters for the same growth stage denote significant differences at the 0.05 level according to the LSD test.
The pots without fertilizer (i.e., WF-0, WM-0, and WS-0) exhibited significantly lower grain yields, panicle numbers, and aboveground DWs compared to fertilized pots (i.e., WF, WM, and WS) within each treatment (Table 1). Despite higher aboveground N accumulation in the fertilized treatments compared to the treatments without fertilizer, the NUE in the fertilized treatments decreased with a significant difference. Among the fertilized treatments, the highest grain yield was observed in the WF treatment, reaching 28.54 g·pot−1. Specifically, the aboveground DW in the WF treatment was significantly higher than those in the WM and WS treatments. However, the aboveground N accumulation and NUE did not significantly differ among the WF, WM, and WS treatments.
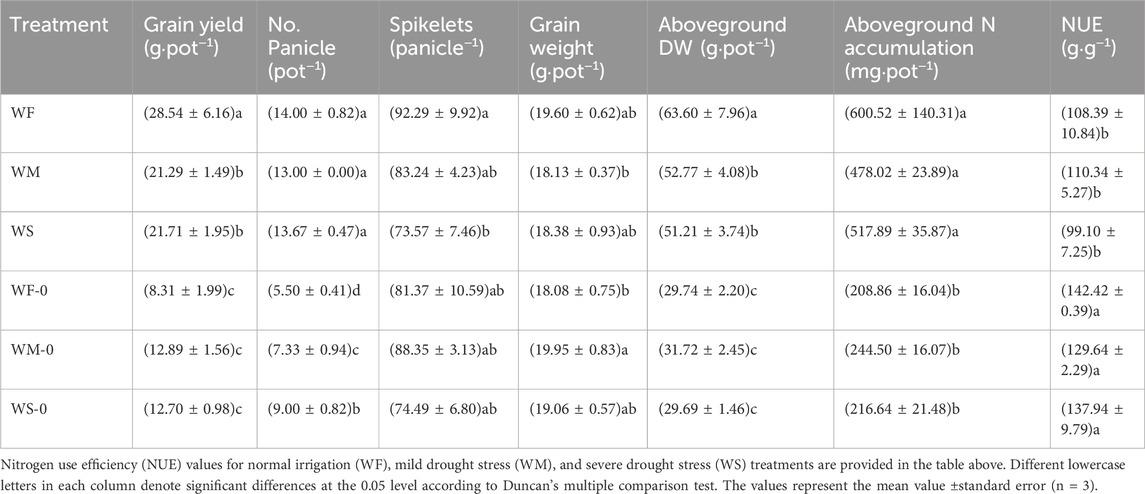
Table 1. The effects of different treatments on the grain yield and NUE.
3.3 Transcriptome results and validationTo delve into the molecular intricacies of NUE regulation during drought stress in rice, we employed RNA-seq to track gene expression profiles. Transcriptome sequencing was conducted on rice leaves in the WF, WM, and WS treatments at the tillering (1), jointing (2), heading (3), and maturing (4) stages (Supplementary Table S2). The lowest values of Q20, Q30, and the total mapping ratio were 97.66%, 93.39%, and 93.03%, respectively. Thus, all 36 leaf samples were suitable for subsequent analysis.
To validate the reliability of the RNA-seq data, we measured multiple genes using qRT-PCR. The Pearson correlation coefficient demonstrated a significant correlation between the log2FC values obtained from the RNA-seq and qRT-PCR results (Supplementary Figure S2). This result confirmed the reliability of RNA-seq.
3.4 DEG analysis under drought stressThe rice leaf DEGs responsive to drought stress across various growth stages are depicted in Figure 3. The highest numbers of DEGs identified when comparing WM samples with the control WF samples (WF_vs._WM) appeared in the tillering and maturing stages, with 1,437 and 2,273 DEGs, respectively (Figure 3A). Similarly, comparing WS samples with the control WF samples (WF_vs._WS) showed the highest numbers of DEGs in the tillering and jointing stages, with 3,832 and 2,273 DEGs, respectively. The numbers of DEGs in WF_vs._WS were 2.67, 117.74, and 27.73 times higher than those in WF_vs._WM at the tillering, jointing, and heading stages, respectively. The highest numbers of DEGs obtained by comparing WS samples with the control WM samples (WM_vs._WS) were observed in the jointing and maturing stages, with 5,303 and 6,894 DEGs, respectively. Among the 12 different groups, except for the 3 groups in the jointing stage, the number of downregulated DEGs was greater than that of the upregulated DEGs.
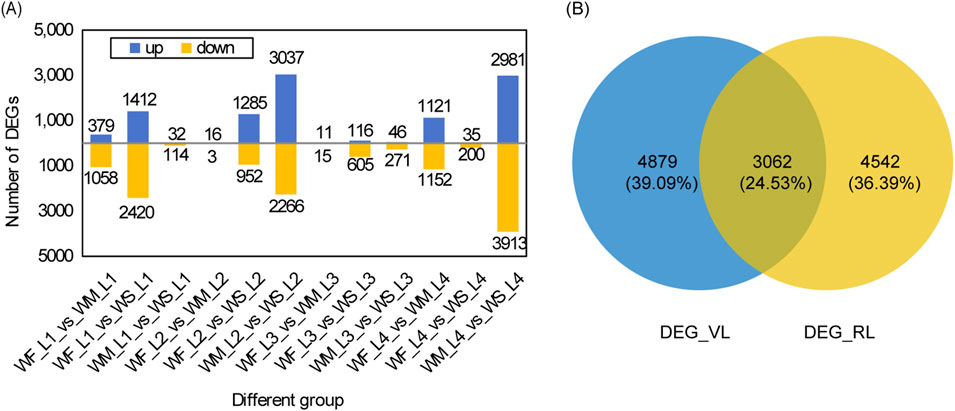
Figure 3. DEG analysis under drought stress. (A) Statistical analysis of DEGs across three treatments at four main growth stages. The three treatment were normal irrigation (WF), mild drought stress (WM), and severe drought stress (WS), and the four main growth stages were the tillering, jointing, heading, and maturing stages (represented by 1, 2, 3, and 4 respectively). The comparisons WF_vs._WM and WF_vs._WS represent differentially expressed gene (DEG) sets obtained by comparing WM and WS samples with the control WF samples, respectively. Similarly, WM_vs._WS denotes the DEG sets obtained by comparing WS samples with the control WM samples. (B) A Venn diagram of DEG_VL and DEG_RL. DEG_VL and DEG_RL denote DEGs at the vegetative and reproductive stages, respectively.
We identified a total of 19, 0, 0, and 9 common DEGs among the three different groups (WF_vs._WM, WF_vs._WS, and WM_vs._WS) at the tillering, jointing, heading, and maturing stages, respectively (Supplementary Figure S3A). The DEG database for the tillering stage is denoted as DEG_L1 and was obtained by merging the DEGs from WF1_vs._WM1, WF1_vs._WS1, and WM1_vs._WS1. Similarly, the databases for the jointing, heading, and maturing stages are named DEG_L2, DEG_L3, and DEG_L4, respectively, and were created by following the same merging procedure. Only 36 DEGs, accounting for 0.29% of all DEGs, were shared among the four DEG databases (Supplementary Figure S3B). For the vegetative stage, merging DEG_L1 and DEG_L2 yielded 7,941 DEGs (DEG_VL) while for the reproductive stage, merging DEG_L3 and DEG_L4 produced 7,604 DEGs (DEG_RL) (Figure 3B). These two databases shared 3,062 DEGs, representing 24.53% of all DEGs.
3.5 Co-expression network reveals NUE-related genesUtilizing WGCNA, we identified NUE-related gene sets in the vegetative and reproductive stages. After gene filtering, 16,300 genes in the vegetative stage and 15,655 genes in the reproductive stages were retained for analysis. The β value was determined to be 9 for both stages. Gene dendrograms were constructed based on gene expression patterns (Supplementary Figure S4A; Supplementary Figure S4B). According to these dendrograms, the filtered genes in the vegetative and reproductive stages were organized into 12 and 11 modules, respectively (Figure 4).
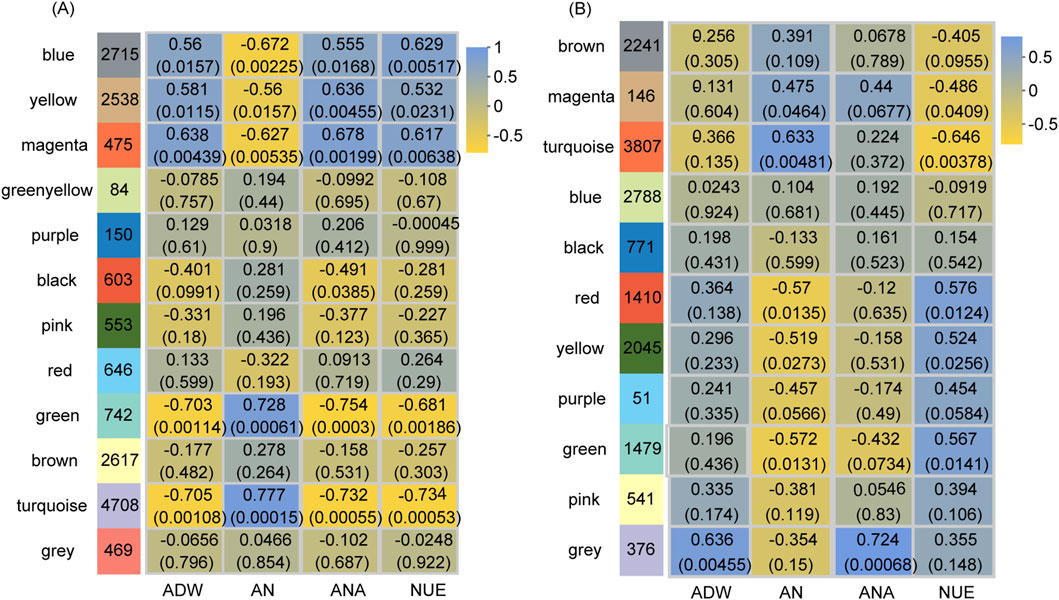
Figure 4. Module-trait relationships at the vegetative stage (A) and reproductive stage (B). The y-axis represents the module names, while the x-axis denotes traits. ADW, AN, ANA, and NUE correspond to aboveground dry weight, aboveground nitrogen concentration, aboveground nitrogen accumulation, and nitrogen use efficiency, respectively. The numbers in the left column indicate the number of genes in each module, while each set of data on the right presents the correlation coefficient and significance p-value (in parentheses) of the module with the respective trait. The color legend illustrates the correlation level.
At the vegetative stage, the gene expression in five modules represented significant correlations (p-value <0.05) with NUE by the Pearson correlation analysis (Figure 4A). The expression of genes within the blue, yellow, and magenta modules had notable positive correlations with NUE, whereas that in the green and turquoise modules demonstrated significant negative correlations. The expression of genes within these five modules was also significantly correlated with ADW, AN, and ANA. Notably, the regulatory patterns observed in ADW and ANA mirrored those found in NUE, whereas the regulatory pattern in AN was opposite to that observed in NUE. Consequently, the genes in these five modules for the vegetative stage were combined and designated as NUE_VL, comprising 11,178 genes (Supplementary Table S3).
At the reproductive stage, the gene expression in the five modules had significant correlations (p-value <0.05) with NUE by the Pearson correlation analysis (Figure 4B). The expression of genes within the red, yellow, and green modules showed significant positive correlations with NUE, while that in the magenta and turquoise modules displayed significant negative correlations. Additionally, the expression of genes within these five modules was significantly correlated with AN, exhibiting the opposite regulation pattern. Therefore, the genes in these five modules for the reproductive stage were merged and named NUE_RL, consisting of 8,887 genes (Supplementary Table S3).
3.6 Functional analysis of NUE-related DEGsTo identify the DEGs among NUE-related genes under drought, Venn diagrams were generated for the vegetative stage (Figure 5A) and reproductive stage (Figure 5B). DEG_VL and NUE_VL shared 4,424 genes, forming a set denoted by DEG_NUE_VL. Similarly, DEG_RL and NUE_RL shared 2,452 genes, collectively designated as DEG_NUE_RL. In DEG_NUE_VL and DEG_NUE_RL, five genes were already known as the genes involved in N metabolism (Cai et al., 2010; Chen et al., 2016; Lin et al., 2000; Suenaga et al., 2003; Yamaya and Kusano, 2014). The five genes were the nitrate transporter (OsNRT1), the MEP/AMT2-type ammonium transporter (OsAMT2.1), the OsGS2, the ferredoxin-dependent GOGAT 1 (Fd-GOGAT1), and the NADH-GOGAT 2 (OsNADH-GOGAT2). These genes were found to be NUE-related DEGs in both stages. The expressions of OsNRT1, OsGS2, Fd-GOGAT1, and OsNADH-GOGAT2 displayed significant negative and positive correlations with NUE in the vegetative and reproductive stages, respectively (Figures 5E, F). The correlation between the expressions of OsAMT2.1 and NUE exhibited the opposite trend. These genes involved in N metabolism are likely to be crucial in rice NUE under drought.
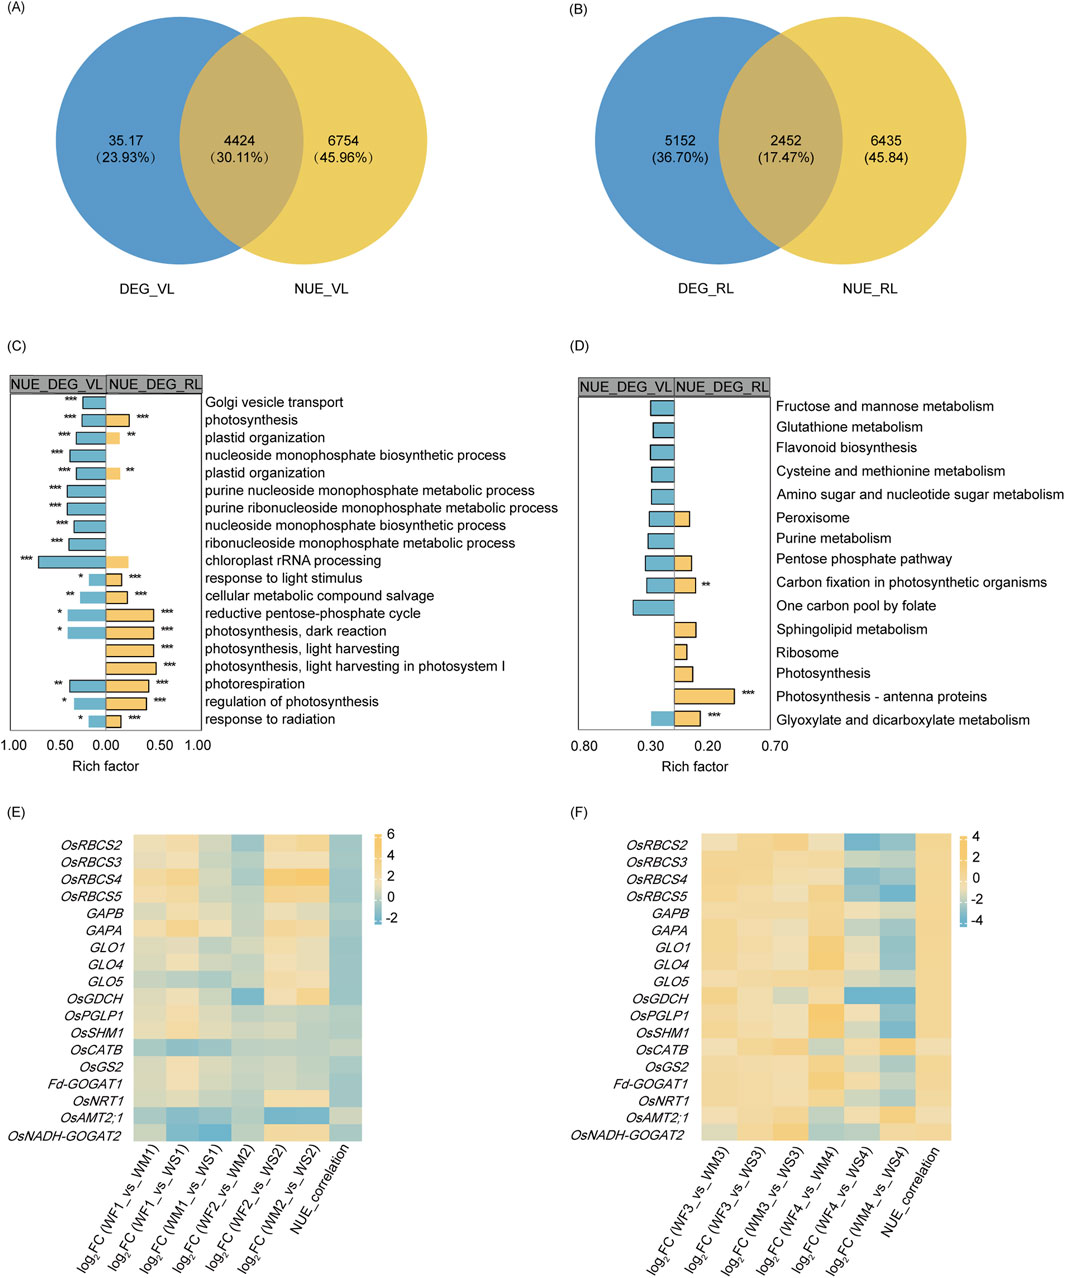
Figure 5. NUE-related DEG analysis. (A, B) A Venn diagram illustrating the overlap between drought-responsive DEGs and NUE-related genes in the vegetative stage (A) and reproductive stage (B). DEG_VR and DEG_RR represent the differentially expressed genes (DEGs) in the vegetative and reproductive stages, respectively, while TN_VR and TN_RR denote the genes that show significant correlations with nitrogen use efficiency (NUE-related) in the vegetative and reproductive stages. (C, D) A display of the top 10 enriched (p-value <0.05) GO terms (C) and KEGG pathways (D) of two NUE-related DEG sets. DEG_TN_VR and DEG_TN_RR refer to the NUE-related DEGs in the vegetative and reproductive stages, respectively. Significance levels are indicated by * (p-adjust <0.05), ** (p-adjust <0.01), and *** (p-adjust <0.001). (E, F) A representation of the log2 fold change (log2FC) and nitrogen use efficiency (NUE) correlation coefficient of selected genes involved in glyoxylate and dicarboxylate metabolism, carbon fixation in photosynthetic organisms, and nitrogen metabolism across the three different groups IN the vegetative stage (E) and reproductive stage (F).
GO enrichment analysis revealed that DEG_NUE_VL and DEG_NUE_RL shared 32 significantly enriched GO terms (p-adjust <0.05), including processes such as photosynthesis, oxidation-reduction process, biosynthetic process, and others (Supplementary Table S4; Figure 5C). KEGG enrichment analysis found that four enriched KEGG pathways were shared by both DEG_NUE_VL and DEG_NUE_RL (Supplementary Table S4; Figure 5D). Carbon fixation in photosynthetic organisms and glyoxylate and dicarboxylate metabolism were enriched in both gene lists and showed significant enrichment in DEG_NUE_RL.
The Calvin–Benson cycle and photorespiration are key mechanisms of carbon fixation in photosynthetic organisms and glyoxylate and dicarboxylate metabolism, respectively. In the vegetative stage, the expression of most genes involved in these processes was enhanced in the WM and WS treatments (Figure 5E). Genes with this enhanced expression included four ribulose 1,5-bisphosphate carboxylase–oxygenase (Rubisco) small subunit (OsRBCS2-5) genes, two glyceraldehyde-3-phosphate dehydrogenase (GAPA and GAPB) genes, the photorespiratory 2-phosphoglycolate phosphatase (OsPGLP1) gene, three glycolate oxidase (GLO1, GLO4, and GLO5) genes, the glycine decarboxylase complex H-protein (OsGDCH) gene, the serine hydroxymethyltransferase 1 (OsSHM1) gene, OsGS2, and Fd-GOGAT1. However, the expression of these genes was inhibited in the reproductive stage (Figure 5F). As NUE-related genes, their expression was negatively correlated with NUE in the vegetative stage, but positively correlated in the reproductive stage. However, the expression of the catalase isozyme B (OsCATB) gene in the WM and WS treatments was inhibited in the vegetative stage but enhanced in the reproductive stage. Interestingly, the correlations between the expression of OsCATB and NUE were opposite to those observed with the above genes in both stages. The two pathways, carbon fixation in photosynthetic organisms and glyoxylate and dicarboxylate metabolism may play important roles in rice NUE under drought.
Based on a Venn analysis, the gene counts revealed that 43 genes of DEG_NUE_VL and 30 genes of DEG_NUE_RL were identified as NUEgrain-related genes in previous studies (Kumari et al., 2021; Sharma et al., 2023) (Supplementary Table S4).
3.7 PPI network of NUE-related DEGsTo visualize the co-expression network of NUE-related DEGs, genes from DEG_NUE_VL and DEG_NUE_RL were selected for PPI network analysis. The interaction relationships were determined using combined scores obtained from the STRING database (Supplementary Table S5). Subsequently, we visualized NUE-related DEGs with the top 300 combined scores above 0.4 using Cytoscape (Figure 6). Specifically, 334 genes from DEG_NUE_VL are included in Figure 6A, while 238 genes from DEG_NUE_RL are represented in Figure 6B. To identify crucial proteins within the PPI network, we employed the Maximal Clique Centrality (MCC) algorithm available in the CytoHubba plugin of Cytoscape, a topology analysis method capable of accurately capturing essential proteins (Chin et al., 2014). Consequently, gene scores in the PPI network were calculated using the MCC algorithm, and the top 10 scoring genes were designated as hub genes (Figure 6). Notably, some genes involved in carbon fixation in photosynthetic organisms and glyoxylate and dicarboxylate metabolism emerged as hub genes. GAPA and GAPB were identified as two hub genes in the vegetative stage, while GLO4, GLO5, and OsGDCH were highlighted as three hub genes in the reproductive stage. These results indicated these several genes in the two significant enriched pathways may have major functions in rice NUE under drought.
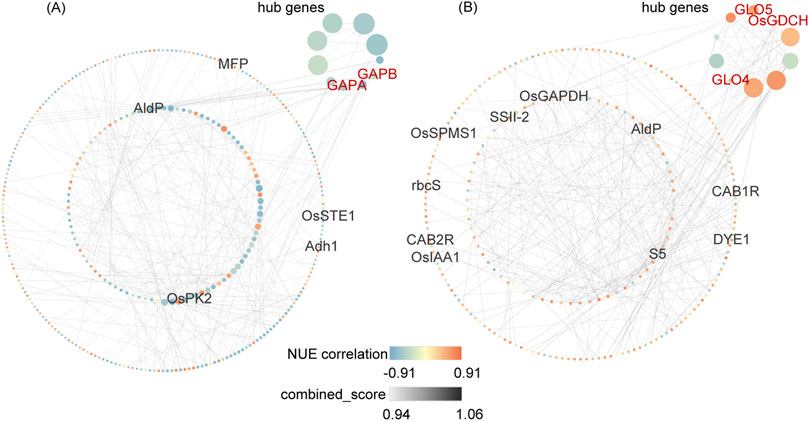
Figure 6. Top 300 interactions in protein-protein interaction (PPI) networks of DEG_NUE_VL (A) and DEG_NUE_RL (B). DEG_NUE_VL and DEG_NUE_RL represent the differentially expressed genes (DEGs) that show significant correlations with nitrogen use efficiency (NUE-related) in the vegetative and reproductive stages, respectively. The node size represents the Maximal Clique Centrality (MCC) algorithm score. Black-labeled nodes indicate NUEgrain-related genes, and red-labeled nodes represent genes involved in carbon fixation or glyoxylate and dicarboxylate metabolism.
Among the 300 interactions for DEG_NUE_VL, five NUEgrain-related genes identified in previous studies (Kumari et al., 2021; Sharma et al., 2023) were included. Similarly, for DEG_NUE_RL, the top 300 interactions comprised 10 genes.
3.8 TFs in NUE-related DEGsWe identified a total of 234 and 148 TFs in DEG_NUE_VL and DEG_NUE_RL, respectively, using PlantTFDB (Version 5.0) (Supplementary Table S6). The 234 TFs in DEG_NUE_VL were classified into 44 families, comprising 18 major classes (with at least four genes) with a total of 190 genes and 26 minor classes (fewer than four genes) with a total of 44 genes. Similarly, the 148 TFs in DEG_NUE_RL were categorized into 34 classes, including 17 major classes with a total of 122 genes and 17 minor classes with a total of 26 genes. Thirty-three major families were common in both DEG_NUE_VL and DEG_NUE_RL including bHLH, ERF, MYB, bZIP, NAC, MYB_related WRKY, and G2-like (Figure 7A). The analysis of expression differences revealed that 1.28%–70.09% of the TFs in DEG_NUE_VL exhibited significant regulation across the six DEG groups in the vegetative stage, with 0.42%–52.56% showing downregulation (Supplementary Table S6). Similarly, 2.02%–85.14% of TFs in DEG_NUE_RL were found in the six DEG groups in the reproductive stage, with 1.35%–39.19% showing significant downregulation.
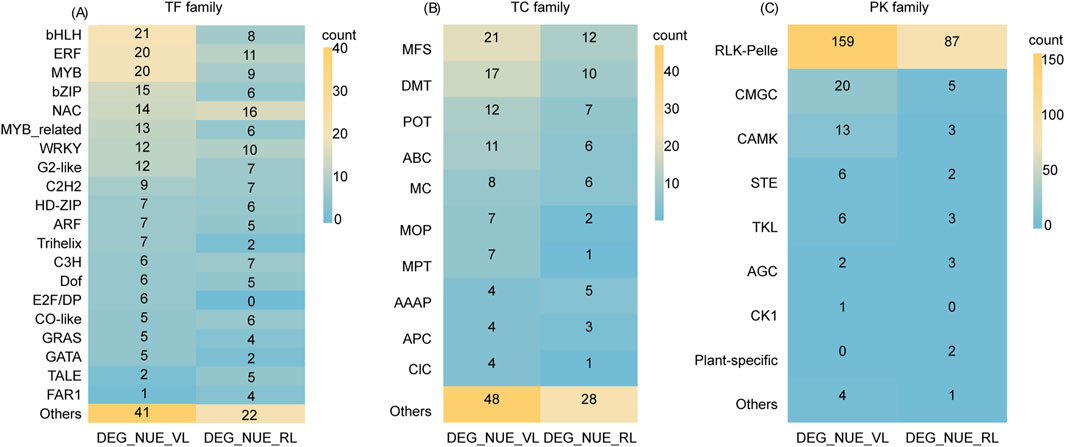
Figure 7. A transcription factor (TF) family analysis (A), transporter (TC) family analysis (B), and protein kinase (PK) family analysis (C) were conducted for DEG_NUE_VL and DEG_NUE_RL. DEG_NUE_VL and DEG_NUE_RL represent the differentially expressed genes (DEGs) that show significant correlations with nitrogen use efficiency (NUE-related) in the vegetative and reproductive stages, respectively.
A Venn analysis was performed to compare the identified TFs of NUE-related DEGs to NUEgrain-related TFs reported in previous studies (Kumari et al., 2021; Sharma et al., 2023). The analysis revealed that six TFs in DEG_NUE_VL and two TFs in DEG_NUE_RL had been identified before (Supplementary Table S6). This suggests that our analysis provides numerous TFs candidates potentially involved in NUE under drought stress.
3.9 Transporters in NUE-related DEGsOf the genes in DEG_NUE_VL and DEG_NUE_RL, 143 and 81 were identified as transporters, with 42 and 33 families in the Rice Transporters Database, respectively (Supplementary Table S7). The 42 families for DEG_NUE_VL included 10 major classes (with at least four genes) and 32 minor classes (fewer than four genes), while the 33 families for DEG_NUE_RL comprised 6 major and 27 minor classes. Notably, the major classes MFS, DMT, POT, ABC, MC, and AAAP were common to both sets of NUE-related DEGs (Figure 7B). The analysis of expression differences revealed that 0.70%–72.73% of the transporters from DEG_NUE_VL showed significant regulations across the six DEG groups in the vegetative stage (Supplementary Table S7). For DEG_NUE_RL, none of the transporters appeared in WM3_vs._WS3, while the other five DEG groups in the reproductive stage contained 1.23%–87.65% of transporters showing significant regulations.
Our analysis identified four transporters from DEG_NUE_VL and five transporters from DEG_NUE_RL that were reported as NUEgrain-related transporters before (Kumari et al., 2021; Sharma et al., 2023) (Supplementary Table S7). This suggests that our findings highlight several transporters as potential candidate genes for enhancing NUE under drought stress conditions.
3.10 PKs in NUE-related DEGsIn the iTak database, 211 genes from DEG_NUE_VL and 106 genes from DEG_NUE_RL were identified as PKs. These PKs were classified into eight groups for both DEG_NUE_VL and DEG_NUE_RL (Figure 7C). Notably, the RLK-Pelle group had the highest number of PKs, accounting for 75.36% of DEG_NUE_VL and 82.08% of DEG_NUE_RL (Supplementary Table S8). The analysis of expression differences revealed that none of the PKs from DEG_NUE_VL appeared in WF2_vs._WM2 and WM1_vs._WS1, while 20.38%–71.09% were present in the other four DEG groups in the vegetative stage (Supplementary Table S8). Among these, 15 PKs exhibited significant regulation in all four of these groups, with 12 of them being downregulated. For DEG_NUE_RL, no PKs showed significant regulation in WF3_vs._WM3 (Supplementary Table S8). However, 0.94%–91.51% of PKs from DEG_NUE_RL were significantly regulated in the other five DEG groups in the reproductive stage.
Three PKs from DEG_NUE_VL and one PK from DEG_NUE_RL were identified as NUEgrain-related PKs in previous studies (Kumari et al., 2021; Sharma et al., 2023) (Supplementary Table S8). This suggests that our analysis identifies several candidate PKs that could potentially contribute to enhancing NUE under drought stress.
4 Discussion4.1 Rice growth under drought stressSoil water availability plays a crucial role in influencing nutrient dynamics and use efficiency through various mechanisms, such as nutrient transformation, nutrient loss mechanisms, and microbial activity (Schimel, 2018; Ullah et al., 2019). In our study, we observed that soil NO3−-N concentrations were lower in normal irrigation treatments compared to drought stress treatments throughout the entire growth stage, while soil NH4+-N concentrations were higher in the normal irrigation treatments, except in the jointing stage (Figure 1). This trend aligns with findings from previous research (Reddy et al., 1984). The soil water contents in mild and severe drought stress conditions were maintained at 80% and 60% of the field capacity, respectively, which have been reported to partially inhibit and provide suitable moisture for soil nitrification (Zhang et al., 2002). Soil denitrification typically occurs when the soil water content exceeds 60% of field capacity. The optimal matric suction for N mineralization falls within the range of 1/3 to 0.1 bar, which overlaps with the soil water potential range observed in the drought stress treatments in our study (Stanford and Epstein, 1974). Furthermore, compared to the normal irrigation treatment, the available N (inorganic N) contents in mild and severe drought stress treatments were higher in the vegetative stage. However, in the reproductive stage, there were no significant differences in available N among the three treatments. This observation might be attributable to inhibited microbial activities caused by long-term drought stress in the mild and severe drought stress treatments, potentially suppressing the generation of soil inorganic N.
To cope with drought stress, plants self-regulate of their physiological and morphological traits. Drought stress typically results in reduced biomass production and yield (Farooq et al., 2009; Pandey and Shukla, 2015). In our study, we observed that the fresh weight and dry weight of aboveground rice under drought stress were consistently lower than those in the normal irrigation treatment throughout the entire growth period (Figures 2B, C), reducing the yields by 23.93%–25.40% (Table 1). These adverse environmental effects lead to growth retardation and subsequent yield losses. This growth retardation is primarily manifested through reduced whole-plant biomass accumulation, to conserve adequate energy reserves (Zhang et al., 2020). Additionally, drought stress imposes limitations on nutrient uptake. Drought stress treatments were associated with lower N accumulation compared to the normal irrigation treatment across the entire growth period; this was particularly evident in the jointing and maturing stages (Figure 2E). N uptake and utilization are energy-dependent processes (Grossman and Takahashi, 2001). Therefore, reduced N accumulation in plants under drought stress can lead to decreased energy consumption, which ultimately benefits plants in adapting to adverse environmental conditions. Despite the lower N accumulation observed in the drought stress treatments, the aboveground N concentration was higher compared to the normal irrigation treatment (Figure 2D). Aboveground N accumulation is simultaneously influenced by both aboveground N concentration and aboveground dry weight. This suggests that the lower aboveground N accumulation under drought stress may be attributable to the reduced aboveground dry weight. This finding is consistent with previous studies (Somaweera et al., 2016) emphasizing the critical role of biomass production in facilitating N accumulation. The drought stress in our study was due to a lack of irrigation. If rice is grown under drought stress caused by high temperature or low humidity, rice will suffer drought and high temperature stresses simultaneously, thus the adverse effects on rice growth and NUE will be more serious (Lawas et al., 2018; Wang et al., 2024). This may be a direction for future research because of global warming.
4.2 Rice NUE under drought stressNUE reflects the efficiency of the plant in converting unit N into biomass. Consistent with previous research (Somaweera et al., 2016), we found that rice subjected to drought stress treatments exhibited significantly lower NUE compared to rice under normal irrigation treatment (Figure 2F).
留言 (0)