Sepsis is a serious condition caused by an uncontrolled reaction of the body to an infection, resulting in organ failure and a high risk of death (Singer et al., 2016). The Global Burden of Disease Study reports that sepsis impacts around 49 million people each year and results in 11 million deaths globally, making up almost a fifth of all worldwide fatalities (Rudd et al., 2020). Even with improvements in healthcare, identifying and treating sepsis continues to be difficult because of its diverse characteristics and the absence of distinct biomarkers (Seymour et al., 2016; Singer et al., 2016). Current diagnostic methods rely heavily on clinical criteria and laboratory tests that often lack sensitivity and specificity, leading to delays in diagnosis and treatment (Gotts and Matthay, 2016). Hence, it is imperative to develop new indicators that can enhance the timely detection and prediction of sepsis.
Recent research has emphasized the significance of epigenetic changes, like methylation, in the development of different illnesses, including sepsis (Bomsztyk et al., 2015; van der Poll et al., 2017). One of the changes that has received focus is m5C, which is known for its control over gene expression and immune system reactions (Wnuk et al., 2020; Qin et al., 2021; Zhang et al., 2022; Tian et al., 2023). Studies have shown that genes related to m5C play a role in controlling the function of immune cells and the body’s inflammatory reactions, both of which are crucial in the advancement of sepsis (Medzhitov, 2008; Angus and van der Poll, 2013). In cancer studies, m5C has been demonstrated to impact the tumor microenvironment and infiltration of immune cells (Zhang et al., 2020; Song et al., 2022; Yu et al., 2022; Gu et al., 2023; Zhang et al., 2023), indicating its possible involvement in regulating immune reactions during sepsis. However, the diagnostic potential and immunological implications of m5C-related genes in sepsis remain largely unexplored.
This study aimed to explore the diagnostic effectiveness and immune infiltration features of m5C-associated genes in cases of sepsis. To identify m5C-related genes and their associated biological pathways, we examined four sepsis-related datasets (GSE95233, GSE57065, GSE100159, and GSE65682) obtained from the GEO database through integration and analysis. Machine learning techniques were employed to select key hub genes, and their diagnostic performance was evaluated using ROC curve analysis. Additionally, we conducted an analysis of individual genes to identify enrichment and immune infiltration, aiming to understand the possible mechanisms that contribute to the role of these central genes in sepsis.
By providing a comprehensive analysis of m5C-related genes in sepsis, our study aims to uncover novel biomarkers that can enhance the early diagnosis and understanding of the immunological landscape of this complex disease.
2 Materials and methods2.1 Acquisition and merging of datasetsThe datasets GSE95233, GSE57065, GSE100159, and GSE65682 related to sepsis were obtained from the GEO database (https://www.ncbi.nlm.nih.gov/geo/) (Table 1). The data platforms of GSE95233 and GSE57065 were GPL570. GSE95233 contained 22 normal samples and 102 sepsis samples. In GSE57065, there are 25 samples classified as normal and 82 samples classified as sepsis. These two datasets were combined using the R package inSilicoMerging, followed by the application of the COMBAT method to eliminate batch effects. The merged dataset was used as the test set. The GSE100159 data platform was GPL6884, which contained 12 normal samples and 35 sepsis samples. The GSE65682 data platform was GPL13667, which contained 42 normal samples and 479 sepsis samples. The required samples were extracted as the validation set, respectively.
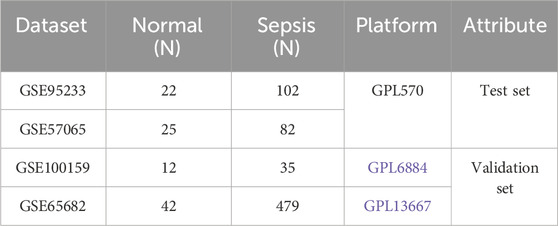
Table 1. Information on selected datasets.
2.2 Difference analysis and enrichment analysisAccording to the information on sample grouping, the groups were analyzed differentially using the limma package in R. The genes with adjusted p-value <0.05 and |logFC| > 0.263 (equivalent to a 1.2-fold difference) were identified as differentially expressed genes (DEGs). The differentially expressed genes were visualized using volcano plots created with the ggplot2 package in R. A total of 48 m5C-related genes were gathered from GeneCards (https://www.genecards.org/). The overlap between the differentially expressed genes and m5C-related genes was determined using a Venn diagram, resulting in m5C-related differential genes. These m5C-related differential genes were then depicted in a heatmap using the R package pheatmap. The clusterProfiler package in R was utilized to conduct gene ontology (GO) functional annotation analysis and Kyoto Encyclopedia of Genes and Genomes (KEGG) pathway enrichment analysis for m5C-related differential genes.
2.3 Machine learning screening of hub genesIn order to screen the most diagnostically significant m5C-related genes, we used R’s rpart package for decision tree analysis, the randomForest package for random forest analysis, and the xgboost package for XGBOOST analyses. We then performed importance analysis on the included genes, respectively. We selected only the top 5 genes in importance from each method and used the common genes among them as hub genes.
2.4 Analysis and validation of hub genes diagnostic efficacyROC analysis was performed using the pROC package in R. The results were visualized using ggplot2 to assess the diagnostic efficacy of the hub gene, with an AUC >0.7 indicating high diagnostic efficacy. The diagnostic efficacy of the hub gene was verified using GSE100159 and GSE65682.
2.5 Single gene enrichment analysis of hub genesWe obtained the Gene Set Enrichment Analysis (GSEA) software (version 3.0) from the website of GSEA (http://software.broadinstitute.org/gsea/index.jsp) and divided the samples into a high expression group (≥50%) and a low expression group (<50%) according to the expression level of the hub gene. We downloaded the c2. cp.kegg.v7.4. symbols.gmt subset from the Molecular Signatures Database (http://www.gsea-msigdb.org/gsea/downloads.jsp) to assess relevant pathways and molecular mechanisms. During GSEA analysis, based on gene expression profiles and phenotypic grouping, we set a minimum gene set of 5 and a maximum gene set of 5,000. One thousand resamplings were performed, and a p-value <0.05 and a false discovery rate (FDR) < 0.25 were considered statistically significant.
2.6 Immune infiltration analysisTo further explore the similarities and differences in the levels of immune cell infiltration between the two groups of samples, we uploaded the merged dataset (GSE95233 and GSE57065) to CIBERSORTx (https://cibersortx.stanford.edu/) and analyzed the immune cell infiltration using LM22 as the reference dataset, with the cutoff point set to a p-value <0.05. We plotted bar graphs in R to illustrate the percentage of each immune cell type in individual samples, box line plots to show the infiltration of all immune cells under different grouping scenarios, and correlation plots to show correlation plots between each immune cell and each hub gene. In addition, to directly view the correlation between hub genes and immune cell infiltration levels, correlation scatter plots were generated, and correlation curves were fitted for gene-immune cell pairs with significant correlations (correlation coefficients greater than 0.6).
2.7 Statistical analysesData processing and analysis were conducted using Excel (Microsoft) and R software (version 4.2.1). To compare two sets of continuous variables, the independent Student’s t-test was used to determine statistical significance for normally distributed variables, while the Mann-Whitney U test (also known as the Wilcoxon rank sum test) was used for non-normally distributed variables. Either the chi-square test or Fisher’s exact test was utilized for comparing and analyzing the statistical significance of two groups of categorical variables. The Kruskal–Wallis test was utilized for comparing multiple groups, while the Wilcoxon test was employed for comparing two groups. A two-tailed p-value <0.05 was considered statistically significant.
2.8 Ethics statementNo ethical approval was necessary for the human studies as the data from the GEO database is easily accessible to the public. Participants or their legal guardians/next of kin were not required to provide written informed consent to take part in this study, as per national laws and institutional guidelines.
3 Results3.1 Data pre-processingFigure 1 shows the full text analysis flow. Figure 2 displays the box-and-line and UMAP plots comparing data distribution before and after batch effect removal for the merged dataset (GSE95233 and GSE57065 merged). The box plots (Figures 2A, B) reveal significant differences in the sample distribution of each dataset prior to batch effect removal, indicating the presence of a batch effect. However, after batch effect removal, the data distribution among datasets becomes more consistent, with the median aligning on a straight line. The UMAP plot (Figures 2C, D) indicates that the samples within each dataset are closely grouped prior to batch effect removal, implying the presence of a batch effect. Subsequently, the samples from each dataset are intermingled post-batch effect removal, indicating successful elimination of the batch effect.
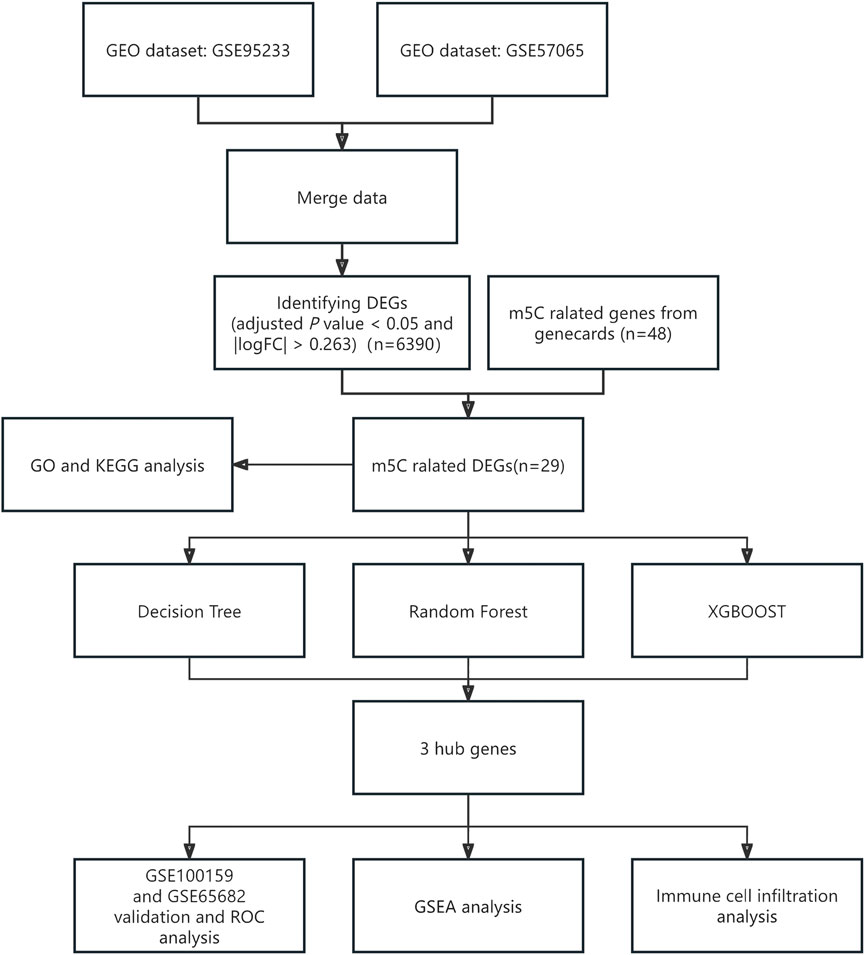
Figure 1. Flowchart of full text analysis. GEO, gene expression omnibus; m5C, 5-methylcytosine; DEGs, differentially expressed genes; GO, gene ontology; GSEA, gene set enrichment analysis; KEGG, Kyoto Encyclopedia of Genes and Genomes; ROC, receiver operating characteristic.

Figure 2. Data set merging and de-batching. (A) Box line plot of data distribution comparison before data pooling and removal of batch effect for GSE95233 and GSE57065; (B) Box line plot of data distribution comparison after data pooling and removal of batch effect for GSE95233 and GSE57065; (C) Umap plot of data distribution comparison before data pooling and removal of batch effect for GSE95233 and GSE57065; (D) Umap plot of data distribution comparison between GSE95233 and GSE57065 data set and after removal of batch effect.
3.2 Screening and enrichment analyses of m5C-related DEGsDifferential expression analyses of 47 normal samples and 184 sepsis samples from the merged data (GSE95233 and GSE57065 merged) cohort were performed using the limma package, and a total of 6,390 DEGs were identified and plotted in a volcano diagram (Figure 3A). A total of 48 genes associated with m5C were gathered from GeneCards (Supplementary Table 1), and 29 differential genes related to m5C were identified by overlapping the differential genes with m5C-related genes using a Venn diagram (Figure 3B; Supplementary Table 2). Heatmaps for the m5C-related differential genes were then created (Figure 3C). Functional annotation analysis and pathway enrichment analysis were conducted to identify the biological functions of the m5C-related genes using the clusterProfiler package of R. The m5C-related genes were primarily associated with large molecule modification, RNA modification, and cellular stress response. They were also found to be enriched in pathways such as the p53 signaling pathway, central carbon metabolism in cancer, and Toll-like receptor signaling pathway (Figure 3D; Supplementary Table 3).
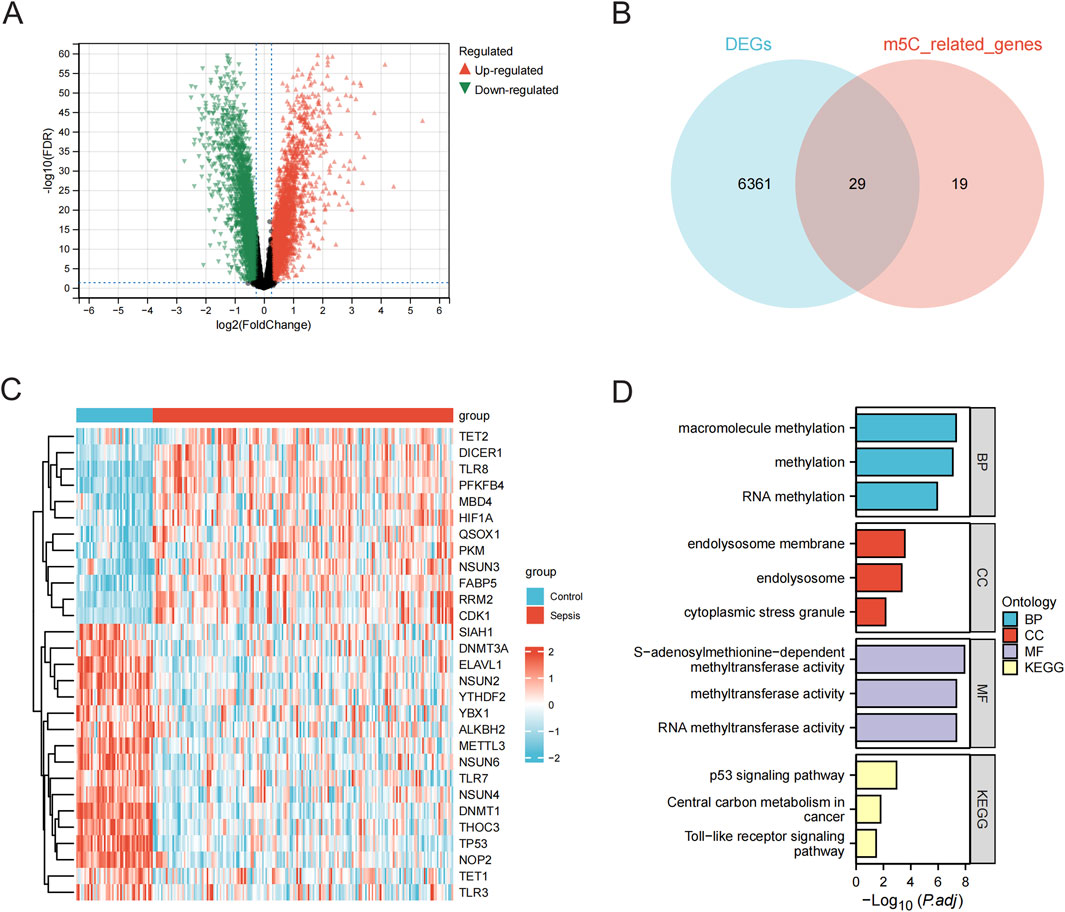
Figure 3. Screening and enrichment analysis of m5C-related DEGs. (A) Volcano plot of expression differences between normal and sepsis sample groups in the combined data (GSE95233 and GSE57065 combined) cohort. (B) Wayne plots of differential and m5C-related genes. (C) Heatmap of m5C-related differential gene expression in the combined data cohort. (D) Bar graph of GO and KEGG analysis of m5C-related differential genes. BP, biological processes; CC, cellular components; MF, molecular functions; m5C, 5-methylcytosine; DEGs, differentially expressed genes; KEGG, Kyoto Encyclopedia of Genes and Genomes.
3.3 Three machine learning screens for hub genesWe performed three machine learning algorithms to analyze the 29 m5C-related differential genes, including Decision Tree, XGB00ST, and Random Forest, and also showed the variable importance of the different algorithms (Figures 4A–C). To screen the most diagnostically significant genes, we selected only the top 5 genes in importance from each method and used the common genes among them as hub genes, and the genes intersected by the 3 methods were DNMT1, TP53, and TLR8 (Figure 4D; Supplementary Table 4).
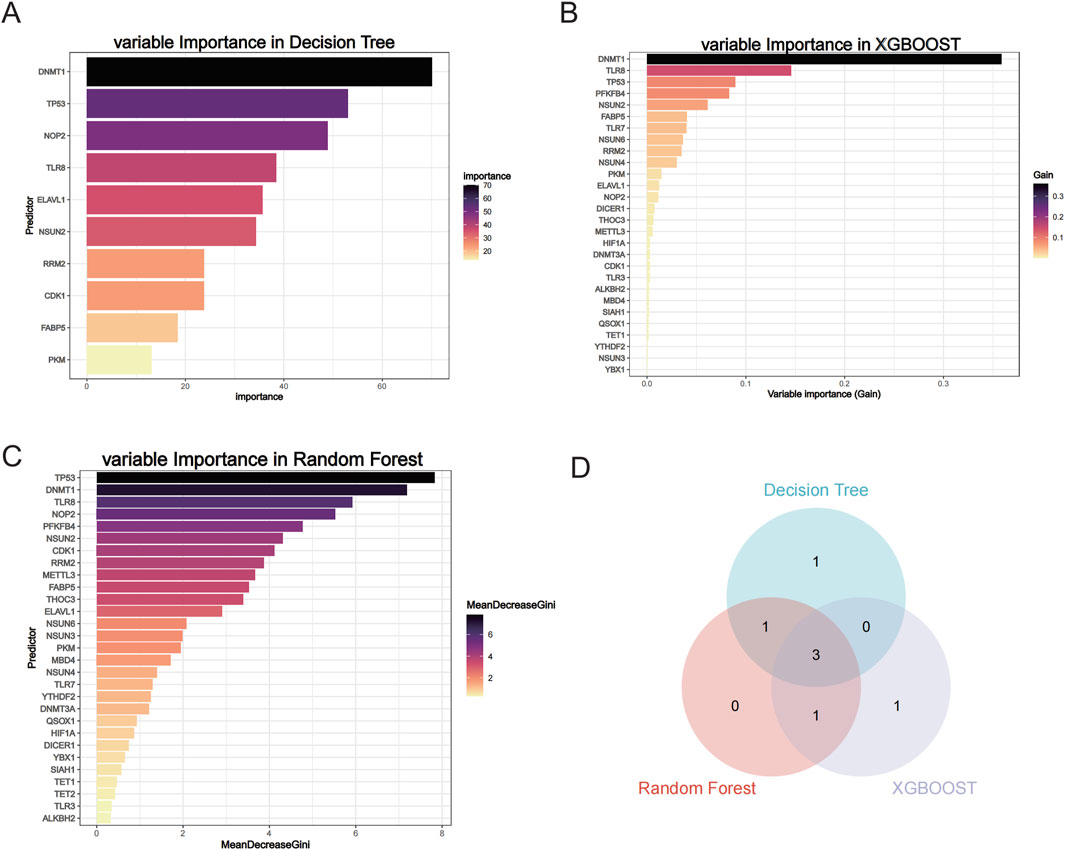
Figure 4. Three machine learning screening hub genes. (A) Variable Importance in Decision Tree. (B) Variable Importance in XGB00ST. (C) Variable Importance in Random Forest. (D) Wayne diagram of three machine learning screening hub genes.
3.4 Validation of hub genes expression differences and diagnostic performanceThe merged data from GSE95233 and GSE57065 showed a significant decrease in the expression of DNMT1 and TP53 in the sepsis group compared to the control group, while the expression of TLR8 was significantly elevated in the sepsis group (Figure 5A), and the ROC analysis found the AUC to be 0.979, 0.967, and 0.944 for DNMT1, TP53, and TLR8, respectively (Figure 5D). In the validation set GSE100159, the sepsis group showed significantly decreased levels of DNMT1 and TP53 compared to the control group, along with significantly increased levels of TLR8 (Figure 5B). The AUC values from ROC analysis were 0.905, 0.740, and 0.950 for DNMT1, TP53, and TLR8, respectively (Figure 5E). Within the GSE65682 validation set, the levels of DNMT1 and TP53 were notably reduced in the sepsis group compared to the control group, while TLR8 levels were significantly elevated in the sepsis group (Figure 5C). The ROC analysis indicated AUC values of 0.990, 0.797, and 0.889 for DNMT1, TP53, and TLR8, respectively (Figure 5F). To sum up, in our research, in both the test set and the validation set, DNMT1, TP53, and TLR8 exhibited notable variations in expression levels between normal and sepsis sample groups. The AUCs of these three central genes exceeded 0.7, indicating a distinct diagnostic significance.
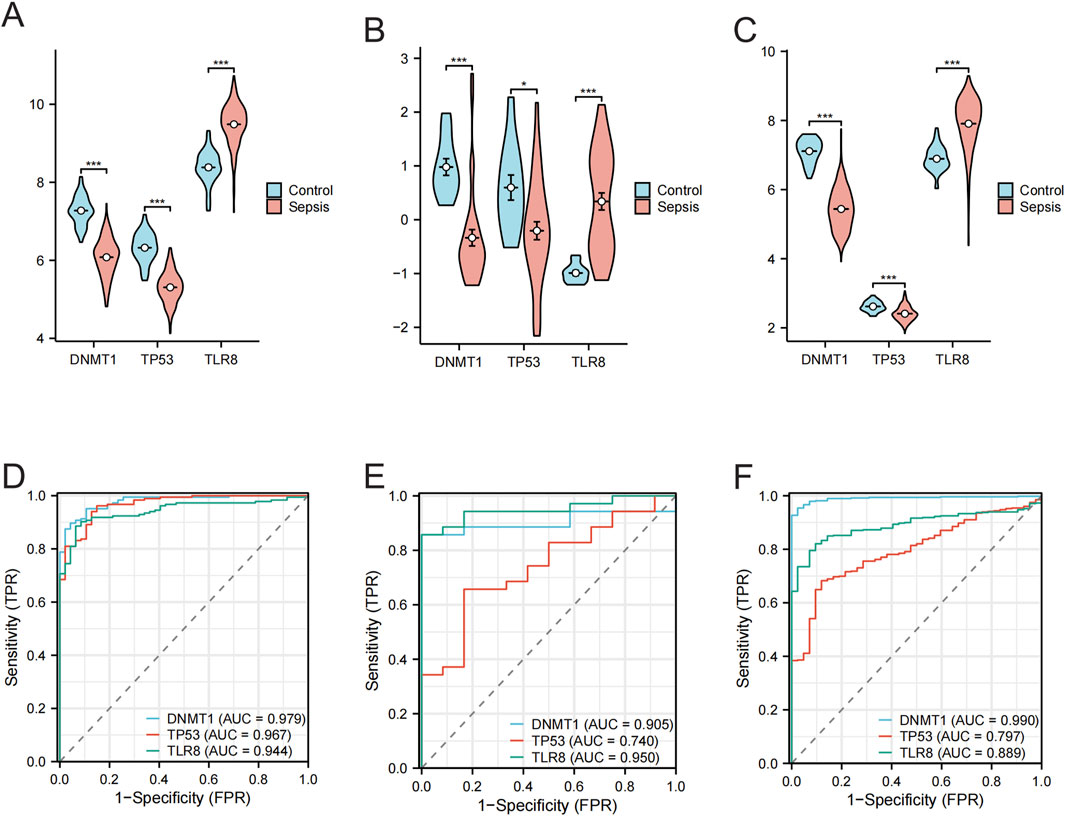
Figure 5. Differential expression of the hub gene in normal and sepsis samples and its ROC analysis results. (A) Violin plot showing the expression difference of DNMT1, TP53, and TLR8 genes in normal vs sepsis groups in the merged data (GSE95233 and GSE57065 merged). (B) Violin plot showing the expression differences of DNMT1, TP53, and TLR8 genes in the GSE100159 dataset in the normal group vs the sepsis group. (C) Violin plot showing the expression differences of DNMT1, TP53, and TLR8 genes in the GSE65682 dataset in the normal group versus the sepsis group. (D) ROC curves analyzing the diagnostic efficacy of the three hub genes DNMT1, TP53, and TLR8 in the combined data (GSE95233 and GSE57065 combined). (E) ROC curves analyzing the diagnostic efficacy of the three hub genes DNMT1, TP53, and TLR8 in the GSE100159 dataset. (F) ROC curves analyzing the diagnostic efficacy of the three hub genes DNMT1, TP53, and TLR8 in the GSE65682 dataset.
3.5 Single gene enrichment analysis of hub genesIn the merged data (GSE95233 and GSE57065 merged), single-gene GSEA analyses were performed on the three hub genes to obtain the associated pathways for each gene (Figures 6B–D), with 25 significantly enriched pathways by single-gene GSEA analysis for DNMT1 (Supplementary Table 5), 15 significantly enriched pathways by single-gene GSEA analysis for TP53 (Supplementary Table 6), and 27 pathways were significantly enriched by single-gene GSEA analysis for TLR8 (Supplementary Table 7). By intersecting the three hub genes using a Venn diagram (Figure 6A), four common significantly enriched pathways were identified: allograft rejection, graft versus host disease, primary immunodeficiency, and t cell receptor signaling pathway. These pathways, crucial for the immune system, indicate that the three hub genes may be pivotal in sepsis development through immune response regulation.
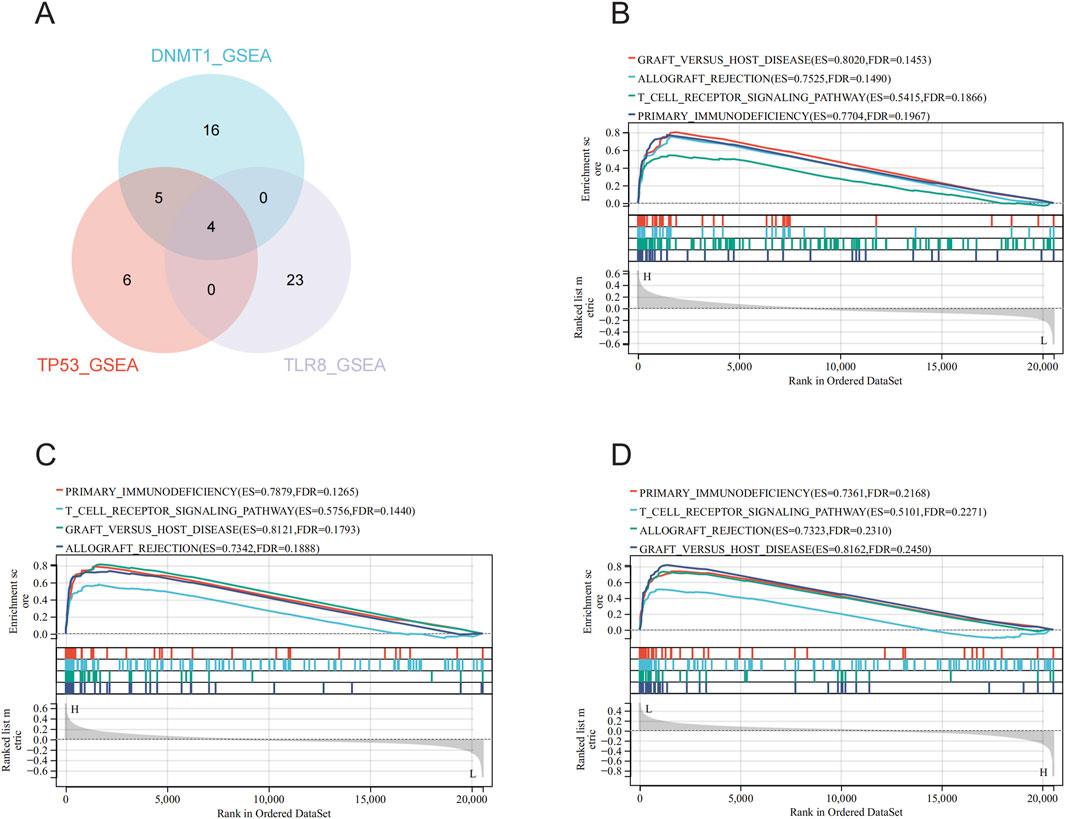
Figure 6. Single gene enrichment analysis and intersection pathway analysis of hub genes. (A) Screening of DNMT1, TP53, and TLR8 for single gene enrichment analysis of significantly enriched pathways in Wayne plots. (B) Single gene enrichment analysis of DNMT1. (C) Single gene enrichment analysis of TP53. (D) Single gene enrichment analysis of TLR8.
3.6 Immune infiltration analysisThe CIBERSORT method was utilized to assess the variations in immune cell penetration between standard samples and sepsis samples. A bar chart was employed to demonstrate the proportion of each kind of immune cell in individual samples (Supplementary Figure 1), while a box plot was created to exhibit the penetration of all immune cells under various grouping conditions (Figure 7). The findings revealed that the immune cells showing distinct penetration levels between standard samples and sepsis samples included B cells naive, plasma cells, T cells CD8, T cells CD4 naive, T cells CD4 memory resting, T cells CD4 memory activated, T cells regulatory (Tregs), T cells gamma delta, NK cells resting, NK cells activated, monocytes, macrophages M0, macrophages M2, dendritic cells resting, dendritic cells activated, mast cells activated, eosinophils, and neutrophils (Figure 7A). The immune cells displaying different penetration levels between the high and low expression groups of DNMT1 comprised B cells naive, plasma cells, T cells CD8, T cells CD4 naive, T cells CD4 memory resting, T cells follicular helper, NK cells resting, monocytes, macrophages M0, macrophages M1, macrophages M2, dendritic cells resting, mast cells resting, mast cells activated, and neutrophils (Figure 7B). The immune cells manifesting diverse penetration levels between the high and low expression groups of TP53 encompassed B cells naive, plasma cells, T cells CD8, T cells CD4 naive, T cells CD4 memory resting, T cells gamma delta, NK cells resting, macrophages M0, macrophages M2, dendritic cells resting, dendritic cells activated, eosinophils, and neutrophils (Figure 7C). The immune cells with varying penetration levels between the high and low expression groups of TLR8 included B cells naive, plasma cells, T cells CD8, T cells CD4 naive, T cells CD4 memory resting, T cells regulatory (Tregs), NK cells resting, monocytes, macrophages M0, macrophages M2, dendritic cells resting, dendritic cells activated, and neutrophils (Figure 7D).
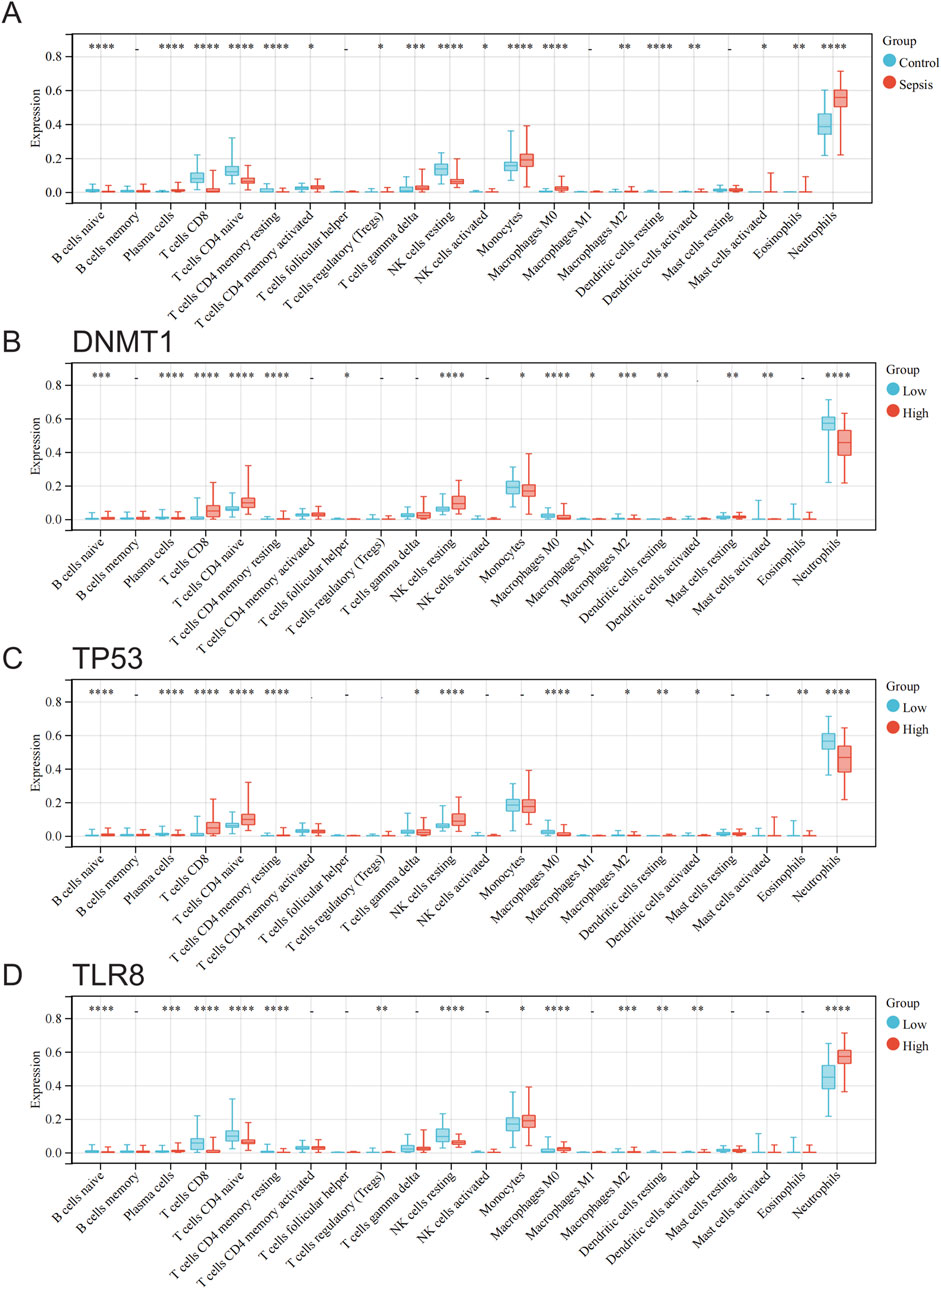
Figure 7. Analysis of differences in immune cell infiltration between groups of normal and sepsis samples and at different hub gene expression levels. (A) Differences in immune cell infiltration between normal and sepsis samples. (B) Differences in immune cell infiltration between groups with high and low DNMT1 expression. (C) Differences in immune cell infiltration between high and low TP53 expression groups. (D) Differences in immune cell infiltration between high and low TLR8 expression groups.
Figure 8 displays correlation plots showing the connections between individual hub genes and various types of immune cells. DNMT1 exhibited strong associations with T cells CD8 (R = 0.63) (Figure 9A), T cells CD4 naive (R = 0.60) (Figure 9B), and NK cells resting (R = 0.61) (Figure 9C), while showing an inverse relationship with neutrophils (R = −0.69) (Figure 9D). TP53 showed a strong positive association with CD8 T cells (R = 0.63) (Figure 9E) and a negative correlation with neutrophils (R = −0.62) (Figure 9F). TLR8 exhibited inverse relationships with CD8 T cells (R = −0.71) (Figure 9G) and resting NK cells (R = −0.63) (Figure 9H), while demonstrating a direct correlation with neutrophils (R = 0.73) (Figure 9I).
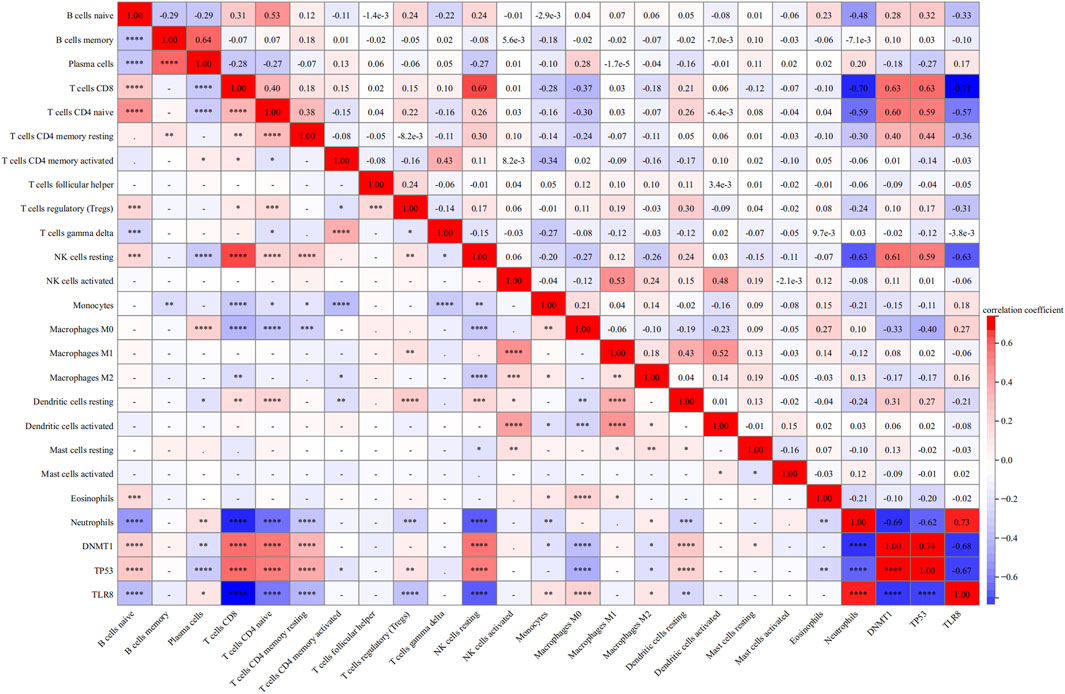
Figure 8. Heatmap of correlation analysis between each immune cell and each hub gene.
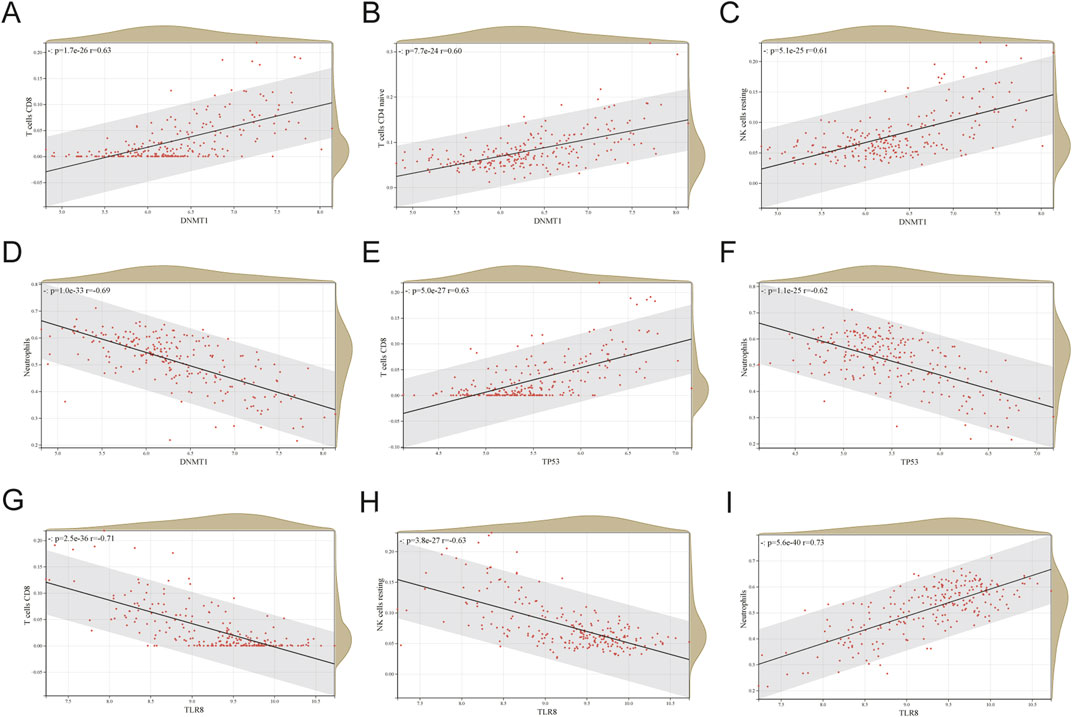
Figure 9. Correlation between each hub gene and specific immune cells. (A) DNMT1 correlation plot with T cells CD8. (B) DNMT1 correlation plot with T cells CD4 naive. (C) Correlation plot of DNMT1 with NK cells resting. (D) DNMT1 correlation plot with neutrophils. (E) TP53 correlation plot with T cells CD8. (F) Correlation graph of TP53 with neutrophils. (G) Correlation of TLR8 with T cells CD8. (H) TLR8 vs NK cells resting correlation graph. (I) TLR8 correlation plot with neutrophils.
4 DiscussionSepsis is a serious medical condition caused by an uncontrolled reaction of the body to an infection, resulting in organ failure and a high risk of death (Singer et al., 2016). It poses a significant burden on healthcare systems worldwide, with millions of cases reported annually and substantial healthcare costs (Rudd et al., 2020). The intricate nature of sepsis pathophysiology, which includes complex interactions among the immune system and different organ systems, makes diagnosing and treating it challenging (van der Poll et al., 2017; Cecconi et al., 2018). Early and accurate diagnosis is crucial for improving patient outcomes, yet current diagnostic methods are often insufficiently sensitive or specific (Gotts and Matthay, 2016; Seymour et al., 2016). Hence, it is crucial to develop new indicators and diagnostic instruments to improve the early identification and treatment of sepsis.
The research is centered on exploring the diagnostic capabilities of m5C-associated genes in sepsis and their impact on immune infiltration, with the goal of connecting molecular mechanisms to practical clinical use. Through the integration of various sepsis-related datasets and the utilization of advanced bioinformatics and machine learning methods, we discovered crucial m5C-associated genes that are differentially expressed and identified hub genes that have a strong diagnostic performance (AUC >0.7). These findings were further validated in independent datasets, underscoring their robustness and potential clinical utility. Additionally, the study’s immune infiltration analysis revealed significant correlations between hub genes and immune cell types, providing new insights into the immune regulatory mechanisms in sepsis. This thorough method not only improves our comprehension of sepsis development but also opens up opportunities for creating more accurate diagnostic and treatment plans.
The enrichment analysis results from our study revealed that the m5C-related DEGs are significantly involved in several key biological processes and pathways, including macromolecule methylation, RNA methylation, and the p53 signaling pathway. The results align with earlier research emphasizing the significance of RNA alterations and the p53 pathway in controlling immunity and responding to cellular stress (Vousden and Prives, 2009; Smith and Meissner, 2013; Levine, 2020). Specifically, the p53 signaling pathway is well-known for its role in regulating cell cycle, apoptosis, and genomic stability, which are critical processes in the pathophysiology of sepsis (Vousden and Lane, 2007; Kastenhuber and Lowe, 2017).
DNMT1, TP53, and TLR8 were identified as hub genes through our machine learning analysis, and their diagnostic effectiveness was confirmed with AUC values exceeding 0.7. DNMT1 plays a crucial role in DNA methylation, which is linked to controlling gene activity and immune system reactions (Cedar and Bergman, 2012; Moore et al., 2013). The TP53 gene, known for suppressing tumors, is essential for responding to cellular stress and has been found to engage with different immune pathways (Vousden and Lane, 2007; Vousden and Prives, 2009). TLR8 belongs to the Toll-like receptor group, playing a crucial role in identifying pathogens and triggering the body’s natural defense system (Kawai and Akira, 2010; Eigenbrod et al., 2015).
The analysis of a single gene using GSEA showed significant enrichment of DNMT1, TP53, and TLR8 in immune-related pathways like allograft rejection. This route plays a role in the body’s defense against transplanted tissues and has similarities with the immune system dysfunction seen in sepsis. The presence of these hub genes in pathways related to the immune system highlights their possible involvement in regulating immune reactions in cases of sepsis.
The analysis of immune cell infiltration showed notable variations in the quantities of different immune cells in normal and sepsis samples, as well as in groups with high and low expression of the hub genes DNMT1, TP53, and TLR8. DNMT1 and TP53 showed a strong positive relationship with T cells CD8 (R = 0.63 for both) and a negative relationship with neutrophils (R = −0.69 and R = −0.62, respectively). In contrast, there was an inverse relationship between TLR8 and CD8 T cells (R = −0.71), while a direct correlation was observed with neutrophils (R = 0.73). These findings are consistent with previous studies that have highlighted the critical role of T cells CD8 and neutrophils in the immune response during sepsis (Hotchkiss and Karl, 2003; Boomer et al., 2011).
T cells CD8 are known for their cytotoxic functions, which are essential for eliminating infected cells and controlling infections (Harty et al., 2000). The connection between DNMT1 and TP53 implies that these genes could help boost the cytotoxic reaction, possibly aiding in the elimination of pathogens during sepsis. On the other hand, neutrophils are the first responders to infection and are crucial for the initial immune response (Kolaczkowska and Kubes, 2013; Fine et al., 2020; Richardson et al., 2021). However, their excessive activation can lead to tissue damage and exacerbate sepsis (Kolaczkowska and Kubes, 2013). The negative correlation of DNMT1 and TP53 with neutrophils implies a potential regulatory role in mitigating the detrimental effects of neutrophil overactivation (Formosa et al., 2022).
TLR8, part of the Toll-like receptor group, plays a role in identifying pathogens and triggering the body’s natural defense system (Kawai and Akira, 2010; Eigenbrod et al., 2015). Its positive correlation with neutrophils and negative correlation with T cells CD8 suggests a complex regulatory mechanism where TLR8 may enhance the innate immune response while potentially suppressing the adaptive immune response. This dual role could be critical in the context of sepsis, where a balanced immune response is necessary to control infection without causing excessive inflammation (Venet and Monneret, 2018).
Discovering these connections offers fresh perspectives on the immune control processes in sepsis, emphasizing the possibility of DNMT1, TP53, and TLR8 as markers for diagnosis and targets for treatment. Comprehending how these hub genes interact with the infiltration of immune cells can assist in creating better approaches for treating sepsis, leading to enhanced results for patients.
Although the results are promising, there are various constraints in this research. Firstly, the research relies solely on bioinformatics analysis without incorporating wet lab experiments, which could provide more direct evidence to support the computational predictions. Secondly, while we utilized large datasets from the GEO database, the absence of specific bioinformatic data on sepsis subtypes prevented a more granular analysis. As a result, we treated sepsis as a homogeneous entity, which is a limitation given the diverse etiologies and mechanisms involved in sepsis. Thirdly, the sample size, although pooled from various datasets, may not fully capture the heterogeneity of sepsis, potentially limiting the generalizability of our findings. Moreover, the lack of clinical validation means that the diagnostic potential of the identified hub genes remains to be confirmed in real-world settings. Finally, while the integration of multiple datasets increased the overall sample size, the possibility of batch effects, despite mitigation efforts using the COMBAT method, may still influence the results and their interpretation.
5 ConclusionIn summary, this study successfully identified m5C-related differentially expressed genes in sepsis and highlighted their potential biological functions through GO and KEGG enrichment analyses. Through the utilization of machine learning methods, we pinpointed crucial central genes that exhibit strong diagnostic effectiveness, as illustrated by the analysis of ROC curves and subsequently confirmed in separate datasets. Analysis of gene enrichment and immune infiltration in a single gene shed light on the molecular mechanisms and immune regulatory functions of these central genes in cases of sepsis. Despite the limitations, these findings offer a new perspective on the diagnosis and immune regulation of sepsis, paving the way for future research and potential clinical applications. Future studies should aim to validate these findings through wet-lab experiments and clinical trials to confirm their diagnostic and therapeutic potential.
Data availability statementThe original contributions presented in the study are included in the article/supplementary material, further inquiries can be directed to the corresponding authors.
Ethics statementThe requirement of ethical approval was waived by the Institutional Review Board of the First Hospital of Fujian Medical University for the studies involving humans because the data from the GEO database is easily accessible to the public. Participants or their legal guardians/next of kin were not required to provide written informed consent to take part in this study, as per national laws and institutional guidelines. The studies were conducted in accordance with the local legislation and institutional requirements. Written informed consent for participation was not required from the participants or the participants and apos; legal guardians/next of kin because No identifiable personal information was involved.
Author contributionsSL: Conceptualization, Data curation, Formal Analysis, Funding acquisition, Investigation, Methodology, Project administration, Resources, Software, Supervision, Validation, Visualization, Writing–original draft, Writing–review and editing. CK: Formal Analysis, Investigation, Methodology, Software, Validation, Visualization, Writing–original draft, Writing–review and editing. SF: Conceptualization, Data curation, Methodology, Project administration, Supervision, Writing–review and editing. ZL: Conceptualization, Data curation, Methodology, Project administration, Supervision, Writing–review and editing.
FundingThe author(s) declare financial support was received for the research, authorship, and/or publication of this article. This study was supported by the Natural Science Foundation of Fujian Province (2022J01226), the Youth Scientifc Research Project of Fujian Province Health Commission (No. 2020QNB022) and the Qihang Funds of Fujian Medical University (No. 2021QH1100).
AcknowledgmentsThanks to the contributors for uploading meaningful datasets and to the GEO for providing the platform.
Conflict of interestThe authors declare that the research was conducted in the absence of any commercial or financial relationships that could be construed as a potential conflict of interest.
Publisher’s noteAll claims expressed in this article are solely those of the authors and do not necessarily represent those of their affiliated organizations, or those of the publisher, the editors and the reviewers. Any product that may be evaluated in this article, or claim that may be made by its manufacturer, is not guaranteed or endorsed by the publisher.
Supplementary materialThe Supplementary Material for this article can be found online at: https://www.frontiersin.org/articles/10.3389/fgene.2024.1444003/full#supplementary-material
Supplementary Table 1 | GeneCards m5C-related genes.
Supplementary Table 2 | Expression of 29 m5C-associated differential genes.
Supplementary Table 3 | Summary of the top 5 significant entries in the GO and KEGG enrichment analysis results for 29 m5C-related differential genes.
Supplementary Table 4 | Introducing 3 hub genes.
Supplementary Table 5 | Summary of Significant Enrichment Pathways for Single Gene Enrichment Analysis of DNMT1.
Supplementary Table 6 | Summary of Significant Enrichment Pathways for Single Gene Enrichment Analysis of TP53.
Supplementary Table 7 | Summary of Significant Enrichment Pathways for Single Gene Enrichment Analysis of TLR8.
Supplementary Figure 1 | Histogram of the percentage of each immune cell type in individual samples from the combined data (GSE95233 & GSE57065 combined).
ReferencesBomsztyk, K., Mar, D., An, D., Sharifian, R., Mikula, M., Gharib, S. A., et al. (2015). Experimental acute lung injury induces multi-organ epigenetic modifications in key angiogenic genes implicated in sepsis-associated endothelial dysfunction. Crit. care London, Engl. 19 (1), 225. doi:10.1186/s13054-015-0943-4
PubMed Abstract | CrossRef Full Text | Google Scholar
Boomer, J. S., To, K., Chang, K. C., Takasu, O., Osborne, D. F., Walton, A. H., et al. (2011). Immunosuppression in patients who die of sepsis and multiple organ failure. JAMA 306 (23), 2594–2605. doi:10.1001/jama.2011.1829
PubMed Abstract | CrossRef Full Text | Google Scholar
Eigenbrod, T., Pelka, K., Latz, E., Kreikemeyer, B., and Dalpke, A. H. (2015). TLR8 senses bacterial RNA in human monocytes and plays a nonredundant role for recognition of Streptococcus pyogenes. J. Immunol. (Baltimore, Md. 1950) 195 (3), 1092–1099. doi:10.4049/jimmunol.1403173
PubMed Abstract | CrossRef Full Text | Google Scholar
Fine, N., Tasevski, N., McCulloch, C. A., Tenenbaum, H. C., and Glogauer, M. (2020). The neutrophil: constant defender and first responder. Front. Immunol. 11571085, 571085. doi:10.3389/fimmu.2020.571085
PubMed Abstract | CrossRef Full Text | Google Scholar
Formosa, A., Turgeon, P., and Dos Santos, C. C. (2022). Role of miRNA dysregulation in sepsis. Mol. Med. (Cambridge, Mass.) 28 (1), 99. doi:10.1186/s10020-022-00527-z
CrossRef Full Text | Google Scholar
Gu, X., Ma, X., Chen, C., Guan, J., Wang, J., Wu, S., et al. (2023). Vital roles of m(5)C RNA modification in cancer and immune cell biology. Front. Immunol. 14, 141207371. doi:10.3389/fimmu.2023.1207371
CrossRef Full Text | Google Scholar
Harty, J. T., Tvinnereim, A. R., and White, D. W. (2000). CD8+ T cell effector mechanisms in resistance to infection. Annu. Rev. Immunol. 18, 18275–18308. doi:10.1146/annurev.immunol.18.1.275
PubMed Abstract | CrossRef Full Text | Google Scholar
Qin, W., Scicluna, B. P., and van der Poll, T. (2021). The role of host cell DNA methylation in the immune response to bacterial infection. Front. Immunol. 12696280, 696280. doi:10.3389/fimmu.2021.696280
PubMed Abstract | CrossRef Full Text | Google Scholar
Richardson, I. M., Calo, C. J., and Hind, L. E. (2021). Microphysiological systems for studying cellular crosstalk during the neutrophil response to infection. Front. Immunol. 12661537, 661537. doi:10.3389/fimmu.2021.661537
PubMed Abstract | CrossRef Full Text | Google Scholar
Rudd, K. E., Johnson, S. C., Agesa, K. M., Shackelford, K. A., Tsoi, D., Kievlan, D. R., et al. (2020). Global, regional, and national sepsis incidence and mortality, 1990-2017: analysis for the Global Burden of Disease Study. Lancet 395 (10219), 200–211. doi:10.1016/S0140-6736(19)32989-7
PubMed Abstract | CrossRef Full Text | Google Scholar
Seymour, C. W., Liu, V. X., Iwashyna, T. J., Brunkhorst, F. M., Rea, T. D., Scherag, A., et al. (2016). Assessment of clinical criteria for sepsis: for the third international consensus definitions for sepsis and septic shock (Sepsis-3). JAMA 315 (8), 762–774. doi:10.1001/jama.2016.0288
PubMed Abstract | CrossRef Full Text | Google Scholar
Singer, M., Deutschman, C. S., Seymour, C. W., Shankar-Hari, M., Annane, D., Bauer, M., et al. (2016). The third international consensus definitions for sepsis and septic shock (Sepsis-3). JAMA 315 (8), 801–810. doi:10.1001/jama.2016.0287
PubMed Abstract | CrossRef Full Text | Google Scholar
Song, H., Zhang, J., Liu, B., Xu, J., Cai, B., Yang, H., et al. (2022). Biological roles of RNA m(5)C modification and its implications in Cancer immunotherapy. Biomark. Res. 10 (1), 15. doi:10.1186/s40364-022-00362-8
PubMed Abstract | CrossRef Full Text | Google Scholar
Tian, Y., Xiao, H., Yang, Y., Zhang, P., Yuan, J., Zhang, W., et al. (2023). Crosstalk between 5-methylcytosine and N(6)-methyladenosine machinery defines disease progression, therapeutic response and pharmacogenomic landscape in hepatocellular carcinoma. Mol. Cancer 22 (1), 5. doi:10.1186/s12943-022-01706-6
PubMed Abstract | CrossRef Full Text | Google Scholar
van der Poll, T., van de Veerdonk, F. L., Scicluna, B. P., and Netea, M. G. (2017). The immunopathology of sepsis and potential therapeutic targets. Nat. Rev. Immunol. 17 (7), 407–420. doi:10.1038/nri.2017.36
PubMed Abstract | CrossRef Full Text | Google Scholar
Venet, F., and Monneret, G. (2018). Advances in the understanding and treatment of sepsis-induced immunosuppression. Nat. Rev. Nephrol. 14 (2), 121–137. doi:10.1038/nrneph.2017.165
PubMed Abstract | CrossRef Full Text | Google Scholar
Wnuk, M., Slipek, P., Dziedzic, M., and Lewinska, A. (2020). The roles of host 5-methylcytosine RNA methyltransferases during viral infections. Int. J. Mol. Sci. 21 (21), 8176. doi:10.3390/ijms21218176
PubMed Abstract | CrossRef Full Text | Google Scholar
Yu, G., Bao, J., Zhan, M., Wang, J., Li, X., Gu, X., et al. (2022). Comprehensive analysis of m5C methylation regulatory ge
留言 (0)