
記住我
The current mainstay for clinical management of solid tumors, including the determination of cancer type and staging, is predicated on the analysis of tumor specimens collected through invasive biopsy and/or surgical resection (1). Recent characterization of these specimens through next-generation genomic sequencing technologies has not only helped guide the selection of targeted therapeutics in the age of personalized medicine and precision oncology (2–4), but has also been a major driver of cancer biomarker discovery (5, 6). The collection of tumor specimens for these analyses, however, can often pose critical challenges including obtaining sufficient sample quantity (biopsy), adequately characterizing tumors which have metastasized to multiple, often unresectable locations, and repeatedly monitoring therapeutic response over time (1).
Conversely, liquid biopsies, including the collection of patient blood, saliva, or urine, are diagnostic modalities offering inherent advantages over surgically collected tumor specimens. These advantages include their minimal invasiveness in addition to the possibility of serial sampling longitudinally throughout the course of disease (1, 7). The most comprehensively evaluated liquid biopsy to date is patient peripheral blood and its liquid (plasma, serum) and cellular components. Numerous biomarkers isolated from blood specimens including circulating tumor cells (CTCs) (8, 9), tumor exosomes (10, 11), and circulating tumor DNA (ctDNA) (12, 13) have offered invaluable insight into disease processes, prognosis, and therapeutic response for a variety of solid tumors (14, 15), including pediatric malignancies such as sarcoma (16–18).
Large-scale proteomic technologies (19), capable of simultaneously characterizing hundreds to thousands of proteins in these specimens, have also gained significant traction in the field of cancer biomarker research (20). While numerous techniques have been established (21, 22), next-generation aptamer-based multiplexed proteomic technology, first published by Gold et al. in 2010, has shown extraordinary promise. These aptamer-based platforms alleviate some of the inherent limitations of previous proteomic techniques such as mass spectrometry (MS) by offering increased sample throughput, larger dynamic ranges of detection, and lower average coefficients of variation, all while necessitating minimal sample volumes (23). The basis of this technology lies in the development of chemically modified aptamers, which form complex three-dimensional matrices with robust specificity to their target proteins. This new class of aptamers, known as Slow Off-rate Modified Aptamers (SOMAmers), are an evolution of the previously described short single-stranded oligonucleotides identified by Systemic Evolution of Ligands by Exponential (SELEX) enrichment in the early 1990s (23–25).
SOMAmers and the SomaScan® platform (26, 27), developed commercially by SomaLogic, Inc. (Boulder, CO, USA), have now been used to characterize a variety of cancers, including but not limited to hepatocellular carcinoma (28), colorectal cancer (29), pancreatic cancer (30), glioma (31), lung cancer (32), oral squamous cell carcinoma (33), and ovarian cancer (34). The platform has expanded its characterization from approximately 800 proteins in 2010 to well over 7000 proteins today, offering extensive insight into nearly all biological pathways relevant to human disease (35). Due to the SomaScan’s wide ranging assessment of proteins involved in the immune system including cytokine signaling, signaling by interleukins, and immunoregulatory pathways, among others, the platform has even been used to identify circulating proteins associated with immunotherapy response in diseases such as melanoma (36). As immunotherapies begin to dominate the world of oncology, systemic assessments of the immune system, in real time, are likely critical to monitor immunotherapeutic response and better predict clinical success. To our knowledge, no study has yet utilized the SomaScan® platform for proteomic biodiscovery in osteosarcoma (OSA).
OSA is the most common primary pediatric bone malignancy (37, 38). Patients with localized disease, treated with surgical resection and neoadjuvant/adjuvant multi-drug chemotherapy (39), display five-year survival rates greater than 75% (40, 41). Unfortunately, this rate decreases to approximately 25% in those with advanced disease, most commonly in the form of metastases to the lung (42). Numerous studies have been conducted to determine biomarkers of prognostic or diagnostic value in OSA using liquid biopsies (43–47). Of utmost relevance, serum biomarkers (48) including tumor necrosis factor (TNF) (49) and other interleukins (50), vascular endothelial growth factor (VEGF) (51–53) and angiogenin (ANG) (54), macrophage migration inhibitory factor (MIF) and T-Cell Immunoglobulin and Mucin Domain-Containing Protein 3 (TIM-3) (55), as well as various chemokines including C-X-C motif chemokine ligand (CXCL)4, CXCL6, and CXCL12 (56) have shown preliminary promise as diagnostic and/or prognostic biomarkers in this disease. Additionally, analysis of plasma proteomic profiles using surface-enhanced laser desorption/ionization-time of flight (SELDI-TOF) MS identified two proteins (amyloid protein A and transthyretin) involved in the innate immune system associated with positive response to chemotherapy (57). While limited in the robustness of their analyses, these studies ultimately support that characterization of the OSA systemic proteome can offer unique insight into disease progression, therapeutic response, and prognosis in this disease.
To determine novel biomarkers associated with overall survival in OSA, we utilized the SomaScan® 7k assay to investigate the plasma proteomic profile of primary, recurrent, and metastatic OSA patients. Plasma samples, isolated from patients with confirmatory diagnosis of OSA and treated at the University of Pittsburgh, Department of Orthopaedic Surgery, were processed and analyzed for the simultaneous quantification of over 7000 circulatory proteins (Figure 1A). Following the identification of differentially expressed proteins (DEPs) between 2-year deceased and survivor patient cohorts, various analyses were then conducted to suggest their biological relevance in OSA including investigation of publicly available bulk and single cell (sc)RNA-seq datasets, further associations with overall and progression free survival in solid tumors, as well as correlations with previously published biomarkers and gene signatures (Figure 1B).
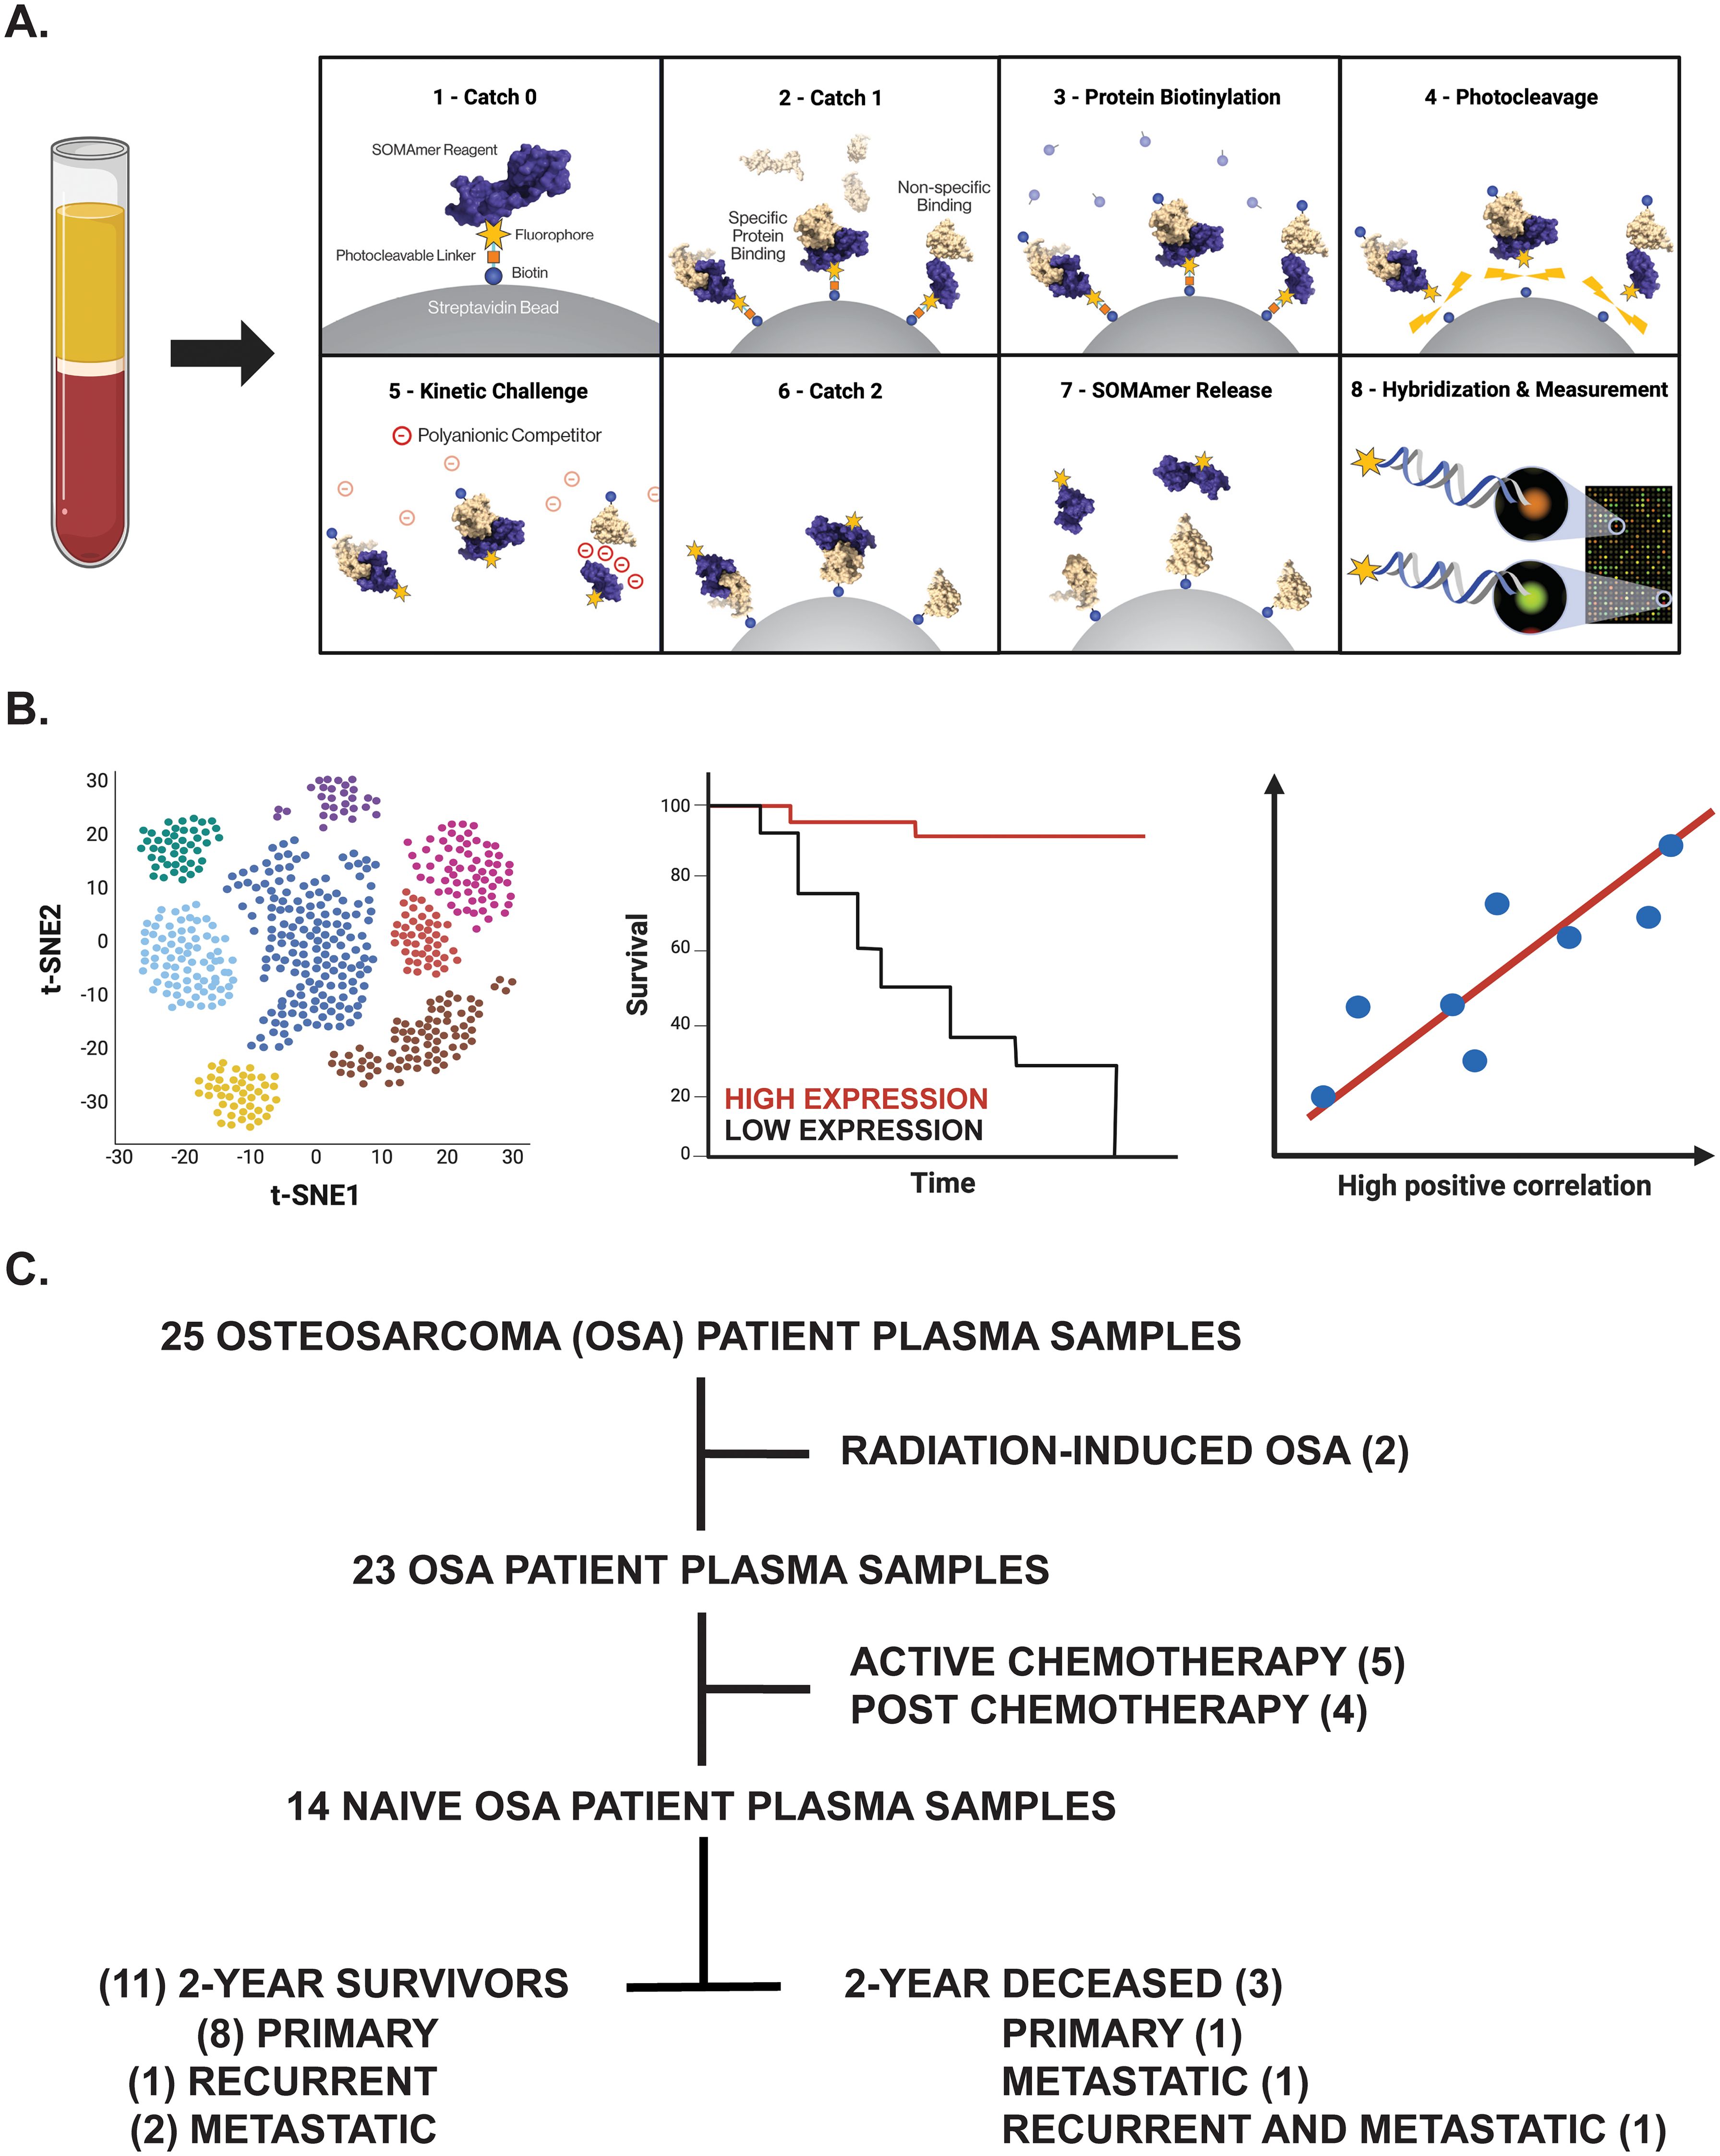
Figure 1. Overview of experimental design. (A) Proteomic investigation of OSA patient plasma samples using the SomaLogic SomaScan® 7k assay. Step-by-step process by which the SomaScan platform measures circulatory proteins (provided by SomaLogic Inc.). (B) Downstream analyses including cell identification using scRNA-seq analysis, overall survival analysis in publicly available datasets, and correlation analyses to support identified protein’s role or association in solid tumors. Figure generated using BioRender.com. (C) Tree diagram depicting those OSA patient plasma samples selected for downstream analyses in this study.
2 Materials and methods2.1 Patients, sample collection, and processingThe human subject research protocol and subject informed consent were reviewed and approved by the University of Pittsburgh Medical Center Institutional Review Board (IRB STUDY 19060152). According to IRB guidelines, informed consent was obtained from all participants (Table 1) before study entry. Peripheral blood specimens were collected from primary, recurrent, and metastatic OSA patients diagnosed from 2014-2021 via venipuncture into Cell-Free DNA BCT tubes (Cat. #218996, Streck, La Vista, NE, USA). Blood components (buffy coat, plasma) were then separated for storage following centrifugation, with time from sample collection to processing averaging 17.4 ± 3.6 hours (ranging 0.04 to 44.06 hours).

Table 1. Patient information for the 14 naive OSA patients analyzed within our proteomic biodiscovery analysis.
2.2 SomaLogic SomaScan® 7k assayProfiling of the OSA proteome was performed using the SomaScan® 7k assay, a highly multiplexed aptamer-based proteomic technology capable of determining over 7,000 protein measurements, at SomaLogic headquarters according to a previous publication (58). Briefly, frozen OSA Streck plasma samples were thawed and then buffer exchanged twice into SomaLogic Assay Buffer using Zeba 7kDa MWCO spin desalting columns (Cat. #89882, Thermo Scientific, Waltham, MA, USA) according to manufacturer’s instructions. These buffer-exchanged plasma samples (diluted to 20%, 0.5%, and 0.005%) were then placed in a 96-well plate with a mix of thousands of chemically modified aptamers called SOMAmer® Reagents. These SOMAmers®, consisting of a 5’ fluorophore, photocleavable linker, and biotin on streptavidin-coated beads, form complex three-dimensional shapes which bind to epitopes on their target protein with high affinity and specificity. Following the formation of SOMAmer-protein complexes, unbound proteins are washed away, captured proteins are labeled with biotin, and the SOMAmer-protein complexes are released by photocleavage with ultraviolet light in a buffer containing an unlabeled polyanionic competitor. The biotin-labeled SOMAmer-protein complexes are captured on a second set of streptavidin-coated beads before releasing SOMAmer reagents in a denaturing buffer. The amount of available protein epitope is read by hybridizing the SOMAmer reagents in the SomaScan Assay eluate to complementary sequences on a DNA microarray. Here, fluorescence is measured as relative fluorescence units (RFUs) and reflects overall epitope abundance (Figure 1A). The RFU readout is normalized by three non-consecutive steps including hybridization control normalization, intraplate median signal normalization, and median signal normalization to a reference and then delivered in a tab-delimited text file (.adat extension) for analysis using SomaLogic’s web-based tool known as DataDelve Statistics alongside the DataDelve Stats v1.0 User Guide. A T-test was used to compare the means of two groups (such as 2-year deceased and survivor cohorts). Considering the exploratory nature of our study and limited OSA patient samples analyzed, differentially expressed proteins (DEPs) between comparative groups were identified as having a Log2FC > 0.585 or < -0.585 and P-value < 0.05. Median normal patient plasma RFU measurements (provided by SomaLogic) for both APO- and HOLO-transcobalamin-II (TCN2) are graphed on the associated box plot and are representative of a healthy, control patient population derived from previous publication (58). Considering these median values were determined using normal patient ethylenediaminetetraacetic acid (EDTA)-plasma samples that had been centrifuged and stored 2-10 hours post-blood collection (as opposed to the Streck-collected specimens analyzed here), they should only serve as a general guideline to the major findings from our analyses. A Volcano plot depicting those DEPs between comparative groups was generated using GraphPad Prism 10 (GraphPad Software, Boston, MA, USA).
2.3 Reactome pathway analysisA pathway analysis of those DEPs between 2-year deceased and survivor cohorts (all OSA and advanced OSA cohorts) was conducted using the Reactome Pathway Analysis Tool (https://reactome.org/PathwayBrowser/, version 87) according to the Reactome User Guide (Docs – Analysis Tools) and previous publications (59–61). Briefly, all proteins with Log2FC > 0.585 or < -0.585 and P-value < 0.05 were inputted into the identifier list alongside their associated Log2FC. For consistency, proteins identified by the same SOMAmer, each with a unique sequencing ID, however, sometimes detecting multiple proteins [example seq.3714-49 quantifying both Creatine kinase M-type and Creatine kinase B-type heterodimer (P12277|P06732 or CKB|CKM)], were inputted in the identifier list multiple times with the same corresponding Log2FC. Following data input and use of default analysis settings (projection to human without interactors), the pathway analysis results (.csv) and analysis report (pdf) were exported. A genome-wide overview plot is used to highlight the Reactome pathways over- (blue) or underrepresented (yellow) in the input dataset, with light grey signifying non-significant pathways. Significant Reactome pathways for the given data input were identified as having an FDR < 0.05.
2.4 Survival Genie overall survival and CIBERSORTx TIL correlation analysisThe Survival Genie web-interface (https://bhasinlab.bmi.emory.edu/SurvivalGenie/) was used for both overall survival and CIBERSORTx tumor-infiltrating lymphocyte (TIL) analyses according to the user guide and a previous publication (62). Briefly, single gene analyses [transcobalamin-II (TCN2), alpha 2-HS glycoprotein (AHSG)] were conducted using the National Cancer Institute (NCI) Therapeutically Applicable Research to Generate Effective Treatments-Osteosarcoma (TARGET-OS) and The Cancer Genome Atlas (TCGA)-Sarcoma (SARC) databases. Here, single gene normalized expression [fragments per kilobase of transcript per million mapped reads (FPKM)] from primary tumors is associated with overall survival through Cutp estimated martingale residuals (63) and patient stratification into low and high expressing groups using the survMisc package (64). Resulting Kaplan-Meier (KM) survival curves with high (red) and low (blue) group stratification are compared using the log-rank test, with log-rank P-value < 0.05 considered statistically significant (64). The provided Forest plot details the association between the high and low groups [stratified by cut point (CP)] based on the Cox Proportional Hazards regression model (survMisc package). Hazard ratio (HR) with 95% confidence interval as well as the associated Wald-test (HR) and log-rank (LR) P-values are reported (64). The relative fraction of TILs was estimated using the tumor-infiltrating immune cell type matrix LM22 gene signature from bulk tumor FPKM gene expression data and the CIBERSORTx deconvolution method (65). A Pearson correlation matrix of deconvoluted immune cell RNA-seq gene expression data and our genes of interest are reported. Shape (square or circle) denotes significance while color denotes positive (red) or negative (blue) correlation with the genes of interest (TCN2, AHSG).
2.5 TIGER scRNA-seq analysisThe Tumor Immunotherapy Gene Expression Resource (TIGER) portal (http://tiger.canceromics.org/#/) was used to investigate the target genes of interest [TCN2, transcobalamin receptor (CD320)] according to the user guide and a previous publication (66). Briefly, after inputting the genes of interest, the “Single-cell Immunity” tab was used to investigate gene expression across various scRNA-seq datasets of the TIGER database. Here, the Cell Type Marker (Log2FC) diagram represents differential expression of various clusters and subclusters in each scRNA-seq dataset of the TIGER database. These cells, organized by cancer type, dataset ID, main lineage, cell type, and Log2FC, were then sorted for highest Log2FC expression of the target genes. The top 20 clusters with increased gene expression were reported. After identifying the various cell types (myeloid, plasma, and B cells) and cancers [non-small cell lung cancer (NSCLC) – dataset NSCLC (67), NSCLC1 (68), NSCLC5 (69), NSCLC6 (70)], skin cutaneous melanoma (SKCM) – dataset SKCM1 (71)] with increased expression of the target gene(s), a subsequent cell-cell communication analysis was performed. Briefly, cell-cell communication in the NSCLC (67) and SKCM1 (71) datasets was investigated due to expression of both genes of interest (TCN2, CD320) across different cell types. Following navigation to the “Single-cell Immunity” tab and selection of the NSCLC dataset, a cell-cell communication analysis was conducted for the Mye_C1_CCL18 cluster (with greatest expression of TCN2) and the B_C10_MZB1 cluster (with greatest expression of CD320). The resulting heatmap displays the expression of all receptor-ligand interactions between any cell type of interest and its location [example – tumor, peritumoral (if applicable)]. The top three cell-cell interactions with the greatest total effect score are reported. Upon toggling the effect score between cell types of interest (example Mye_C1_CCL18 | B_C10_MZB1), the gene expression of the corresponding receptor-ligand interactions between those cells is displayed and sorted from greatest to least expression. For the top three cell-cell interactions, the top 20 receptor-ligand gene interactions (present intratumorally) and their expression were reported. A similar analysis was conducted for both the Mye_C4_C1QA (with greatest expression of TCN2) and the B_C2_IGHG1 (with greatest expression of CD320) of the SKCM1 dataset without responder/non-responder stratification (71).
2.6 scRNA-seq analysis of OSA tumor specimensRaw OSA scRNA-seq data of GSE162454 (naive primary tumors) and GSE152048 (chemotherapy treated primary, recurrent, and metastatic tumors) were downloaded from the Gene Expression Omnibus (GEO) under their accession number. The FASTQ files were mapped to the GRCh38/hg38 reference genome using Cell Ranger (10X Genomics, Pleasanton, CA, USA, version 6.1.2). Individual cloupe files for each patient sample were then analyzed using the Loupe Browser (10X Genomics, version 7.0.1) according to the 10X Genomics Support guidelines. Briefly, each cloupe file was reanalyzed to filter barcodes through thresholds by Unique Molecular Identifiers (UMIs), threshold by Features, and mitochondrial UMIs. Considering the sheer heterogeneity of the processed samples, this filtering was performed on a sample-to-sample basis. On average, for the GSE162454 dataset, each sample was filtered by UMIs with a min = 666.67 ± 105.41 and max = 74166.67 ± 16654.16, threshold by Features with a min = 500.00 ± 0.00 and max = 9500.00 ± 500.00, and mitochondrial UMIs (%) with a min = 0.00 ± 0.00% and max = 31.33 ± 0.88%. This filtering resulted in approximately 10.3 ± 1.1% of barcodes removed from each sample (range 7.4-14.7%), in accordance with guidelines. On average, for the GSE152048 dataset, each sample was filtered by UMIs with a min = 502.18 ± 1.00 and max = 35000.00 ± 5680.91, threshold by Features with a min = 500.00 ± 0.00 and max = 5681.82 ± 527.74, and mitochondrial UMIs (%) with a min = 0.00 ± 0.00% and max = 20.91 ± 1.63%. This filtering resulted in approximately 13.0 ± 1.5% of barcodes removed from each sample (range 4.6-20.7%), again, in accordance with guidelines. Following barcode filtering, clusters were identified in each sample of both the GSE162454 and GSE152048 datasets according to canonical marker expression of the major cell types identified by Liu et al. in a previous publication including Myeloid cells 1/2 (LYZ, CD68), NK/T cells (CD2, CD3D, CD3E, CD3G, GNLY, NKG7, KLRD1, KLRB1), CAFS (COL1A1, ACTA2, VIM), Plasmocytes (IGHG1, MZB1), Osteoblastic OSA cells (ALPL, RUNX2, IBSP), Osteoclasts (ACP5, CTSK), Endothelial cells (EGFL7, PLVAP), and B cells (MS4A1, CD79A) (72). The expression of TCN2 and CD320 was then assessed across all major cellular clusters via visual inspection of t-distributed Stochastic Neighbor Embedding (t-SNE) plots before further downstream analysis. The expression of TCN2 and CD320 on Myeloid cells and Plasmocytes/B cells clusters, respectively, was then investigated. For quantification of TCN2+ Myeloid cells and CD320+ Plasmocytes and B cells, the “Feature Min” function of the Loupe Browser (displaying the minimum expression value of the features in each cluster’s associated feature set when all features are expressed) was utilized. Here, for consistency across patient samples, only those cells expressing all features within a designated feature set (example: TCN2+ Myeloid cells with feature set LYZ, CD68, and TCN2) were quantified. Representative t-SNE plots with log normalized expression of the gene or feature gene set of interest are presented. In addition to total number of cells, the percent (%) of total cells and percent (%) of TCN2+ Myeloid cells (relative to all Myeloid cells) were calculated by dividing the cell population of interest by total number of filtered cells (barcodes) or by total number of Myeloid cells, respectively. Bar graphs quantifying abundance of various cell types across OSA specimens analyzed were generated using GraphPad Prism 10.
2.7 SomaLogic proteomic correlation analysesVarious correlations between plasma APO-TCN2 and previously described soluble markers of plasma cell maintenance (73) and B cell activation (74) [Interleukin (IL)-6, IL-6 receptor(R)a, IL-6Rb, CXCL12, TNF, IL2RA, TNF Superfamily Member 13b (TNFSF13B) or B-cell activating factor (BAFF), TNF Receptor Superfamily Member 13B (TNFRSF13B) or Transmembrane Activator and CAML Interactor (TACI), TNF Receptor Superfamily Member 17 (TNFRSF17) or B-cell maturation antigen (BCMA)], proteins critical for TLS formation [lymphotoxin alpha 1 beta 2 (LTa1b2), Fc Receptor Like 5 (FCRL5), Selectin L (SELL), TNF Superfamily Member 14(TNFSF14)] (75), circulating immunoglobulin (Ig) levels (IgA, IgD, IgE, IgM, J chain, and IgG), as well as proteins of the 12-chemokine (12-CK) tertiary lymphoid structure (TLS) signature (75) [exception – CCL4 (not measured)] were conducted. Briefly, using GraphPad Prism 10, scatter plots representing all naive OSA patient samples (n = 14) with APO-TCN2 (RFU) on the x-axis and values of various other circulatory proteins (RFU) on the y-axis were constructed. A Spearman correlation analysis was conducted using GraphPad Prism 10 with the correlation coefficient (R) and associated P-value (P) presented on each scatter plot.
2.8 KM Plotter Immunotherapy survival and correlation analysisUsing the Kaplan-Meier (KM) Plotter Immunotherapy online database (https://kmplot.com/analysis/), both TCN2 and CD320 were evaluated for overall and progression free survival in solid tumors (esophageal, gastric, head and neck, melanoma, lung, and urothelial cancer) treated with various immunotherapies (76). Specimens from all solid tumors, collected pre-treatment, irrespective of immunotherapy target [anti-programmed death cell protein 1 (PD-1), anti-programmed death ligand 1 (PD-L1), and anti-cytotoxic t-lymphocyte associated protein 4 (CTLA-4)], were included in both overall and progression free survival analysis using default KM Plotter settings (auto selection of best cutoff based on the calculation of all upper and lower quartiles with selection of the best performing threshold). For each gene of interest, a resulting KM plot was constructed with a reported HR, log-rank P-value, and FDR, with the y-axis representing probability of survival and the x-axis representing time (months). The total number of patients at risk for each time point is also reported. Similarly, an overall survival analysis was conducted for all chemokines of the 12-CK signature (75) using the same analysis parameters. Additionally, Spearman correlations between both TCN2 and CD320 with all chemokines of the 12-CK TLS signature including C-C Motif Chemokine Ligand (CCL)2, CCL3, CCL4, CCL5, CCL8, CCL18, CCL19, CCL21, CXCL9, CXCL10, CXCL11, CXCL13 were also conducted. Due to an inherent limitation of the KM Plotter Immunotherapy database, a maximum of three genes of the 12-CK signature (in addition to either TCN2 or CD320) were included within the same correlation analysis. Spearman correlation coefficients and P-values (* = P < 0.05, ** = P < 0.01, *** = P < 0.001, **** = P < 0.0001) were reported for all four-gene correlation matrices.
2.9 TCGA 12-CK signature correlation analysisUsing the Gene Expression Profiling Interactive Analysis 2 (GEPIA2) web server (http://gepia2.cancer-pku.cn/#index) (77), a multi-gene Spearman correlation analysis between either TCN2 or CD320 and the 12-CK TLS signature (75) was also performed. Two separate analyses using only the TCGA-SARC gene expression dataset or all tumor types of the TCGA were conducted. For each correlation analysis, the log2 of the transcript count per million [log2(TPM)] of the gene of interest (TCN2 or CD320) was plotted on the x-axis while the log2(TPM) of the 12-CK gene signature is plotted on the y-axis. Importantly, while a log scale is used for graphical representation, the Spearman correlation is calculated on a non-log scale. The resulting Spearman correlation coefficients (R) and P-values are reported.
3 Results3.1 Study design and patient stratificationUsing the SomaLogic SomaScan® 7k assay, the plasma proteomic profile of primary, recurrent, and metastatic OSA patients was investigated. In total, 25 OSA patient plasma samples at various stages of disease and treatment status were processed in this analysis. Considering our group’s inherent interest in tumor immunology, two radiation-induced OSA patient samples, five active chemotherapy patient samples, and four post-chemotherapy patient samples were excluded from downstream analysis to mitigate confounding influences to the OSA proteome. The remaining samples, representing 14 naive OSA patients collected at diagnosis (before standard of care chemotherapeutic and/or surgery regimens), were then stratified into 2-year deceased and survivor all comers cohorts (Figure 1C). Patient information including sex, vital status, treatment, disease, and 2-year survival status, in addition to Streck-plasma spin down time (hours) from blood collection to plasma isolation and frozen storage, are reported (Table 1).
3.2 Proteomic assessment of naive OSA patients reveals DEPs associated with 2-year survival statusAll experimental patient plasma samples processed at SomaLogic’s Boulder, CO facility passed standardized quality assessment and control (Supplementary File 1 – Supplementary Figure 1). The plasma proteomic profiles of the 2-year deceased (n = 3) and survivor (n = 11) patients from an all comers OSA cohort (n = 14) were then compared (Supplementary File 2). Importantly, a total of 24 human DEPs were identified from this analysis, including 10 significantly upregulated and 14 significantly downregulated in the 2-year survivor cohort (Figure 2A and Table 2). These 24 DEPs were then inputted into the Reactome Pathway Analysis tool. The Reactome genome-wide overview map highlighted overrepresentation of these 24 DEPs in various pathways involved in the Immune System, Signal Transduction, and Metabolism (Supplementary File 1 – Supplementary Figure 2). The most significant pathways (FDR < 0.05) and their enriched entities included those associated with FOXO-mediated transcription [catalase (CAT), resistin (RETN)], MAPK activation (IL-6R), Interleukin-6 signaling (IL-6R), and creatine metabolism [creatine kinase (CK)M, CKB] (Figure 2B).
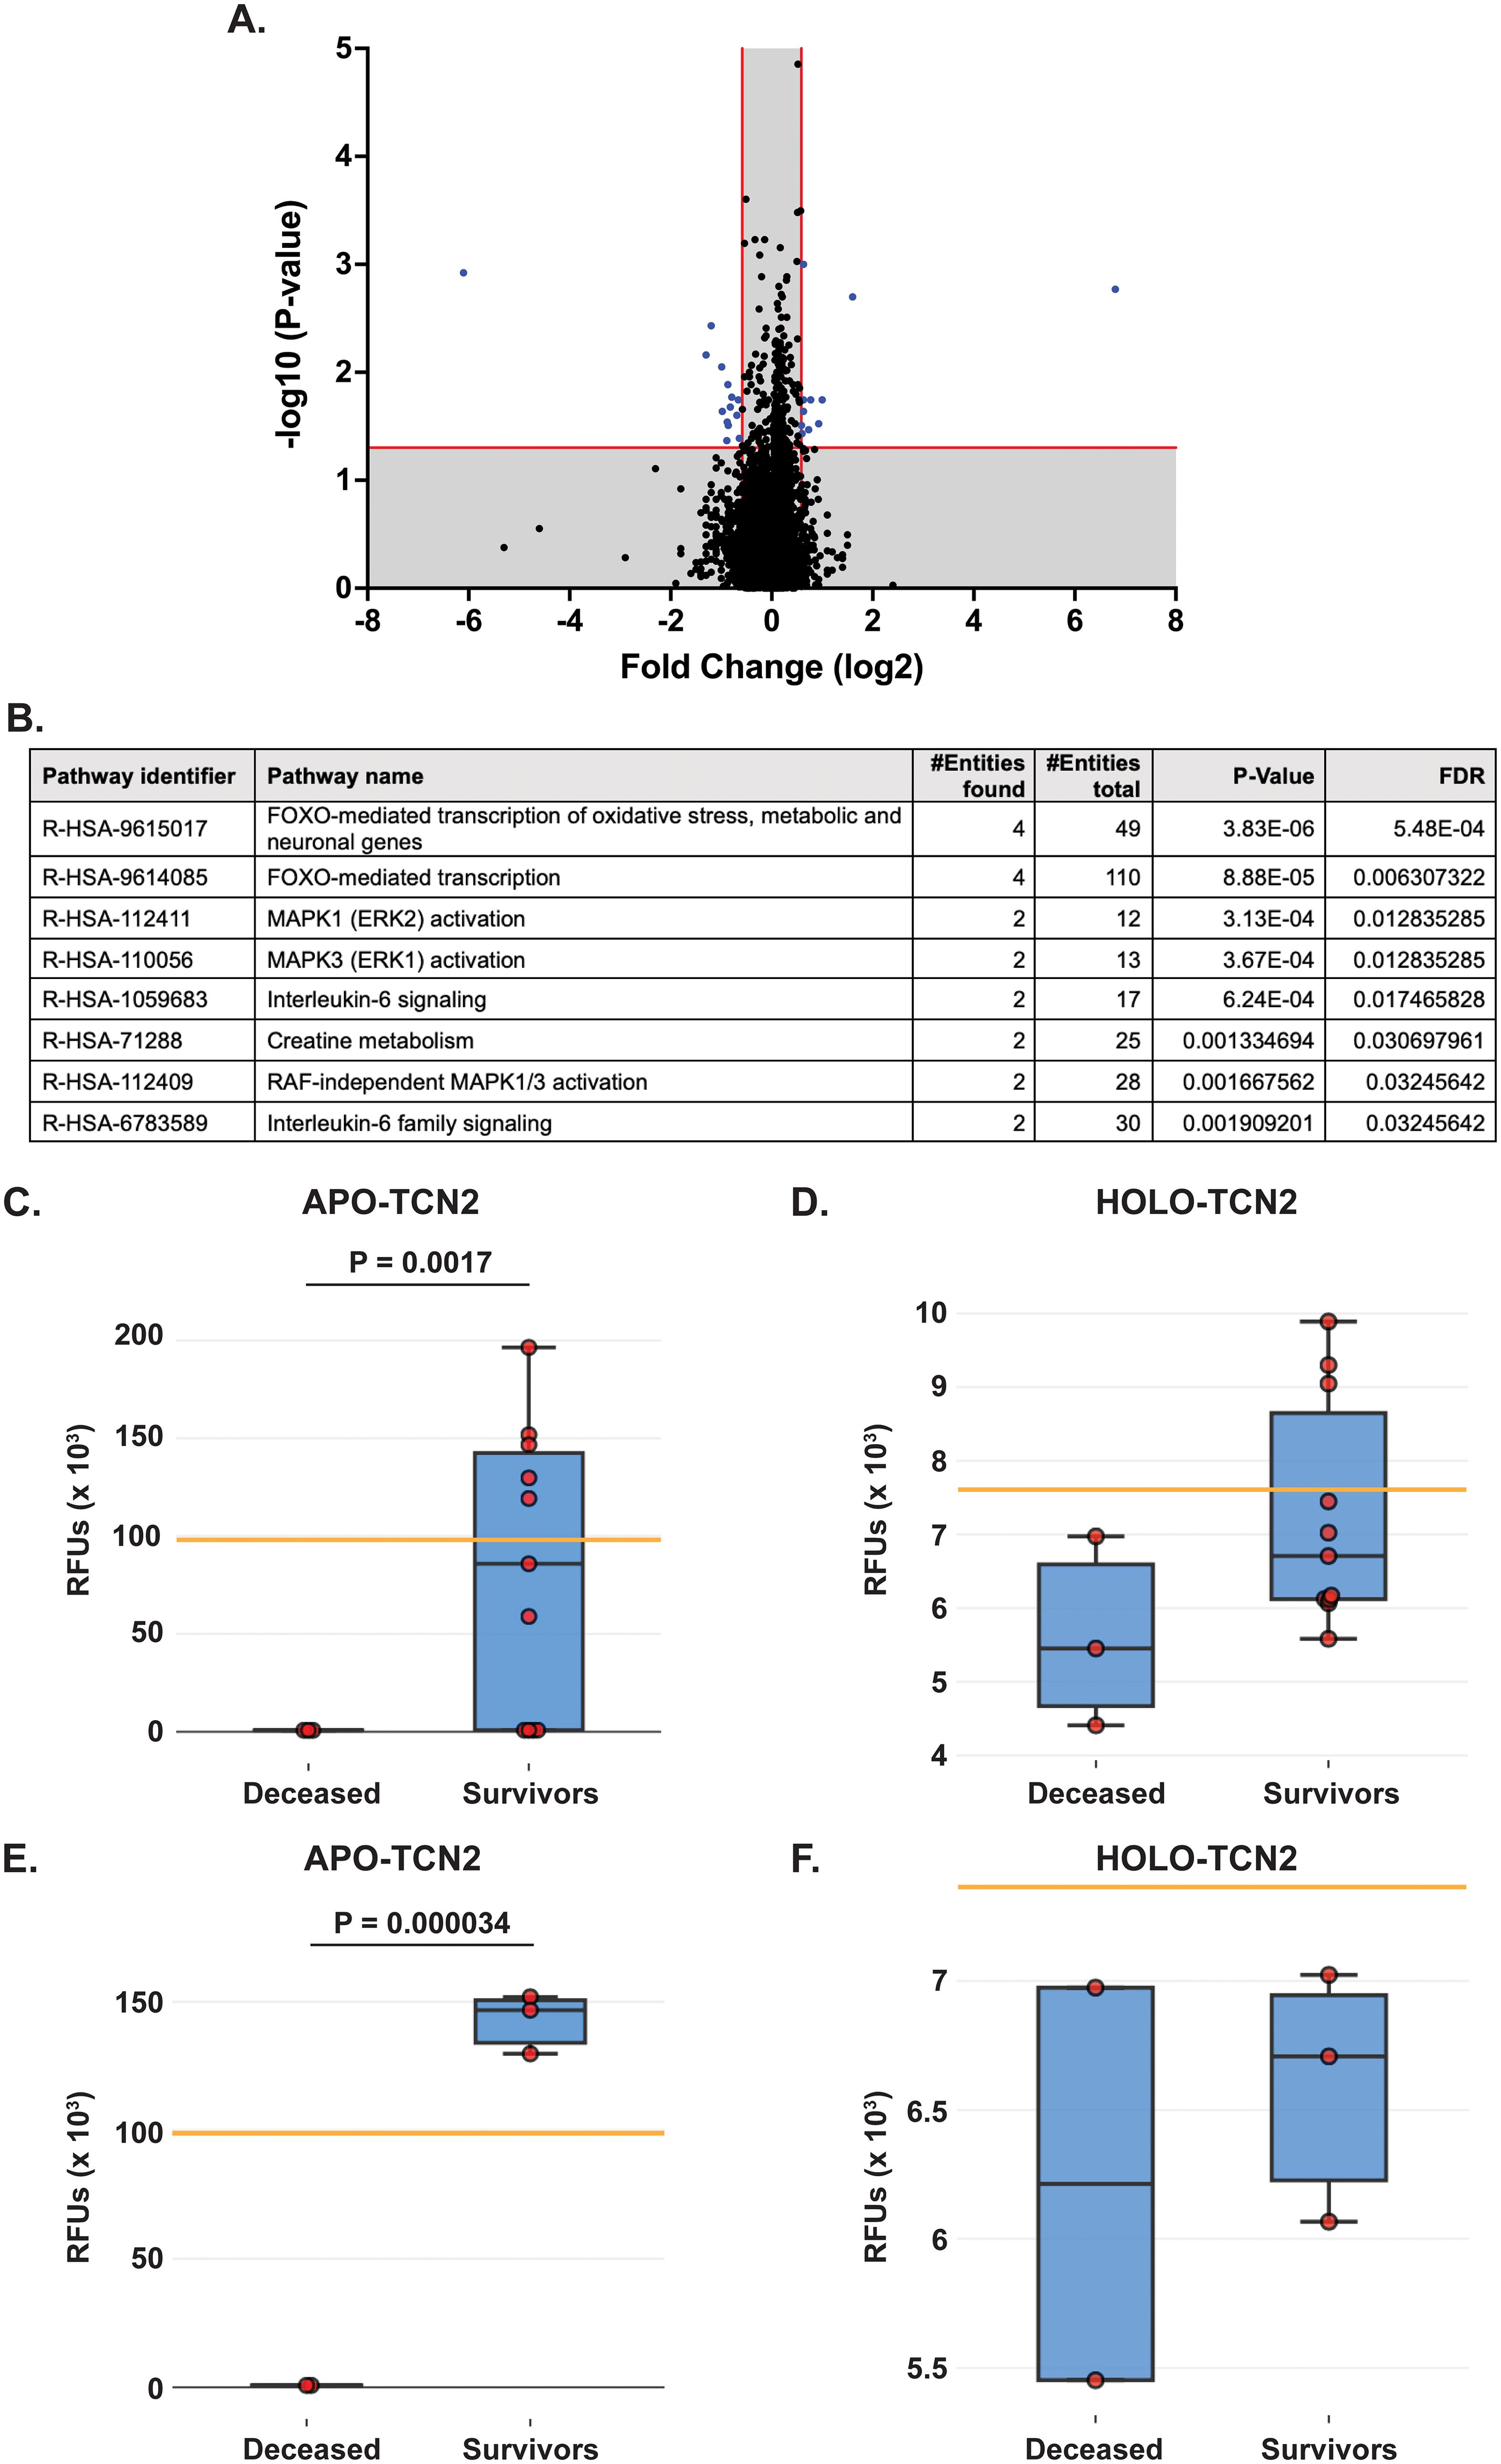
Figure 2. Proteomic analysis of naive OSA patients, stratified by 2-year survival status. (A) Volcano plot depicting those differentially expressed proteins (DEPs – blue) with a Log2FC > 0.585 or < -0.585 and P-value < 0.05. (B) Reactome analysis identifies those pathways associated with 2-year survival in OSA. Significant pathways include those with multiple entities and FDR < 0.05. Box plot depicting APO-TCN2 [seq.15560.52] (C) and HOLO-TCN2 [seq.5584.21] (D) levels in all naive OSA patients (n = 14) stratified by 2-year survival status, with n = 3 deceased and n = 11 survivors. Box plot depicting APO-TCN2 [seq.15560.52] (E) and HOLO-TCN2 [seq.5584.21] (F) levels in naive OSA patients with advanced disease (n = 5) stratified by 2-year survival status, with n = 2 deceased and n = 3 survivors. Each dot of the box plot is representative of an individual OSA patient. Y-axis represents the relative fluorescence units (RFUs) in thousands. Significant P-values (t-test) are presented for each comparison. Median values from assessment of plasma samples in a normal, healthy patient population (provided by SomaLogic, Inc.) are indicated by orange bar.
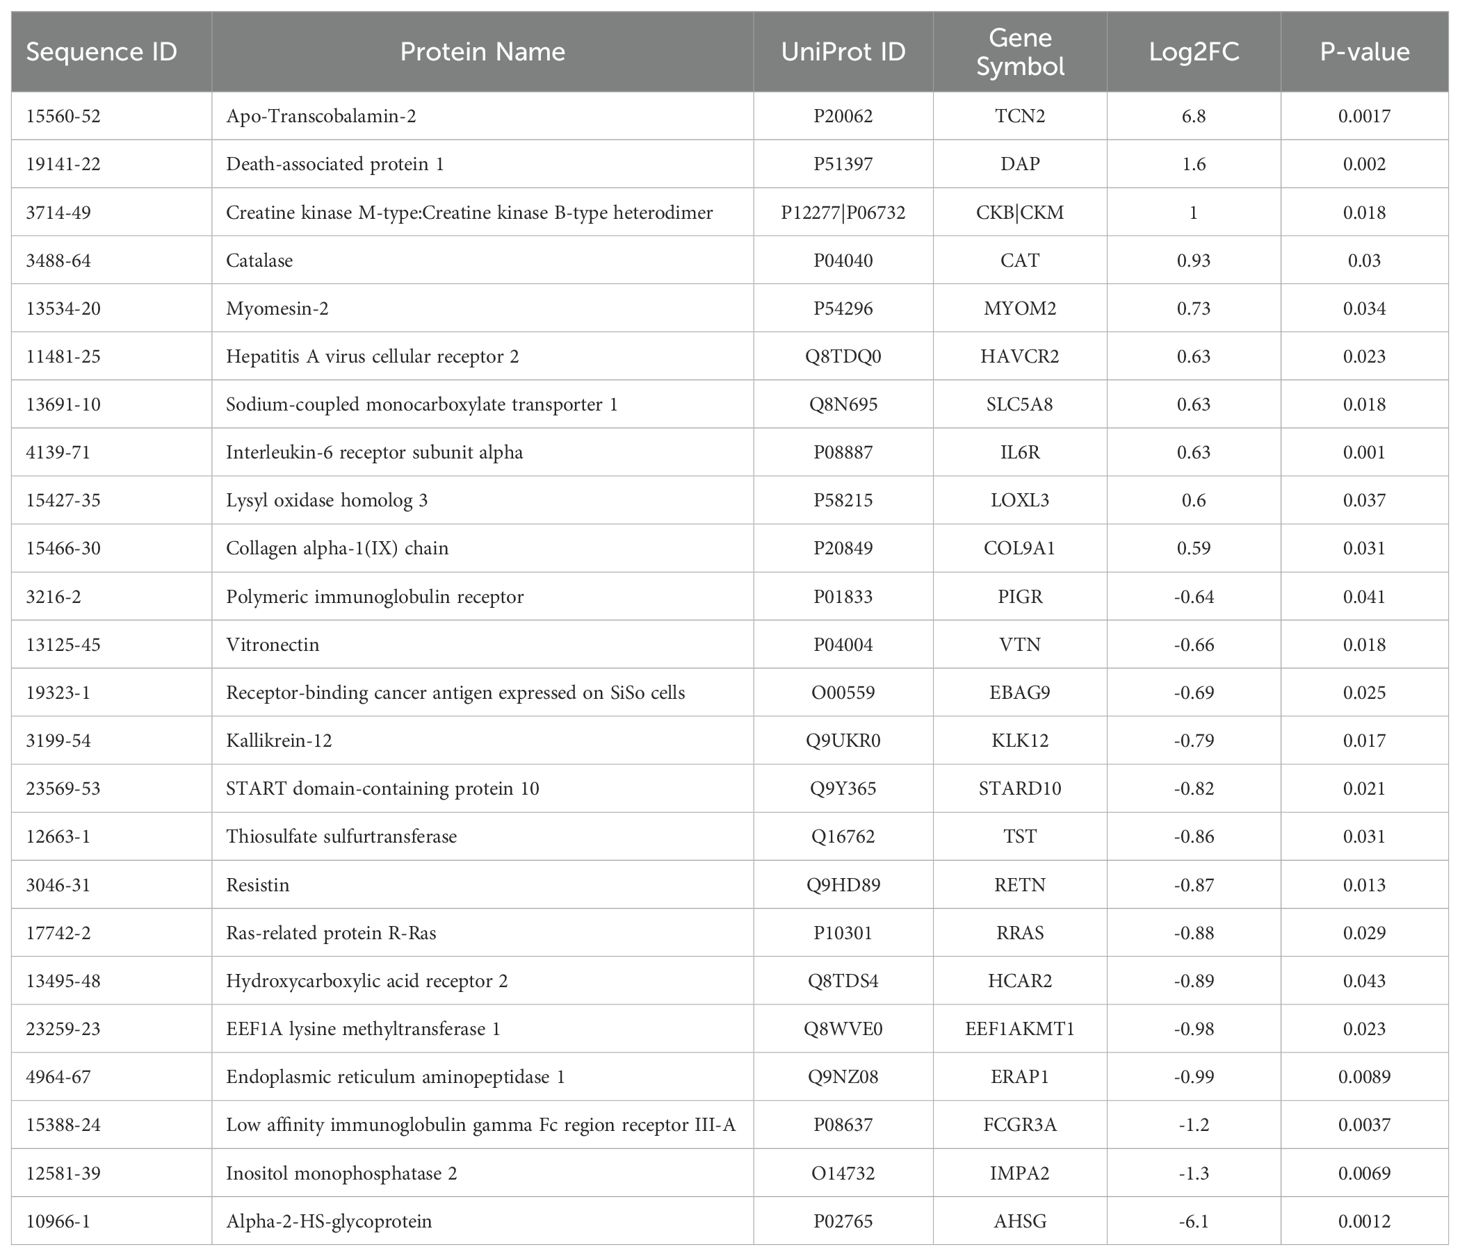
Table 2. Differentially expressed proteins (DEPs) for the naive all OS 2-year survival comparison.
Of the 24 individual DEPs, APO-TCN2 was the most significantly (P = 0.0017) upregulated protein associated with 2-year survival, reporting a Log2FC = 6.8. For n = 5 of total 11 patients in the 2-year survivor cohort, APO-TCN2 levels vastly exceeded median normal patient plasma RFU measurements (provided by SomaLogic) (58), with an additional two patients reporting well above minimal detectable levels. This finding contrasts with all three deceased patients, which measured near minimal detectable levels (Figure 2C). Interestingly, while the vitamin-B12 unbound form of Transcobalmin-2 (APO-TCN2) differed vastly between 2-year deceased and survivor cohorts, no difference in the vitamin-B12 bound form (HOLO-TCN2) was measured (Figure 2D). Importantly, the lack of measurable differences in HOLO-TCN2 levels suggests that these OSA patients, likely, do not have a genetic TCN2 alteration or abnormality, as previously reported in various case reports (78–81). Of note, a significant (P = 0.0012) decrease in Alpha-2-HS-glycoprotein (AHSG) was also associated with 2-year survival status, reporting a log2FC = -6.1 (Table 2). Furthermore, a secondary analysis comparing the proteome of 2-year deceased (n = 2) and survivors (n = 3) of the Advanced Disease sub-cohort (n = 5) further supported these findings. A significant (P = 0.000034) increase in plasma APO-TCN2 (Figure 2E), the most differentially upregulated protein in 2-year survivors, and no difference in HOLO-TCN2 levels (Figure 2F), was again associated with 2-year survival status. Similarly, AHSG levels were significantly (P = 0.026) reduced in the 2-year survival cohort (Supplementary File 3). Overall, a comparative proteomic analysis of OSA patient peripheral plasma identified 24 DEPs associated with 2-year survival status. Of those proteins, both APO-TCN2 and AHSG measured vastly increased or decreased levels in the survivor cohort, respectively. To further elucidate both proteins’ relevance in OSA and other solid tumors, publicly available bulk and scRNA-seq tumor datasets were then examined.
3.3 Survival Genie analysis reveals association of elevated TCN2 with overall survival in sarcomaThe Survival Genie web-based platform was then used to associate expression of TCN2 and AHSG with overall survival in publicly available OSA (TARGET-OS) and sarcoma (TCGA-SARC) bulk tumor RNA-sequencing datasets (62). To begin, evaluation of TCN2 expression in the TARGET-OS database identified 47 patients with low and 39 patients with high TCN2 expression in OSA primary tumors. Using CIBERSORTx (65), a significant (P ≤ 0.05) positive correlation between TCN2 expression and T.cells.CD8, T.cells.follicular.helper, Macrophages.M1, T.cells.gamma.delta, T.cells.regulatory.Tregs, and Macrophages.M2 gene signatures was revealed. Additionally, a significant (P ≤ 0.05) negative correlation between TCN2 expression and Macrophages.M0, T.cells.CD4.naive, and NK.cells.resting gene signatures was also apparent. Importantly, Kaplan-Meier survival curve analysis associated an increase in intratumoral TCN2 expression with better overall survival (log-rank P= 0.00033), with a reported HR = 0.22 (0.089 – 0.54) (Figure 3A). Considering a shared sarcomatous background, our group expanded the analysis to assess TCN2 gene expression in the larger TCGA-SARC dataset to provide rigor and support to the experimental findings uncovered in TARGET-OS. Analysis of the TCGA-SARC dataset identified 177 patients with low and 82 patients with high expression of TCN2 in sarcoma primary tumors. Using CIBERSORTx (65), a significant (P ≤ 0.05) positive correlation between TCN2 expression and Macrophages.M2, T.cells.CD8, T.cells.CD4.memory.activated, and Macrophages.M1 was identified. Additionally, a significant (P ≤ 0.05) negative correlation between TCN2 expression and Macrophages.M0, T.cells.CD4.memory.resting, Eosinophils, and NK.cells.activated gene signatures was also apparent. Importantly, Kaplan-Meier curve survival analysis again associated an increase in TCN2 expression with better overall survival (log-rank P = 0.0047), with a reported HR = 0.5 (0.31 – 0.82) (Figure 3B). These results suggest that increased intratumoral TCN2 is associated with an activated immune signature and better overall survival. While a similar analysis revealed that low AHSG expression was associated with better overall survival in the TARGET-OS dataset (corroborating our proteomic findings), this trend was not apparent in the TCGA-SARC analysis, and neither finding was statistically significant. Therefore, AHSG was excluded from further downstream analysis (Supplementary File 1 – Supplementary Figure 3). Overall, Kaplan-Meier survival curve analysis associated elevated TCN2 expression with significantly improved outcomes in both the TARGET-OS and TCGA-SARC datasets. Importantly, the association of increased intratumoral TCN2 expression with better overall survival correlated with our previous plasma proteomics findings (Figures 2B, D). These results ultimately support both peripheral blood plasma APO-TCN2 and intratumoral TCN2 gene expression as possible biomarkers of overall survival in this disease.
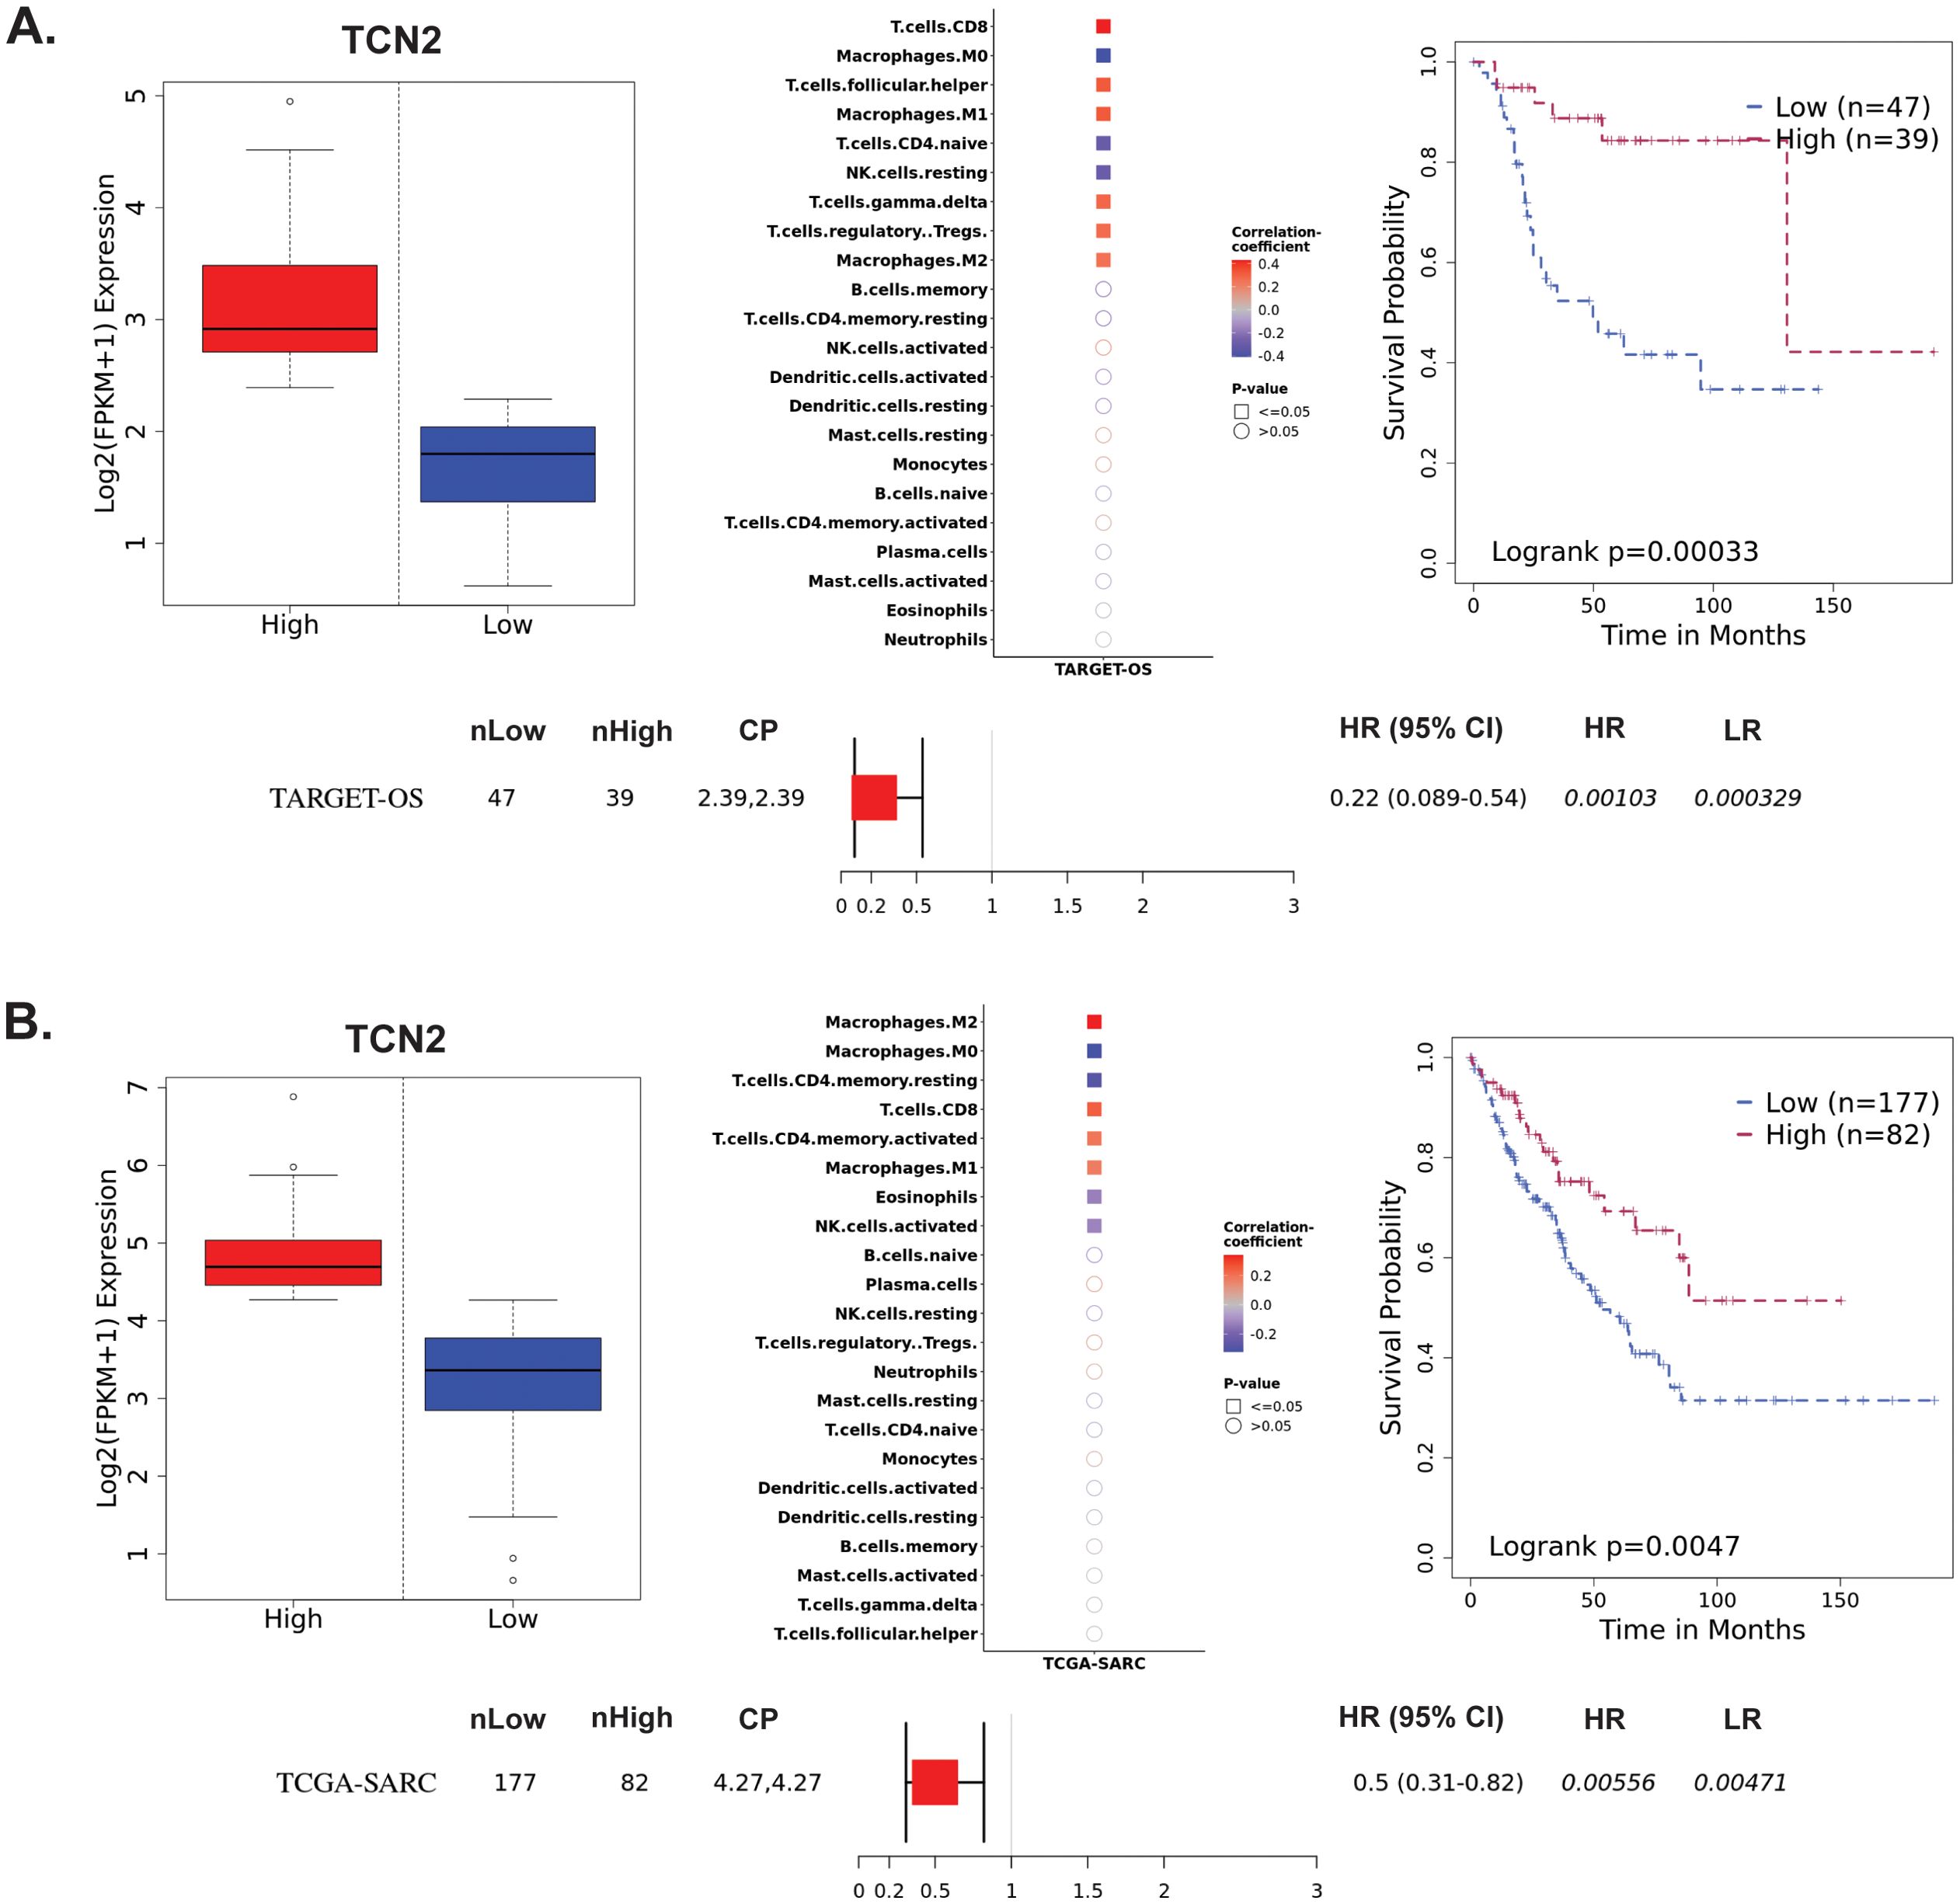
Figure 3. TARGET-OS and TCGA-SARC survival analysis supports TCN2 as a marker of better overall survival. Analysis of TCN2 in TARGET-OS (A) and TCGA-SARC (B) databases using Survival Genie web-based platform. Box plots representing TCN2 FPKM normalized expression in primary tumors with stratification into low and high expressing groups. The relative fraction of TILs was estimated using the tumor-infiltrating immune cell type matrix LM22 gene signature and CIBERSORTx deconvolution. Pearson correlation matrix of deconvoluted immune cell RNA-seq gene expression data and TCN2, with shape (square or circle) denoting significance and color denoting positive (red) or negative (blue) correlation with TCN2. Kaplan-Meier (KM) survival curves with high (red) and low (blue) group stratification are compared using the log-rank test, with log-rank P-value < 0.05 considered statistically significant. Forest plot details the association between the high and low groups [stratified by cut point (CP)] based on the Cox Proportional Hazards regression model. nLow and nHigh represent the number of patients in low and high expressing groups, respectively. Hazard ratio (HR) with 95% confidence interval as well as the associated Wald-test (HR) and log-rank (LR) P-values are reported.
3.4 TIGER reveals expression patterns of TCN2 in solid tumorsThe TIGER portal was then used to investigate the expression of TCN2 across identified cellular clusters of various solid tumor scRNA-seq datasets (66). While previous analyses of bulk transcriptomic data through CIBERSORTx deconvolution had suggested the likely cellular source for TCN2 gene expression in sarcomatous tumors, our group sought to determine which cells differentially expressed TCN2 (for a variety of tumor types) using a method that provides single cell resolution to the complex and heterogenous tumor microenvironment (TME). Numerous cellular clusters across many solid tumors revealed differential expression of TCN2 including non-small cell lung cancer (NSCLC), intrahepatic cholangiocarcinoma (ICC), breast cancer (BC), nasopharyngeal carcinoma (NPC), and skin cutaneous melanoma (SKCM), among others (Figure 4A). The top 20 cellular clusters with the greatest increase in TCN2 expression were reported, highlighting apparent increases for B cell, Endothelial, and Myeloid cellular clusters, particularly in both NSCLC and SKCM datasets (Table 3). To visualize these expression changes, subsequent analysis of Uniform Manifold Approximation and Projections (UMAPs) and gene expression boxplots for the NSCLC dataset (67) confirmed isolated increases in TCN2 expression on both Myeloid and Endothelial cellular clusters (Figures 4B, C). Subcluster analysis of the Myeloid cells revealed near ubiquitous expression of TCN2 across myeloid populations, with the greatest increases apparent for the Mye_C1_CCL18 and Mye_C6_CCL18 subclusters (Figures 4D, E). Further visualization of the NSCLC6 (70) dataset supported increased TCN2 expression on Endothelial, Plasma, AT2 Epithelial, and Myeloid cell populations (Figures 4F, G). Additional subcluster analysis of B cells revealed increased expression across B_C3_JCHAIN, B_C1_MZB1, and B_C7_MZB1 cellular clusters (Figures 4H, I), in accordance with the findings highlighted in Table 3. Similar results were also apparent for the SKCM1 dataset (71), which revealed increased TCN2 expression on all Myeloid cells, various Myeloid cell subclusters including Mye_C4_C1QA, as well as the B_C2_IGHG1 B cell subcluster (Supplementary File 1 – Supplementary Figure 4). Overall, these data corroborated our Survival Genie CIBERSORTx data and previous literature (82) which suggested that TCN2 is mainly expressed (in immune cells) on Myeloid populations.
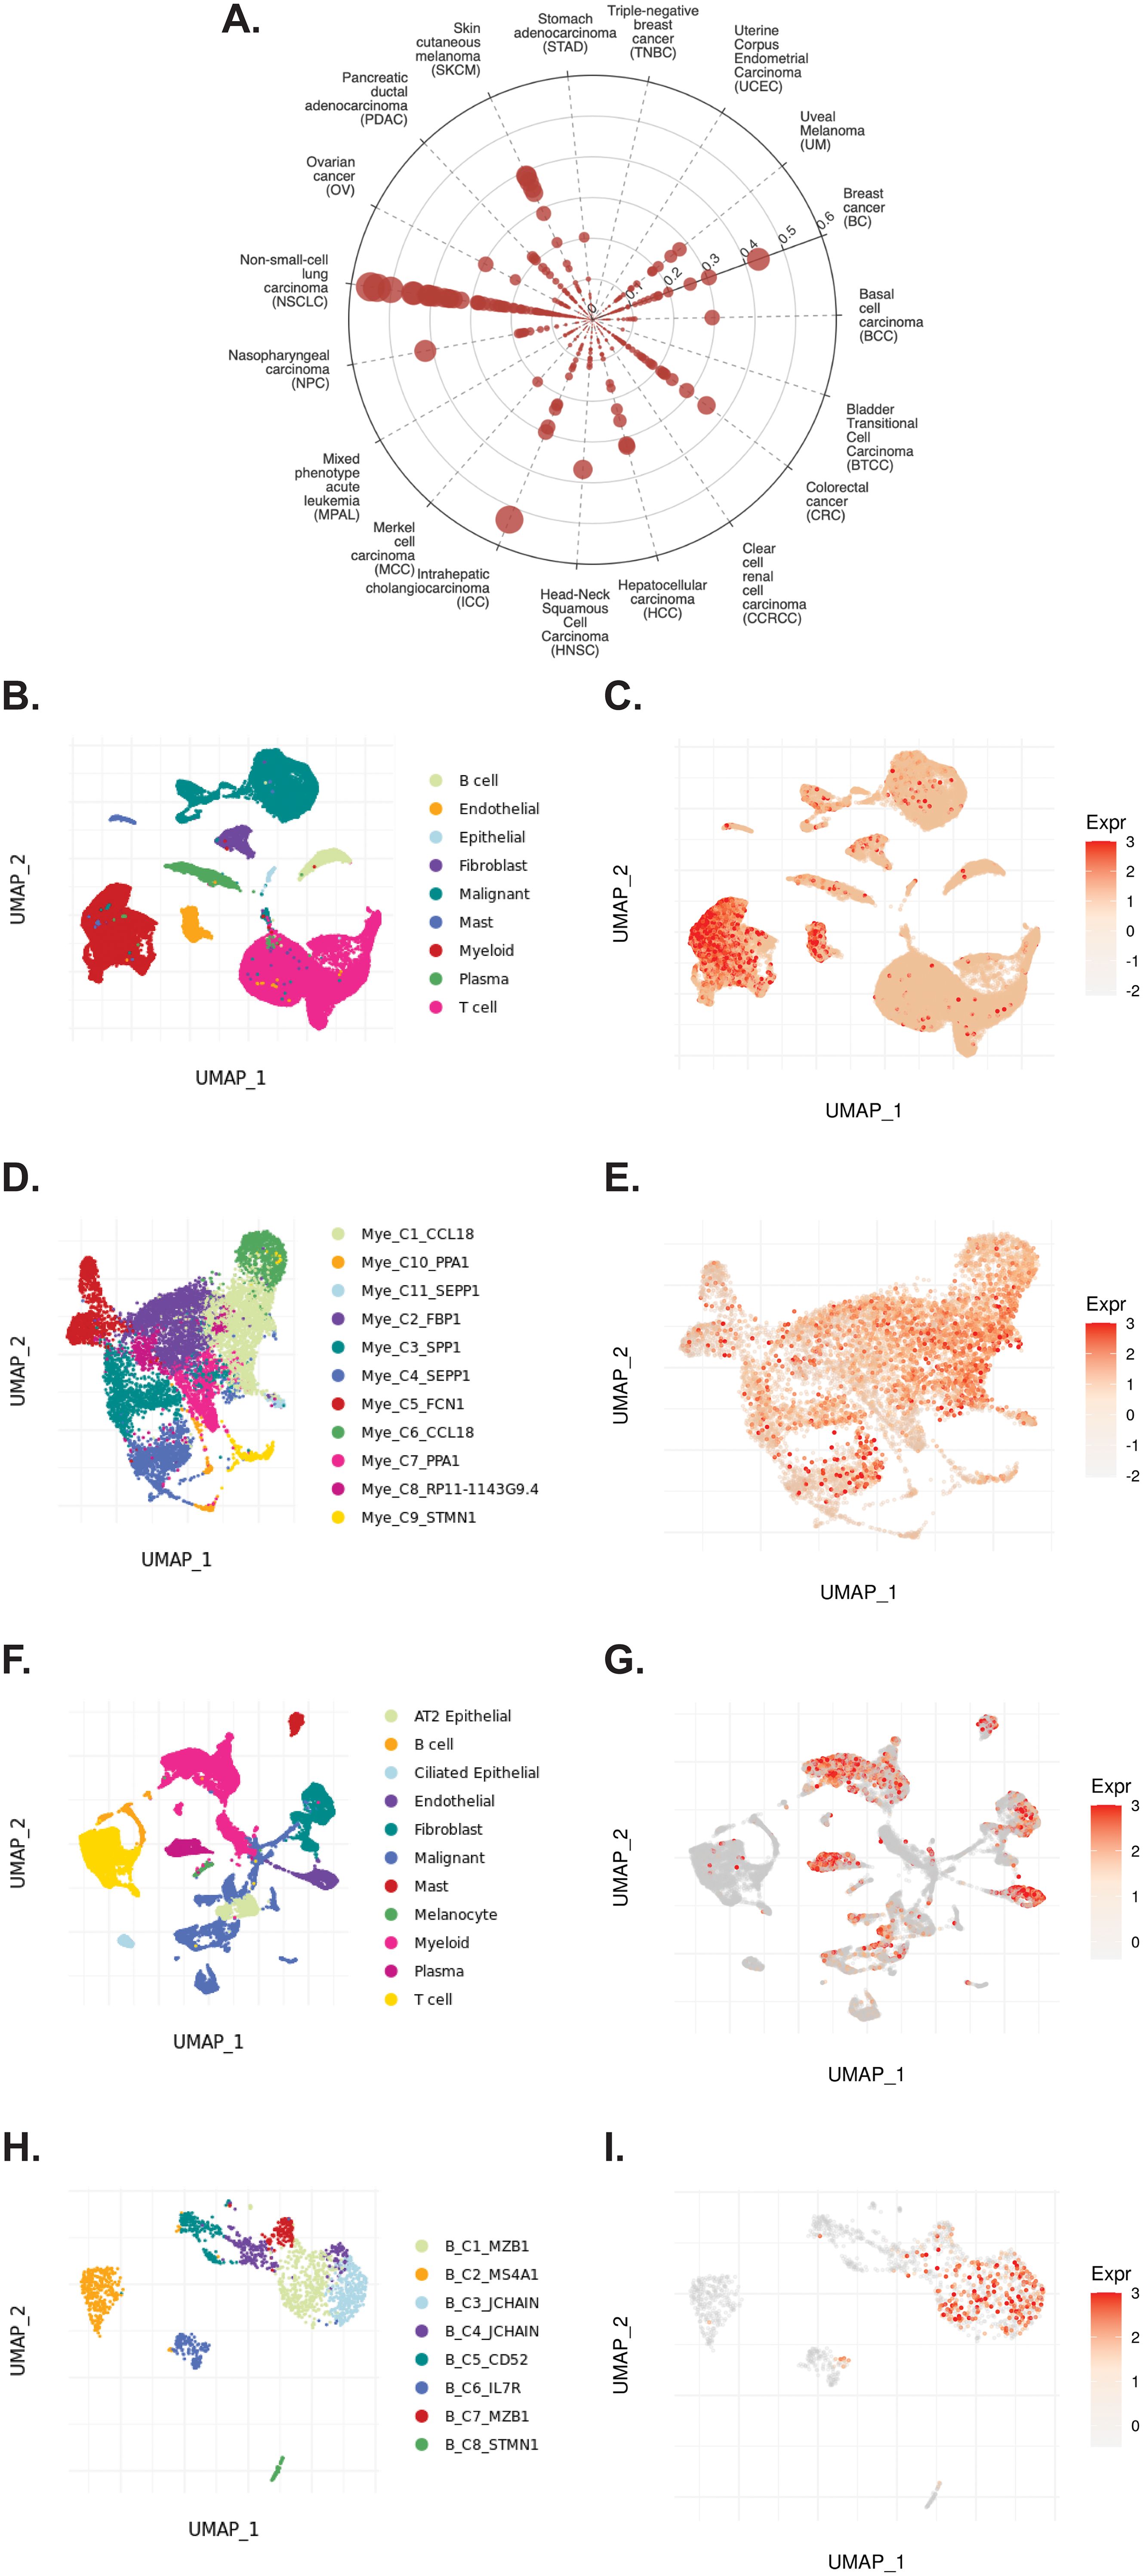
Figure 4. TIGER database confirms TCN2 expression on various myeloid and B cellular clusters of NSCLC datasets. (A) Cell Type Marker (Log2FC) diagram represents differential expression of TCN2 on various clusters and subclusters in each scRNA-seq tumor dataset of the TIGER database, with differential expression represented by circle size and distance from center. (B, C) UMAPs of all cellular clusters of the NSCLC dataset highlight expression of TCN2 on myeloid and endothelial cells. (D, E) UMAPs of the Myeloid subclusters of the NSCLC dataset highlighting expression of TCN2. (F, G) UMAPs of all cellular clusters of the NSCLC6 dataset highlights expression of TCN2 on endothelial and plasma cells. (H, I) UMAPs of the B cell sub-clusters of the NSCLC6 dataset highlighting expression of TCN2. UMAPs generated using the TIGER portal.
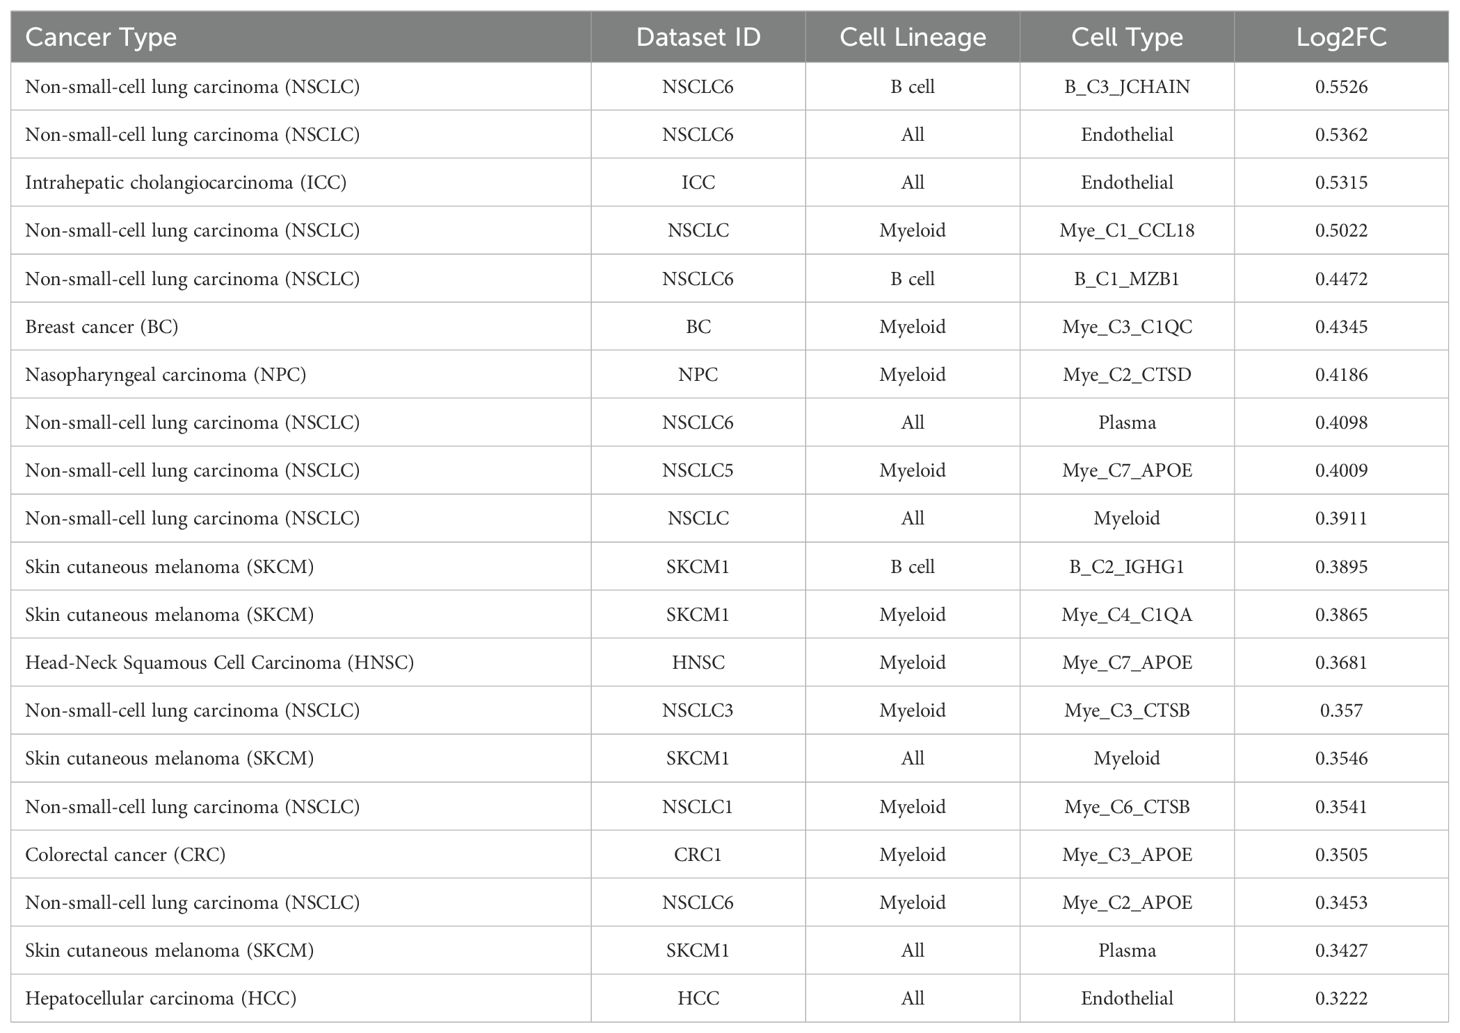
Table 3. Top 20 clusters with increased expression of TCN2 within the TIGER database.
3.5 TIGER reveals expression patterns of CD320 in solid tumorsThe TIGER portal was also used to investigate the expression of CD320 (83), the TCN2 receptor, across identified cellular clusters of solid tumor scRNA-seq datasets (66). Numerous cellular clusters across many solid tumors revealed differential expression of CD320 including stomach adenocarcinoma (STAD), colorectal cancer (CRC), Merkel cell carcinoma (MCC), NSCLC, ICC, and SKCM, among others (Figure 5A). The top 20 cellular clusters with the greatest increase in CD320 expression were reported, highlighting apparent increases for Endothelial, Malignant, B cell, CD4, and Myeloid cellular clusters across a variety of solid tumors (Table 4). To visualize these expression changes on immune cells of interest (B and Myeloid cells), subsequent analysis of UMAPs and gene expression boxplots for the NSCLC5 dataset confirmed increases in CD320 expression on Endothelial, Malignant, and Fibroblast cellular clusters (Figures 5B, C). Additional subcluster analysis of B cells supported an increase in CD320 expression on both B_C11_MZB1 and B_C4_IGHG1 (Figure 5D, E). Further visualization of UMAPs and gene expression boxplots for B cell subclusters of both the NSCLC (Figures 5F, G) and NSCLC1 (Figures 5H, I) datasets supported increased CD320 gene expression on various Marginal Zone B and B1 Cell Specific Protein (MZB1)+ and IGJ+ B cell subclusters, in accordance with findings from Table 4. Similar results were also apparent for the SKCM1 dataset, which revealed increased CD320 expression on all Plasma cells, Myeloid cell subclusters including Mye_C1_GZMB, as well as the B_C2_IGHG1 B cell subcluster (Supplementary File 1 – Supplementary Figure 5). Overall, these data corroborated previous publications which suggested that while CD320 is expressed ubiquitously across many cell types (84), its expression is increased on proliferating cells (85), such as malignant cells or B lymphocytes (86), in a variety of solid tumors (87).
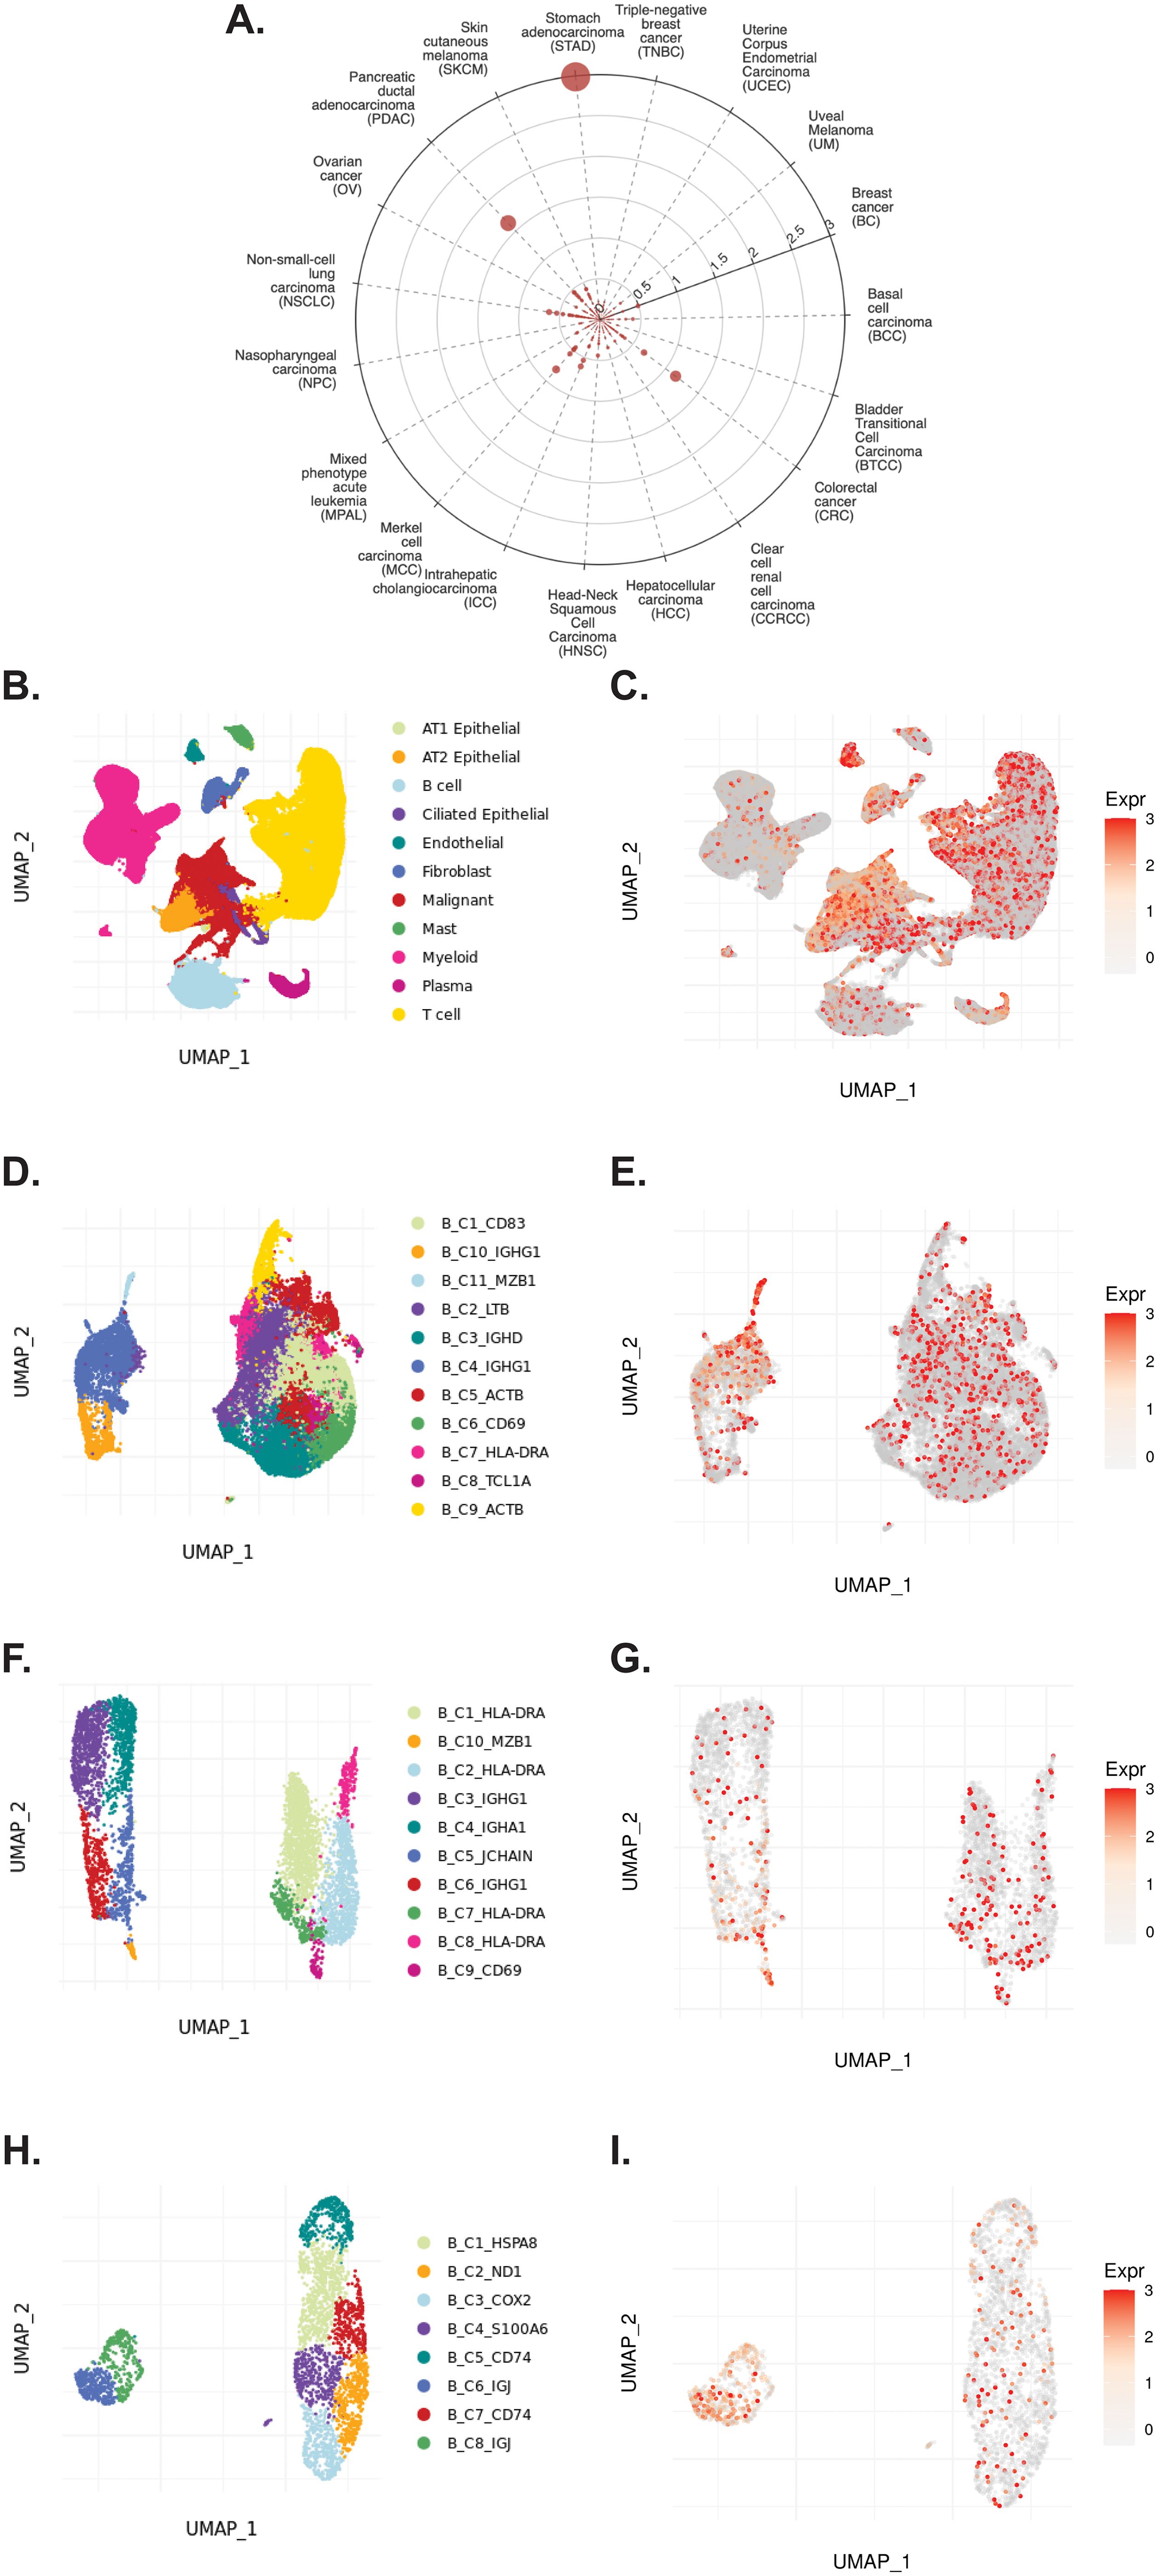
Figure 5. TIGER database confirms CD320 expression on various myeloid and B cellular clusters of NSCLC datasets. (A) Cell Type Marker (Log2FC) diagram represents differential expression of CD320 on various clusters and subclusters in each scRNA-seq tumor dataset of the TIGER database, with differential expression represented by circle size and distance from center. (B, C) UMAPs of all cellular clusters of the NSCLC5 dataset highlights expression of CD320 on endothelial, malignant, and fibroblast cellular clusters. (D, E) UMAPs of the B cell subclusters of the NSCLC5 dataset highlighting expression of CD320. (F, G) UMAPs of B cell subclusters of the NSCLC dataset highlighting expression of CD320. (H, I) UMAPs of B cell subclusters of the NSCLC1 dataset highlighting expression of CD320. UMAPs generated using the TIGER portal.
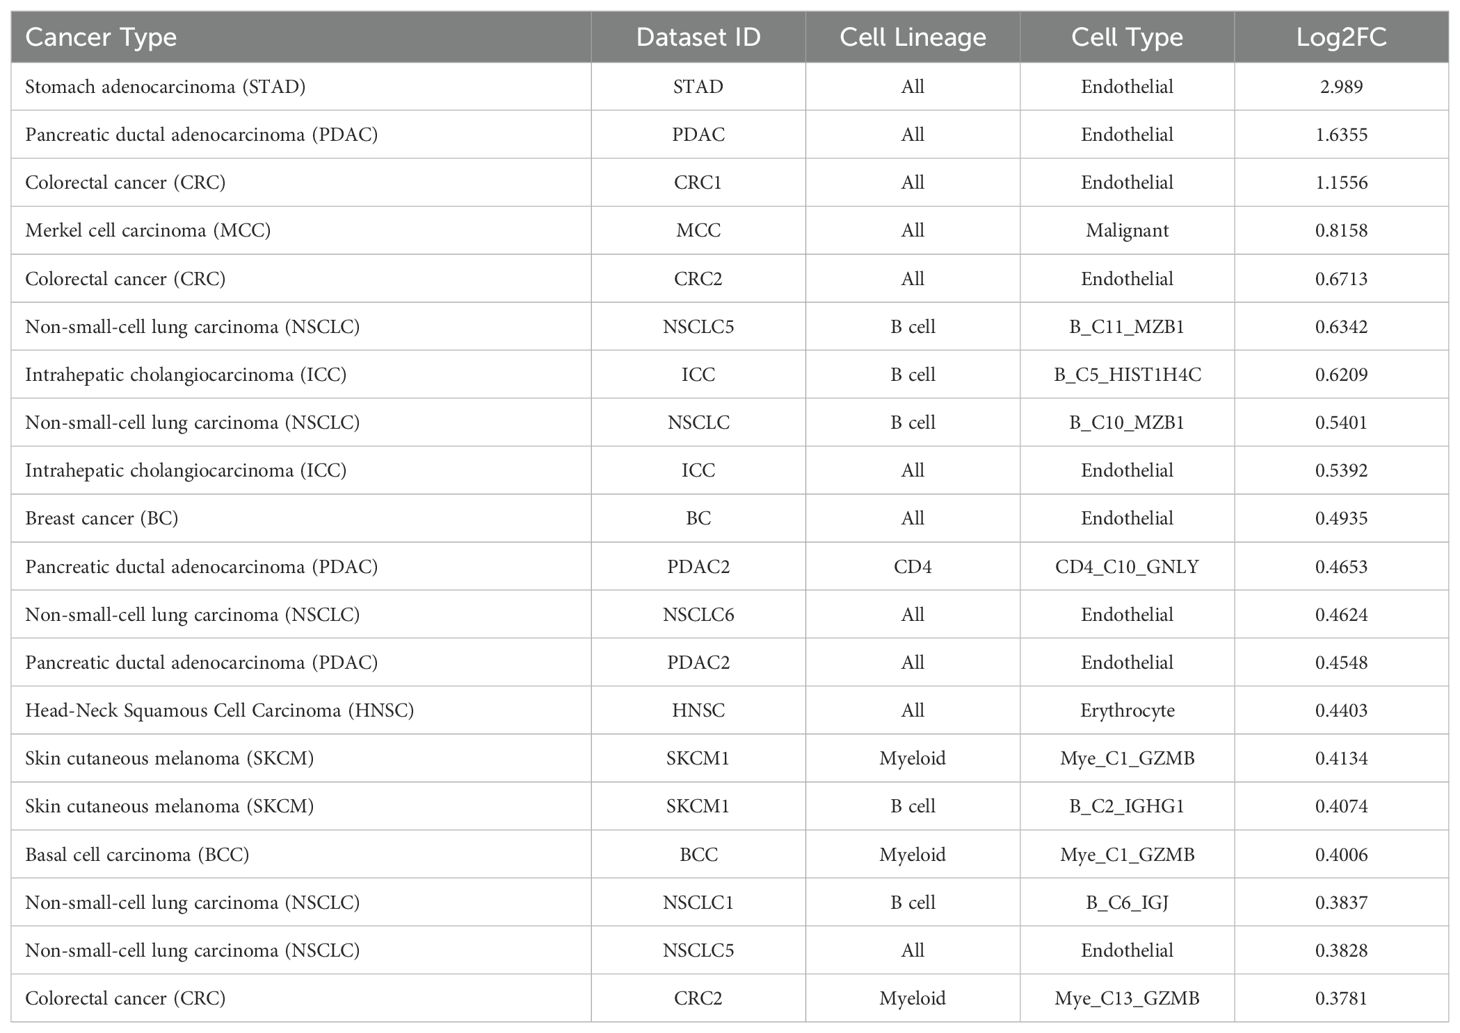
Table 4. Top 20 clusters with increased expression of CD320 within the TIGER database.
3.6 TIGER cell-cell communication analysis reveals interaction between TCN2+ myeloid cells and CD320+ B cells in solid tumorsTo investigate a possible interaction between TCN2+ Myeloid and CD320+ B cells in these solid tumors, the TIGER portal was then used to perform a cell-cell communication analysis (66). Further investigation of both the NSCLC (67) and SKCM1 (71) datasets was warranted considering the increased expression of both TCN2 (ligand) and CD320 (receptor) on various immune cell populations of these tumors. To begin, a cell-cell communication analysis for the Mye_C1_CCL18 subcluster, with the greatest increase in TCN2 expression of all myeloid cells of the NSCLC dataset (67), was performed. Analysis revealed that Mye_C1_CCL18 had greatest interaction with various other myeloid subclusters including Mye_C2_FBP1 (effect score = 97.684), Mye_C7_PPA1 (effect score = 97.64), and Mye_C6_CCL18 (effect score = 96.877). The top 20 receptor-ligand interactions driving these effect scores were reported (Table 5). Of note, this analysis consistently highlighted likely receptor-ligand interactions between CD74_MIF, CD74_COPA, CD74_APP, and HLA-DPB1_TNFSF13B as well as additional communication through HLA-DRB1_TNFSF9, CCR1_CCL18, and TNFRSF1A_GRN (Table 5). Similar cell-cell communication patterns were evident for the Mye_C4_C1QA subcluster of the SKCM1 dataset (71), which displayed the greatest increase in TCN2 expression of all SKCM1 myeloid subclusters. Here, Mye_C4_C1QA also reported the greatest cell-cell communication effects scores with other myeloid subclusters (Supplementary File 1 – Supplementary Table 1).
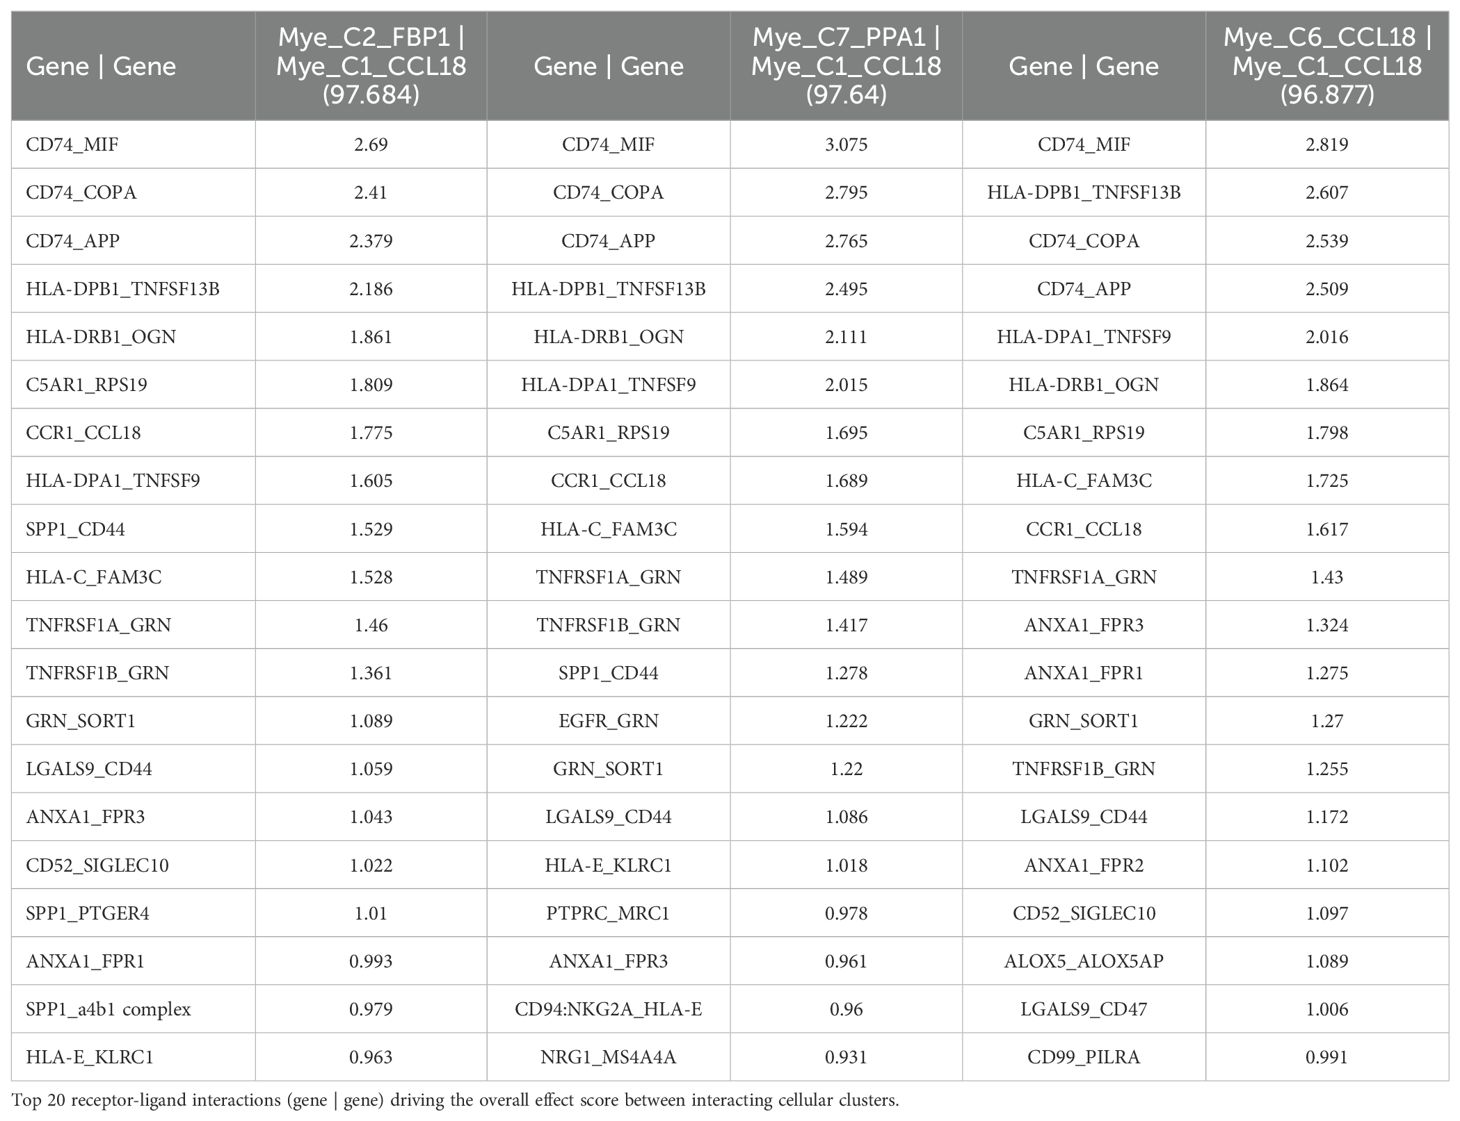
Table 5. Top 3 interactions defined by cell-cell communication analysis for Mye_C1_CCL18 of the NSCLC dataset (TIGER), with effect score presented in parenthesis.
Additionally, a cell-cell communication analysis for the B_C10_MZB1 subcluster, with the greatest increase in CD320 expression of all B cells of the NSCLC dataset (67), was performed. Analysis revealed that B_C10_MZB1 had the greatest interaction with various myeloid subclusters including Mye_C1_CCL18 (effect score = 48.993), Mye_C2_FBP1 (effect score = 47.944), and Mye_C7_PPA1 (effect score = 46.079). The top 20 receptor-ligand interactions driving these elevated effect scores were reported. Of note, this analysis consistently highlighted likely receptor-ligand interactions between CD74_MIF, CD74_COPA, CD74_APP, and HLA-C_FAM3C as well as additional communication through C5AR1_RPS19, HLA-DPB1_TNFSF13B, CD94:NKG2A_HLA-E, SPP1_CD44, and various chemokine axes (Table 6). Similar cell-cell communication patterns were also evident for the B_C2_IGHG1 subcluster of the SKCM1 dataset (71), which displayed the greatest increase in CD320 expression of all SKCM1 B cell subclusters. Importantly, the B_C2_IGHG1 subcluster displayed the greatest cell-cell communication effect score with various myeloid subclusters including Mye_C4_C1QA (Supplementary File 1 – Supplementary Table 2). Overall, cell-cell communication analysis revealed that those B cell subclusters with greatest expression of CD320 [B_C10_MZB1 (NSCLC), B_C2_IGHG1 (SKCM1)] reported the greatest cell-cell communication effect scores with those Myeloid cell subclusters with greatest expression of TCN2 [Mye_C1_CCL18 (NSCLC), Mye_C4_C1QA (SKCM1)]. These results suggest a possible Myeloid (TCN2) to B/Plasma cell (CD320) communication network in the tumor microenvironment of immunogenic solid tumors. Considering TCN2’s previously described biological functions (88–90), it was hypothesized that this interaction in solid tumors would allow for enhanced B lymphocyte infiltration, proliferation, and germinal center/TLS formation (91).
留言 (0)