
記住我

The dengue virus (DENV) belongs to the genus Orthoflavivirus within the family Flaviviridae (Postler et al., 2023). This genus also includes other viruses transmitted by mosquitoes and ticks that cause human diseases (Guzman et al., 2010; Guzman and Vazquez, 2010). The DENV crisis is significantly impacting global healthcare, with recent reports indicating over 100 million illnesses and 25,000 deaths attributed to dengue each year (Schaefer et al., 2020; Mohapatra et al., 2022). DENV is primarily transmitted to humans through the bites of infected female mosquitoes, mainly of the species Aedes aegypti (A. aegypti) and, to a lesser extent, A. albopictus (Ferreira-de-Lima and Lima-Camara, 2018). The DENV was first isolated in 1943, with DENV-1 being the earliest identified serotype (Normile, 2013). Dengue infections are caused by four closely related virus: DENV-1, DENV-2, DENV-3, and DENV-4, which share about 65% of their genomes (Normile, 2013). Despite this genetic similarity, there is still considerable genetic variation within each serotype (Normile, 2013; Khetarpal and Khanna, 2016). Among the serotypes, DENV-2 played a significant role in dengue-related fatalities, characterized by its distinct antigenic properties yet sharing similarities with other types (Vaughn et al., 2000). The genetic composition of DENV-2 is composed of an 11-kilobase RNA molecule (Murugesan and Manoharan, 2020). In addition to the open-reading frame (ORF), the viral RNA is surrounded by 5′- and 3′-untranslated regions (UTRs) that are crucial to translation, packaging, and replication (Wei et al., 2009). The genomic constituent of DENV-2 encodes around seven nonstructural proteins (NSP1 to NSP5) and three structural proteins such as envelope (E), membrane (M), and capsid (C) protein (Shrivastava et al., 2020). These components constitute the outer shell of the DENV-2, crucial for interacting with host cells and evading immune responses (da Fonseca et al., 2017; Verhaegen and Vermeire, 2024). Each of the seven NSPs of the DENV has a unique function. NSP1 is involved in viral replication and immune evasion, while NSP2A plays a role in viral assembly and RNA replication (Dey et al., 2021). NSP2B acts as a cofactor for NSP3 (Dey et al., 2021), which is essential for protease activity and crucial for viral replication. NSP4A facilitates host cell membrane rearrangement and viral replication, while NSP4B contributes to the formation of the viral replication complex and modulates host immune responses (Cortese et al., 2021). NSP5, the largest nonstructural protein, functions as an RNA-dependent RNA polymerase and methyltransferase, vital for viral RNA synthesis and capping (Li and Kang, 2022; Verhaegen and Vermeire, 2024). Given the virulence and biological significance of the seven NSPs of DENV-2, NSP1 stands out as a promising therapeutic target and vaccine candidate (Chen et al., 2018). Moreover, the experimental structure of NSP1 has been determined, highlighting its critical role in DENV-2 (Akey et al., 2014).
Despite the severe consequences and high mortality rate of DENV-2 infections, specific treatment options beyond symptomatic relief measures remain lacking. This challenge stems from various factors, including the rapid replication of the DENV-2, frequent mutations, and the use of several tactics to subvert the immune system of the hosts (Carocci and Yang, 2016; Guo et al., 2017; Soe et al., 2021). Given these challenges, ongoing research into therapeutic approaches for DENV infections is particularly difficult. One strategy involves repurposing existing antiviral medications to combat DENV-associated illnesses (Botta et al., 2018). To address this challenge effectively, it is crucial to employ in silico screening to discover potential inhibitors of DENV-2 from medicinal herbs (Rosmalena et al., 2019; Parham et al., 2020). Recently, interest in medicinal plants has rapidly increased due to their richness in phenolic compounds such as phenolic acids, flavonoids, and tannins (Alara et al., 2018; Joshi et al., 2021). The extracts of V. cinerea have been reported to exhibit several pharmacological properties, including antiviral activity against dengue disease (Kaushik et al., 2021). Although a large number of antimicrobial secondary metabolites have been discovered from the medicinal herb, V. cinerea, however, antiviral activities of these natural products have not been evaluated so far (Joshi et al., 2021; Singh et al., 2021). Computer-aided drug discovery has evolved significantly over decades, with recent years witnessing a profound integration of computational technologies in both academic research and pharmaceutical development (Rosmalena et al., 2019; Muratov et al., 2021; Sadybekov and Katritch, 2023). In this study, we computationally investigated five compounds such as Beta-amyrin, Beta-amyrin acetate, Chrysoeriol, Isoorientin, and Luteolin sourced from V. cinerea for their efficacy against the NSP1 of DENV-2. Our objective was to computationally evaluate the efficacy of these compounds in inhibiting NSP1 of DENV-2, providing new strategies to combat DENV infections. Nevertheless, this study highlights the need for further research into these compounds to develop more promising medications for DENV-2 associated ailments.
2 Materials and methods2.1 Protein structure preparationThe three-dimensional (3D) crystal structure of the NSP1 of DENV-2 was obtained from the Protein Data Bank database (PDB ID: 4O6B) with a resolution of 3.00 Å. To prevent undesirable interactions and simplify the 3D structure of NSP1 by removing water and excess heteroatoms, we employed Discovery Studio Visualizer 2024 (v24.1.0.23298) (Biovia, 2015). Furthermore, we minimized the energy of NSP1 to decrease its overall potential energy, employing Swiss PDB (v4.1.0) (Wang et al., 2004). Subsequently, we identified optimal targets for conducting molecular docking studies with NSP1 of DENV-2.
2.2 Retrieval and preparation of compoundsCompounds from V. cinerea were sourced from the curated database Indian Medicinal Plants, Phytochemistry And Therapeutics 2.0 (IMPPAT 2.0) (https://cb.imsc.res.in/imppat/), which currently catalogues 4,010 Indian medicinal plants, 17,967 phytochemicals and 1,095 therapeutic uses, and related data (Mohanraj et al., 2018). Seventeen chemical structures of V. cinerea were retrieved from IMPPAT in pdb format. Prior to the docking analysis, each of the seventeen compounds was screened through MarvinSketch (Liliasari et al., 2021) to identify any structural discrepancies. Subsequently, the compounds were converted into PDB file format using Avogadro (v. 1.99.0) (Hanwell et al., 2012). The compounds then underwent semi-empirical geometry optimization to improve their energetic favorability. This was followed by molecular screening Gaussian (v.09) (Hasnat et al., 2024), with the protocol for geometry optimization detailed in Supplementary Material S1.
2.3 Molecular screening of compounds against NSP1Molecular docking is extensively utilized in drug discovery for ligand identification. It aids in discovering potential drug candidates by predicting the binding affinity of small molecules to a target protein (Agu et al., 2023). In this investigation, we utilized PyRx (v0.8) with inbuilt AutoDock Vina to conduct molecular screening between the compounds and protein (NSP1) (Harrach and Drossel, 2014). To conduct the screening, the prepared NSP1 was designated as the macromolecule (receptor), and the compounds were designated as ligands. The docking process was executed without selecting the binding pocket’s residues. AutoDock Vina used integrated algorithms to automatically identify the active site on the protein’s surface, where substrate molecules bind and react, by analyzing the receptor’s 3D structure (Trott and Olson, 2010). This analysis involved rigid docking, where all rotatable bonds were made non-rotatable. The grid box position is crucial for effective docking analysis as it defines the specific area of the protein where ligand docking occurs (Xing et al., 2023). Considering the protein structure’s size and coverage, the grid box size was set at 67.6033 Å along the X-axis, 51.6295 Å along the Y-axis, and 56.6570 Å along the Z-axis. Among 17 compounds analyzed, five showed higher binding free energies (<−7.0 kcal/mol) and formed stable complexes with NSP1. Lacking any NSP1-specific drug compound, three general DENV-2 inhibitors were screened as controls. Compounds such as Silymarin, Baicalein, and Baicalin were known to achieve around 100% inhibition of DENV-2 (Zandi et al., 2012; Moghaddam et al., 2014; Low et al., 2021). The Discovery Studio Visualizer was utilized to visualize and measure the strength of receptor-ligand interactions.
2.4 Thermodynamic, molecular orbital, electrostatic potentials and spectral analyses of the phytocompoundsCompounds such as Beta-amyrin (CID 73145), Beta-amyrin acetate (CID 92156), Chrysoeriol (CID 5280666), Isoorientin (CID 114776), and Luteolin (CID 5280445) demonstrated stable interactions with NSP1, and therefore, selected for subsequent analyses along with a control drug, Baicalein (CID 5281605). These compounds and control drug underwent thermochemical property analysis using Gaussian (v.09) software to evaluate their thermodynamic properties as drug compounds (Zheng et al., 2009). To incorporate the Density Functional Theory (DFT) (Wazzan and Safi, 2017), B3LYP, and the 6-31G (d, p) basis set (Kruse et al., 2012), the gas phase geometry optimization was performed using Gaussian (v.09) software. Subsequently, the electronic transitions of the compounds were calculated using time-dependent density functional theory (TD-DFT). The highest occupied molecular orbital (HOMO) and lowest unoccupied molecular orbital (LUMO), referred to as lead molecular orbitals, were calculated using TD-DFT analysis to assess their chemical reactivity (Hossain et al., 2024). The Equations 1 and 2 (Uzzaman et al., 2021) were utilized to analyze the characteristics of molecular orbitals:
Gap ΔE=εLUMO−εHOMO,η=εLUMO−εHOMO2,S=1η(1)Where: ΔE is the energy gap; εLUMO is the lowest occupied molecular orbit; εHUMO is the highest occupied molecular orbit; η is the chemical hardness; S is the chemical softness.
μ=εLUMO+εHOMO2; χ=−εLUMO+εHOMO2; ω=μ22η(2)Where: μ is the chemical potential; εLUMO is the lowest occupied molecular orbit; εHUMO is the highest occupied molecular orbit; χ is the electronegativity; ω is the electrophilicity index; μ is the chemical potential; η is the chemical hardness. The obtained compounds were designated as ligands for the docking experiment.
Based on the results of DFT calculations of the five phytocompounds in Gaussian, we performed visualization of their thermodynamic, molecular orbital, electrostatic potentials, and spectral properties using GaussView (v.06) (Ofem et al., 2022). GaussView is a molecular visualization program equipped with a graphical interface that helps determine and visualize thermodynamic properties of phytocompounds (Islam et al., 2024). To elucidate the optimized thermodynamic and molecular orbital properties, we used the ResultView module of GaussView, while electrostatic potentials were measured through the Surface/Contours module. The computed simulated UV-Vis and IR spectra for optimized phytocompounds were visualized using the UV-Vis module of GaussView (Ofem et al., 2022).
2.5 Drug likeliness and pharmacokinetics properties analysisIn drug discovery and development, ineffectiveness, and safety are the main causes of failure. Chemical absorption, distribution, metabolism, excretion, and toxicity (ADMET) must be considered to create a better drug candidate (Lin et al., 2003). High-quality drug candidates should have satisfactory ADMET characteristics at a therapeutic dose and effective efficacy against the therapeutic target (Abdul-Hammed et al., 2021). An in silico pharmacokinetics method was used to analyze the time-based dynamics (ADMET) of the compounds and control drug. The SwissADME web service was used to predict the ADMET profiles of the finally optimized compounds and control drug (Daina et al., 2017). Given the importance of assessing toxicity, Protox III online server was additionally employed to verify the toxicity values (Banerjee et al., 2018). For ADMET profiling, the Simplified Molecular Input Line Entry System (SMILES) format of each compound was sourced from PubChem database (Kim et al., 2016). Furthermore, Lipinski’s Rule of Five was applied to evaluate the drug-likeness of the top five docked compounds and the control drug (Lipinski, 2004). The Pa (probability of activity) values of the corresponding compounds along with control drug was calculated using PASS Online tool of Way2Drug (Filimonov et al., 2014). The ADMET characteristics were meticulously evaluated and compared to standard ranges to determine their therapeutic potential, ensuring that each attribute falls within acceptable limits.
2.6 Molecular dynamics simulationThe molecular dynamics simulation (MDS) was performed for the best docked compounds and a control (Baicalein) with NSP1 protein. MDS program was conducted for a duration of 200 nanoseconds using the “Desmond v4.0 Program” of the Schrödinger software suite to model the molecular dynamics of the protein-ligand complex structures in a Linux infrastructure (El Khoury et al., 2019). Preceding to conduct MDS, receptor-ligand complexes were consolidated into a single PDB file by incorporating the textual data of the ligand file. The MDS process began with the protein preparation workflow, where the protein was optimized employing the OPLS4 force field. OPLS4 is recognized for its high accuracy and modern characteristics, offering extensive coverage of chemical space suitable for various applications in drug discovery and materials science (Lu et al., 2021). To build the environment for the molecular dynamics system, the protein-ligand complex was enveloped by a pre-defined SPC water model within an orthorhombic box (Yang and Kar, 2024). An effective MDS system was established by minimizing the system volume and automatically introducing Na+ ions to neutralize the system. MDS protocol was exact for all compounds where temperature and pressure were rigorously maintained at 300 K and 1.01325 bar, respectively (Hoover, 1985; Zhong and Wu, 2004). Each simulation was executed employing the constant number of particles, pressure, and temperature (NPT) ensemble, with a focus on conserving the number of atoms, pressure, and timescale (Badar et al., 2020). Throughout the MDS, long-range electrostatic interactions were computed utilizing the Particle-Mesh-Ewald method, following the approach elucidated by Essmann and Berkowitz (1999). Subsequently, the results were comprehensively analyzed and visualized using simulation interaction diagrams and MS-MD trajectory analysis techniques. Since no effective therapeutic agent has been identified against NSP1 of DENV-2, a control drug compound was not included in the MDS analysis. Therefore, to evaluate the stability of the NSP1 protein and ascertain any potential impact of the five compounds on its stability, a dedicated MDS was solely performed considering NSP1 as a reference.
2.7 Post MDS thermal MM-GBSA analysisThermal MM-GBSA (Molecular Mechanics Generalized Born Surface Area) analysis was conducted by using prime MM-GBSA, a module of the Schrödinger software suite. To run the MM-GBSA analysis, 200 ns trajectories were divided into twenty frame snapshots, poses were collected from each snapshot, and the free energy across the 200 ns simulation time was calculated. After dividing the MDS trajectory into twenty frame snapshots, the ligand and receptor were isolated for each pose to perform MM-GBSA calculations. A comprehensive analysis was conducted where 83 physicochemical properties were extracted for each ligand compound. Among these, we focused on five key properties essential for estimating the free energy of receptor-ligand interactions within biological solvent systems (Pattar et al., 2020).
3 Results3.1 Molecular screening and interactions of the NSP1 with phytocompoundsThis study focused on predicting potential drug candidates from V. cinerea that are effective against the NSP1 of DENV-2 using in silico computational approaches. Through virtual screening against NSP1, we identified five compounds (Beta-amyrin, Beta-amyrin acetate, Luteolin, Chrysoeriol, and Isoorientin) that demonstrated the strongest binding energies among the 17 constituents examined (Supplementary Table S1). Among the three control drugs (Supplementary Table S1), only Baicalein demonstrated significant binding with NSP1, with a reported binding affinity of −7.8 kcal/mol. Among the five compounds, Beta-amyrin exhibited the highest free energy of binding at −10.4 kcal/mol during docking. Similarly, the other four compounds viz. Beta-amyrin acetate, Luteolin, Chrysoeriol, and Isoorientin showed substantial binding affinities of −9.5, −7.5, −7.5, and −7.8 kcal/mol, respectively (Table 1).
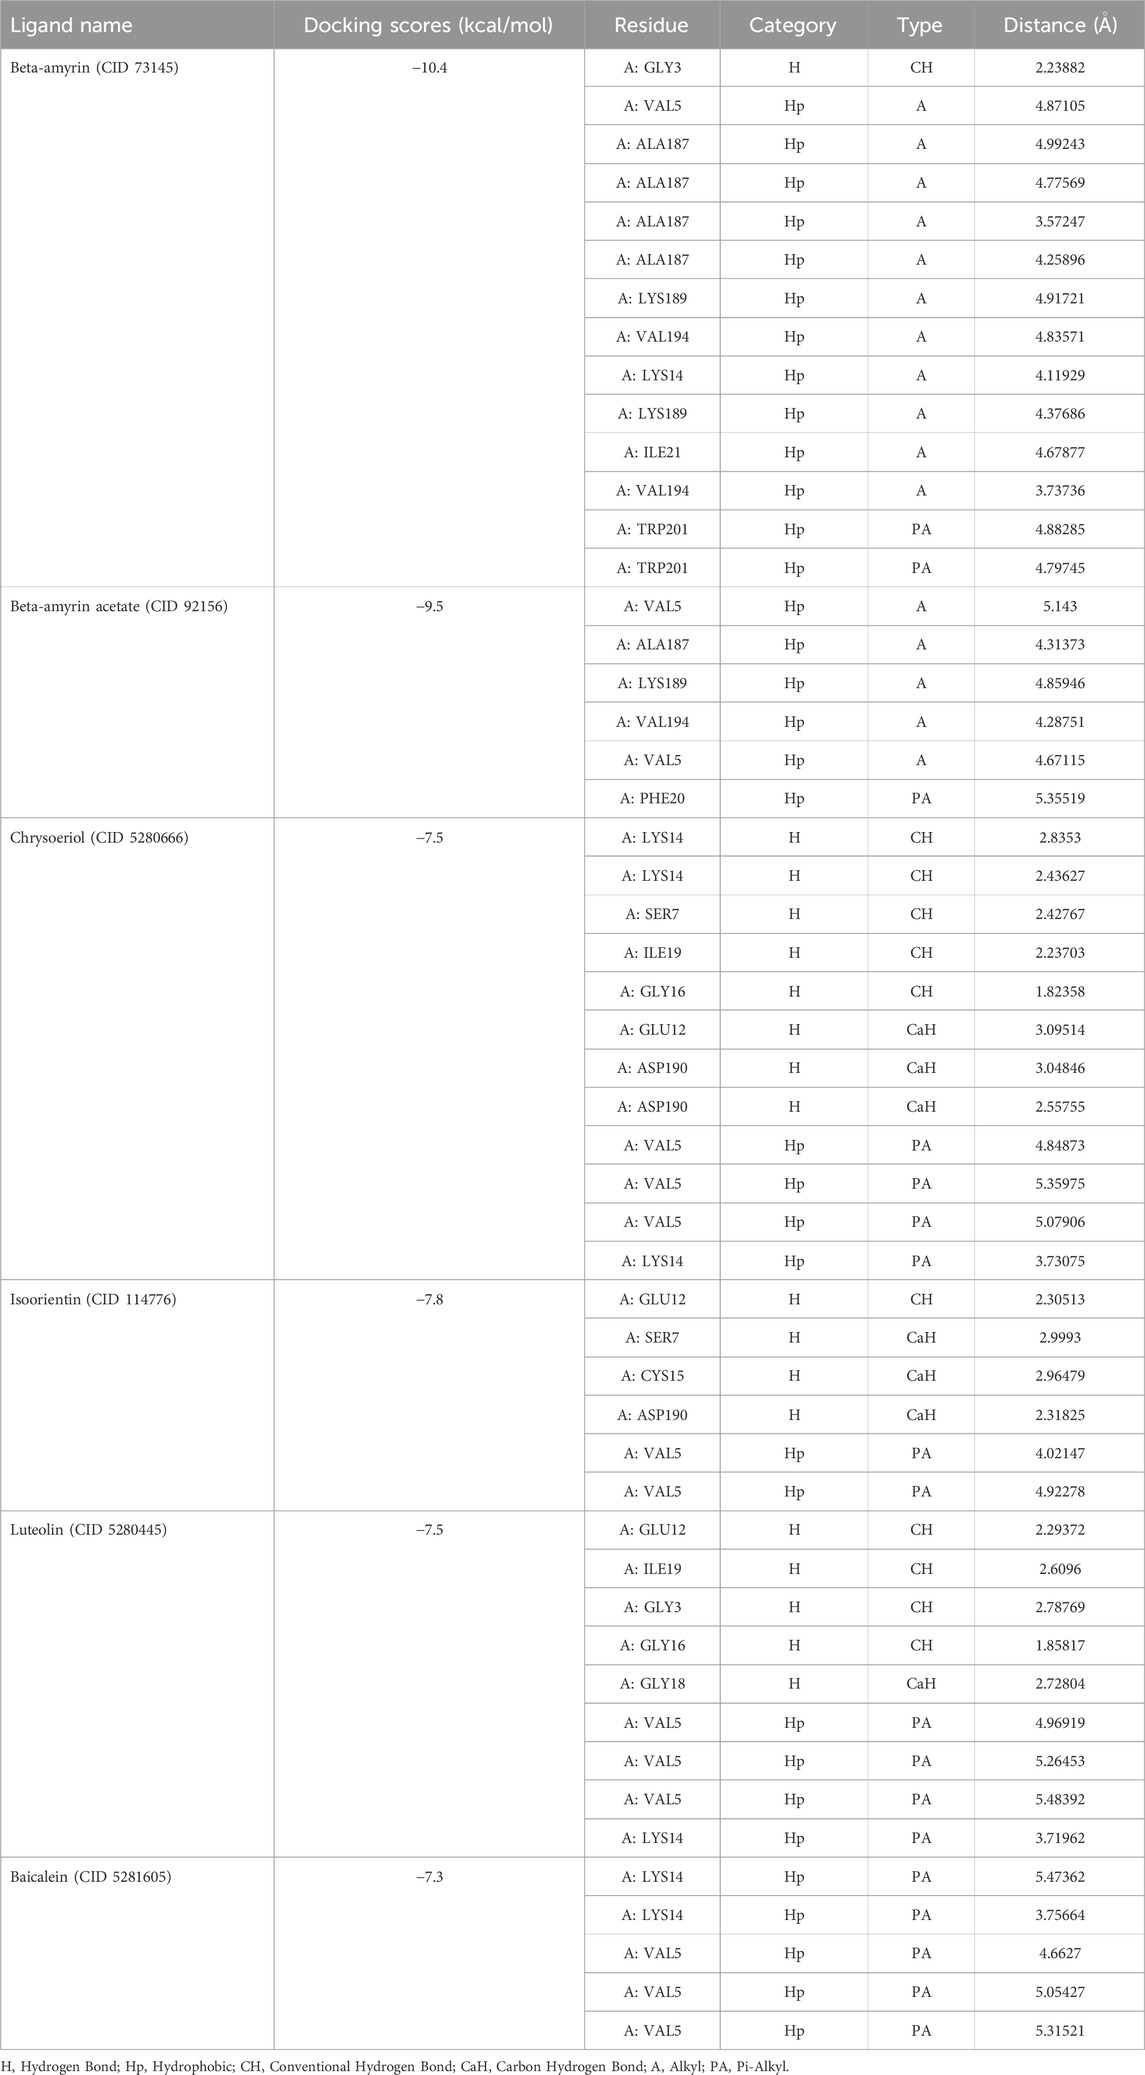
Table 1. Molecular docking scores and non-bond interactions of the best five phytocompounds with NSP1.
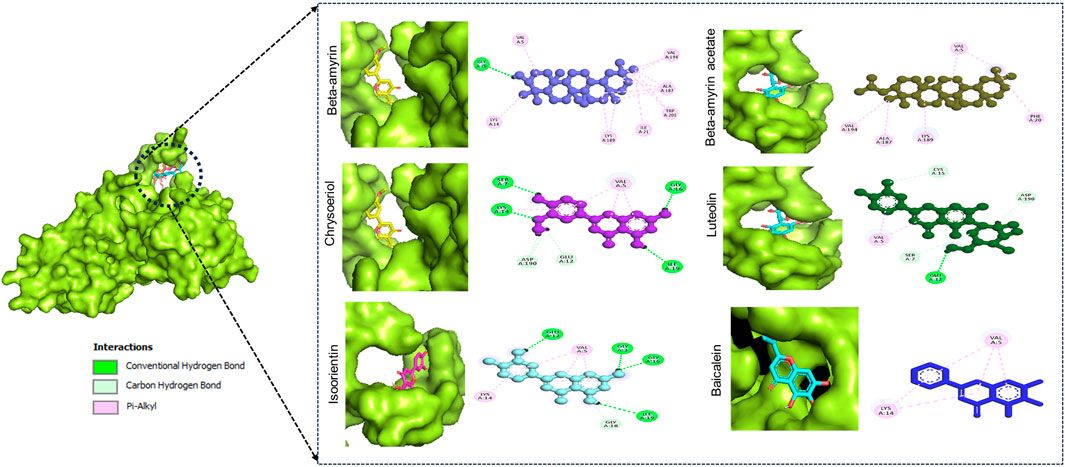
Figure 1 illustrates the graphical representation of the interactions between these compounds and the amino acid residues of NSP1. In the initial screening, various bonded and non-bonded interactions were identified at different sites within each molecule studied. For instance, Beta-amyrin formed a conventional hydrogen bond with the GLY3 residue, with a ligand distance of 2.23882 Å. Furthermore, hydrophobic interactions were observed at 13 binding sites involving VAL5, ALA187, LYS189, VAL194, LYS14, LYS189, ILE21, and TRP201. Except for TRP201, which exhibited a pi-alkyl hydrophobic bond, all other hydrophobic interactions were of the alkyl type with the respective residues (Figure 1). The next highest free energy-releasing compound, Beta-amyrin acetate, formed alkyl bonds with VAL5, ALA187, LYS189, and VAL194 residues, and a pi-alkyl bond with PHE20. Likewise, Luteolin, formed four typical hydrogen bonds with GLU12, ILE19, GLY3, and GLY16, all within a distance of less than 3 Å. Additionally, it displayed a carbon-hydrogen bond with GLY18 and four pi-alkyl hydrophobic interactions with VAL5 and LYS14. Similarly, Chrysoeriol showed a binding affinity of −7.5 kcal/mol, forming three conventional hydrogen bonds and two pi-alkyl interactions (Figure 1). Luteolin formed four conventional hydrogen bonds with SER7, LYS14, GLY16 and ILE19, three carbon-hydrogen bonds with GLU12 and ASP190, and a pi-alkyl interaction with VAL5. Isoorientin also demonstrated one conventional hydrogen bond with GLU12, two pi-alkyl hydrophobic interactions with VAL5, and three carbon-hydrogen bonds with SER7, CYS15, and ASP190 (Figure 1; Table 1).

Figure 1. Binding affinity of the selected compounds to the identical pocket region of the NSP1 of DENV-2. Beta-amyrin showed the highest hydrophobic interactions with 13 amino acid (aa) residues compared to other four compounds. Beta-amyrin acetate showed only pi-alkyl hydrophobic interactions with five aa residues, Chrysoeriol formed three conventional hydrogen bonds and two pi-alkyl interactions, Luteolin formed four conventional H-bonds and three carbon-hydrogen bonds and a pi-alkyl interaction, and Isoorientin formed a conventional hydrogen bond, two pi-alkyl hydrophobic interactions and three carbon-hydrogen bonds.
3.2 Thermodynamic propertiesThe five compounds with the highest negative docking scores such as Beta-amyrin, Beta-amyrin acetate, Chrysoeriol, Isoorientin, and Luteolin were further analyzed for their thermodynamic properties. All of the five compounds revealed negative free energy, indicating the spontaneous binding. The free energy values were −1,643.41 Hartree for Isoorientin and −1,400.54 Hartree for Beta-amyrin acetate, while Beta-amyrin, Chrysoeriol, and Luteolin had values of −1,247.90 Hartree, −1,068.07 Hartree, and −1,028.80 Hartree, respectively (Table 2). However, the control drug demonstrated the lowest free energy (−953.59 Hartree) compared to the selected phytocompounds. Based on these values, it can be concluded that Isoorientin and Beta-amyrin acetate exhibited greater spontaneity compared to Beta-amyrin, Chrysoeriol, and Luteolin. The enthalpy values were −1,639.32 Hartree for Isoorientin and −1,400.44 Hartree for Beta-amyrin acetate, while the enthalpy values for Beta-amyrin, Chrysoeriol, Luteolin and Baicalein were −1,247.81 Hartree, −1,068.01 Hartree, −1,028.74 Hartree, and −953.53 Hartree, respectively (Table 2). The dipole moments of Beta-amyrin, Beta-amyrin acetate, Isoorientin, Luteolin and Baicalein were determined to be 1.42 Debye, 1.77 Debye, 3.63 Debye, 5.00 Debye and 2.91 Debye, respectively. Chrysoeriol exhibited the highest dipole moment at 5.25 Debye, indicating a strong binding interaction with the receptor protein (Table 2).

Table 2. Molecular formula (MF), molecular weight (MW), energies (Hartree), and dipole moment (Debye) of compounds of V. cinerea.
3.3 Molecular orbital properties of the compoundsThe frontier molecular orbitals (FMO), commonly referred to as the HOMO and LUMO, provided essential information on the molecular properties of the screened compounds along with the control drug. These properties included hardness (η), softness (S), chemical potential (µ), electronegativity (χ), and electrophilicity (ω), as detailed in Table 3. The energy gap (Egap) of the studied compounds was in the following order: Chrysoeriol < Luteolin < Isoorientin < Beta-amyrin acetate < Beta-amyrin (Table 3). The HOMO and LUMO energy gap for the control drug was found to be 3.84 which was almost close to Chrysoeriol, Luteolin and Isoorientin. The density of states (DOS) for the five chosen compounds is illustrated in Figure 2. Arrows within the figure highlighted the band gap of each molecule, color-coded to facilitate visual comparison. Chrysoeriol was identified as the softest molecule with the lowest energy gap (4.05 eV), making it highly chemically reactive but less stable. Luteolin (4.06 eV) and Isoorientin (4.09 eV) also exhibited relatively low energy gaps compared to Chrysoeriol. In contrast, Beta-amyrin had the highest energy gap (6.72 eV), followed by Beta-amyrin acetate (6.45 eV), indicating that they are the hardest molecules with lower reactivity but greater stability (Figure 2; Table 3).
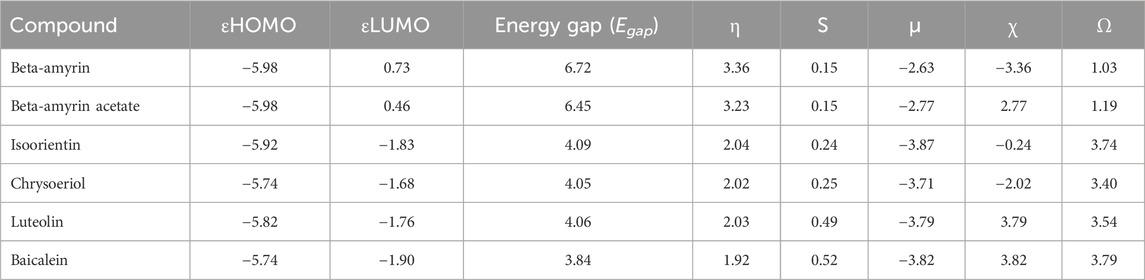
Table 3. Energy (eV) of HOMO-LUMO, gap, hardness (η), softness (S), chemical potential (µ), electronegativity (χ), and electrophilicity (ω) of the compounds of V. cinerea.
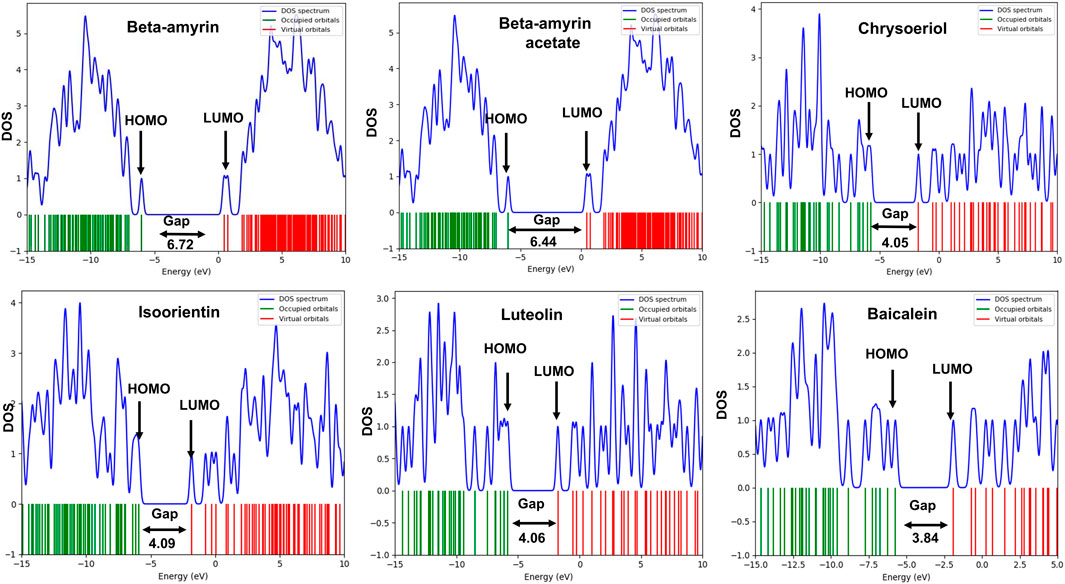
Figure 2. Density of state (DOS) plot of HOMO-LUMO and energy gap of five selected compounds of V. cinerea along with control. Green and red lines show HOMO and LUMO orbitals.
3.4 Molecular electrostatic potentials of the compoundsMolecular electrostatic potential (MEP) analysis aided in understanding H-bonding interactions and the biological recognition process of the selected compounds. In this study, we found the highest positive potential at the most electropositive atom, hydrogen, and the highest negative potential at the most electronegative atom, oxygen. In the MEP analysis, Luteolin showed the highest positive potential at +8.392 atomic units (a.u.) and the most negative potential at −8.392 a.u. The other four compounds, namely, Beta-amyrin, Beta-amyrin acetate, Chrysoeriol, and Isoorientin exhibited negative potential values of −4.889, −5.110, −7.715, and −8.306 a.u., respectively, and positive potential values of +4.889, +5.110, +7.715, and +8.306 a.u., respectively (Figure 3). Additionally, the distribution of the MEP for the control drug ranged from −4.035 to +4.035 a.u. The MEP analysis facilitated the identification of reactive sites by distinguishing electrophilic and nucleophilic regions within both the five compounds and the control drug. This was achieved through color gradients that represented positive, negative, or zero electrostatic potentials (Figure 3).
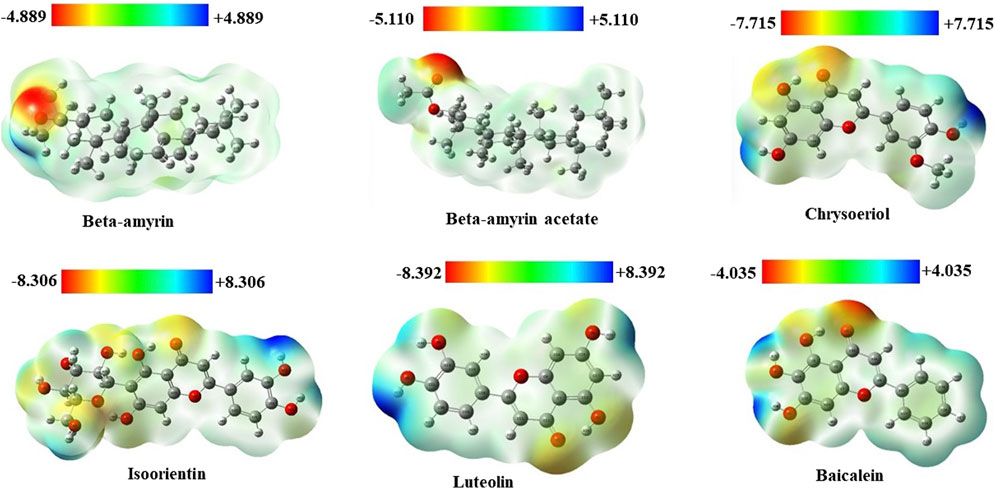
Figure 3. Molecular electrostatic potential (MEP) map of five selected compounds of V. cinerea along with control. Different colors indicate charge distribution such as blue for positive charge, red for negative charge, and green for neutral charge. Short electron density and poor interaction are identified in the blue region, while the red region indicates high electron density and potential interaction.
3.5 Infrared spectroscopy of the compoundsInfrared (IR) spectroscopy or Fourier transform infrared (FTIR) spectroscopy is utilized to analyze unknown substances by studying their molecular vibrations. The IR region spans the frequency range of the spectrum from 12,500 to 10 cm−1. In this analysis, we used the frequency between 0–4,000 cm−1 for five compounds such as- Beta-amyrin, Beta-amyrin acetate, Isoorientin, Chrysoeriol and Luteolin (Figure 4A). The vibrational frequency values were scaled by a factor of 0.9627 to ensure their accuracy aligns with experimental data compared to standard sources. The C-Ha stretching was observed at 3,008 cm−1 for Beta-amyrin, 2,940 cm−1 for Beta-amyrin acetate, 3,124 cm−1 for Isoorientin, 3,130 cm−1 for Chrysoeriol, and 3,122 to 3,026 cm−1 for Luteolin. The C-H vibrational frequency bands were at 3,025 cm−1 for Beta-amyrin, 20,952 cm−1 for Beta-amyrin acetate, and 3,032 cm−1 for Chrysoeriol, aligned with the experimental vibrational range. Beta-amyrin and Chrysoeriol also showed C = C stretching at 1,661 and 1,599 cm−1 vibrational frequencies, respectively. These results were significantly similar to the experimental results (Figure 4A; Supplementary Table S2). C = Ca stretching was found at 1,662 cm−1 for Beta-amyrin acetate and 1,560 cm−1 for Isoorientin. Beta-amyrin acetate and Chrysoeriol did not show O-H stretching in their spectra. In contrast, Beta-amyrin, Isoorientin, and Luteolin exhibited O-H stretching at frequencies of 1,739, 3,697 cm−1, and 3,695 to 3,645 cm−1, respectively, falling within the experimental value ranges. Beta-amyrin acetate and Chrysoeriol exhibited notable C=O stretching at frequencies of 1,754 and 1,589 cm−1, respectively, aligning closely with the experimental values of 1,822.47 and 1,651 cm−1. In contrast, Isoorientin and Luteolin showed C=O stretching at frequencies of 1,646 and 1,654 cm−1, respectively. Compared to the studied compounds, the experimental and scaled vibrational frequency values of the control drug, Baicalein, were found to be similar, with only a few discrepancies (Figure 4A; Supplementary Table S2).
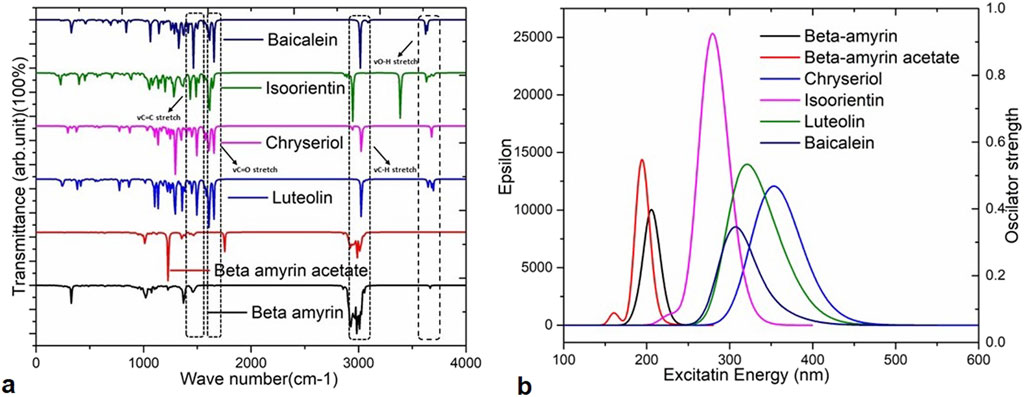
Figure 4. Vibrational frequencies and UV-Visible spectra of the selected five compounds of V. cinerea and the control drug. (A) Values of vibrational frequency (C = O, O–H, C = C and C–H stretches) are indicated by different arrows. (B) The UV-Visible spectra display the maximum absorbance (epsilon; λmax) values, excitation energies, and oscillator strengths of the selected compounds. Peaks of different colors correspond to specific compounds.
3.6 UV-visible spectral properties of the compoundsIn this study, time-dependent density functional theory (TD-DFT) calculations using the B3LYP/631G (d,p) method were performed for each compound to elucidate the electronic transitions and spectra within the molecules. The energy states, wavelengths (nm), excitation energies, transition configurations, and oscillator strengths for each compound are presented in Supplementary Table S3 and the UV-visible spectra are illustrated in Figure 4B. In this investigation, absorption wavelengths were observed between 0 and 1,000 nm in the UV-vis region. The molecules showed maximum absorption wavelengths (λmax) corresponding to electron charge transfer from S0→S1 states, specifically 357.70 nm (λmax = 0.6665 H→L) for Chrysoeriol and 352.26 nm (λmax = 0.65851 H→L) for Luteolin.
Their respective oscillator strengths were 0.2422 f and 0.1293 f. Both compounds exhibited low excitation energies of 3.466 and 3.5197 eV, respectively, indicating increased potential for chemical reactivity due to reduced HOMO-LUMO gaps (Supplementary Table S3). Isoorientin exhibited λmax at 237.31 nm with a low excitation energy of 4.4360 eV and an oscillator strength of 0.6252 f. In contrast, Beta-amyrin showed the highest excitation energy (6.010 eV), with a wavelength of 206.27 nm and an oscillator strength of 0.2402 f (Figure 4B). Therefore, it can be inferred that Beta-amyrin demonstrated lower chemical reactivity compared to other compounds studied in this research. However, the control drug, Baicalein, showed a λmax at 354.51 nm with a low excitation energy of 4.0297 eV and an oscillator strength of 0.0993 f, closely resembling the values for Chrysoeriol and Luteolin (Figure 4B; Supplementary Table S3).
3.7 Drug likeness, pharmacokinetic and toxicological properties of the compoundsThe drug-likeness and absorption, distribution, metabolism, and excretion (ADME) profiles of the five compounds extracted from V. cinerea are detailed in Table 4. Each compound adhered to Lipinski’s “rule of 5”, with a molecular weight below 500 Da. Among them, Beta-amyrin and Beta-amyrin acetate demonstrated strong lipid solubility (4.74 and 5.19 Log P, respectively), while Chrysoeriol showed moderate solubility with a score of 2.44 Log P. In contrast, Luteolin and Isoorientin exhibited lipid insolubility with Log P values of 1.86 and 2.12, respectively, in the ADME structure-activity relationship. Among these compounds, Chrysoeriol and Luteolin demonstrated significant gastrointestinal (GI) absorption. Additionally, the compounds showed varying degrees of synthetic accessibility: Beta-amyrin (6.04), Beta-amyrin acetate (5.98), Chrysoeriol (3.06), Isoorientin (5.04), Luteolin (3.02) and Baicalein (3.02). The molar refractivity of all compounds fell within the specified range outlined in Lipinski’s criteria. The Pa values of the screened compound were consistently higher than those of the control drug (Table 4).
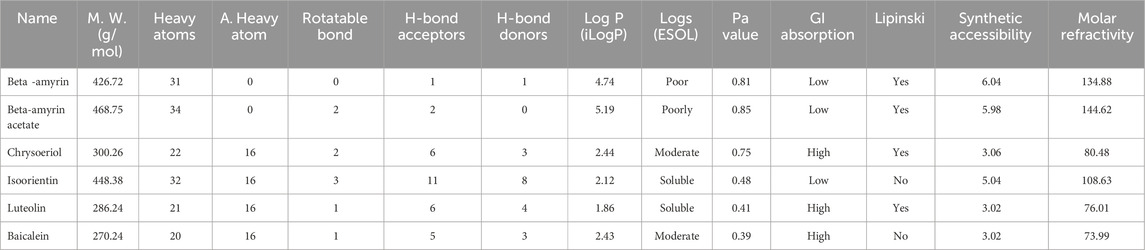
Table 4. Drug likeness and pharmacokinetic (ADMET) properties of the compounds of V. cinerea.
To assess the toxicity of the five selected compounds, we employed Protox III and AdmetSAR as in silico toxicity testing tools. The analysis revealed that each compound was inactive regarding hepatotoxicity and cytotoxicity. However, the results for mutagenicity, immunotoxicity, and carcinogenicity varied among the compounds (Supplementary Table S4). For instance, Beta-amyrin, Beta-amyrin acetate, and Chrysoeriol were found to be non-mutagenic. Conversely, Isoorientin and Luteolin exhibited potential mutagenic properties. Based on immunotoxicity data, Beta-amyrin and Beta-amyrin acetate were identified as immunotoxic, while Isoorientin, Luteolin, and Chrysoeriol were found to be non-immunotoxic. Furthermore, Beta-amyrin acetate and Luteolin were classified as carcinogens, whereas Beta-amyrin, Chrysoeriol, and Isoorientin showed no carcinogenic activity.
According to the acute oral toxicity (AOT) results, all the compounds were classified as Category III, indicating their suitability for oral administration. On the other hand, the control drug showed a mixed toxicity profile in both Protox III and AdmetSAR analyses (Supplementary Table S4).
3.8 Molecular dynamics of the NSP1 and phytocompoundsA molecular dynamics simulation (MDS) was conducted over 200 ns to assess the stability and strength of interactions between NSP1 and the five selected compounds along with control drug Baicalein. As depicted in Figure 5, Beta-amyrin, Isoorientin, and Chrysoeriol exhibited fluctuations ranging from 1 to 5 Å. In contrast, Beta-amyrin acetate and Luteolin and Baicalein displayed broader fluctuations, ranging from 1 to 9 Å. One of the key findings of this study is that none of the compounds exhibited fluctuations from the binding pocket regions of NSP1 throughout the 200 ns trajectories except control (Supplementary Material S2). However, Beta-amyrin acetate and Luteolin exhibited higher RMSD values (Figure 5), suggesting fluctuations even though the binding to NSP1 pocket regions did not alter the pocket conformation. To understand the reasons behind these higher RMSD values, we analyzed the RMSF curves. The RMSF curves of the five compounds showed variations, but notably, the regions (150–250) where the compounds strongly bound exhibited fluctuations lower than 2 Å (Figure 6 and Supplementary Material S2). From the 200 ns RMSF trajectories, it was evident that certain other parts of the protein chain had higher fluctuations, affecting the overall RMSD. To obtain more accurate insights into the elevated RMSD and RMSF values, we conducted a control molecular dynamics simulation for NSP1 without any ligand compounds and a control compound (Baicalein). This control simulation revealed that the NSP1 exhibited higher RMSF values on its own, suggesting inherent instability in certain regions of the crystallographic protein. Additionally, these regions are implicated in the observed increase in RMSD values (Supplementary Figure S1). The RMSF curve for Baicalein exhibited similar fluctuations to the control compound, although the control compound showed greater fluctuation at the beginning of the curve (Figure 6). The overall RMSD of NSP1 fluctuated up to 6 Å. However, the binding of Chrysoeriol and Isoorientin with NSP1 demonstrated lower RMSD values, indicating that the complexes formed with these compounds were more stable than the unbound form of NSP1.
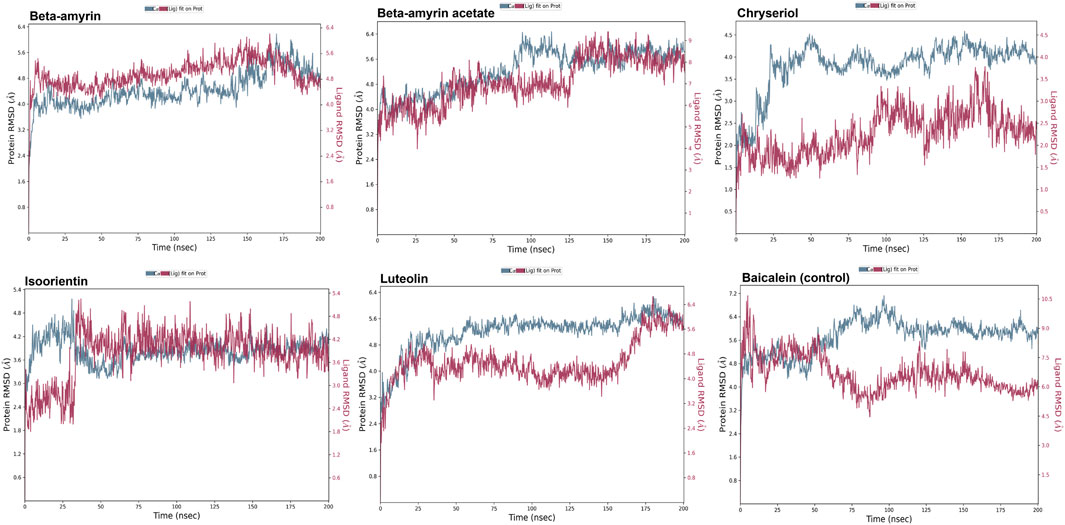
Figure 5. RMSD value of the studied compounds demonstrated the overall stability of protein-ligand complex throughout the 200 ns trajectory.
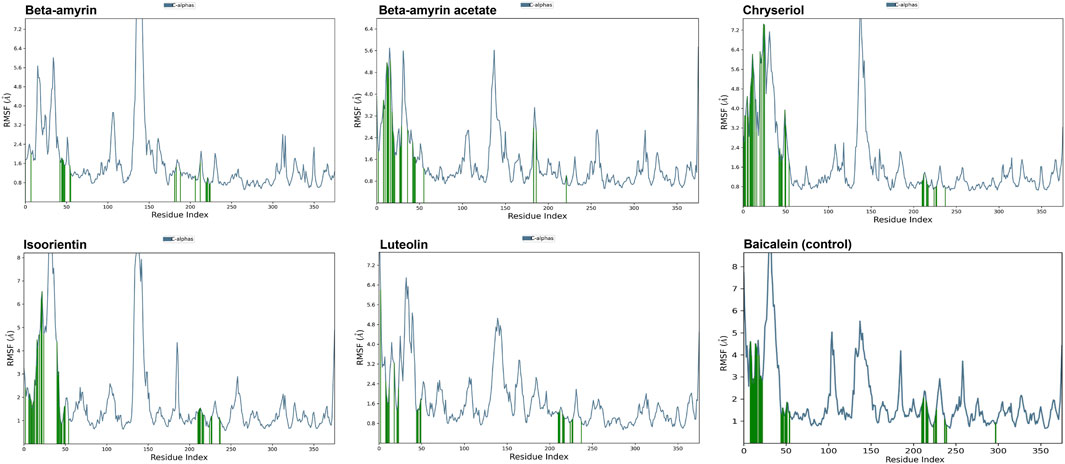
Figure 6. RMSF value of the studied compounds demonstrate the protein stability throughout the 200 ns trajectory.
Compounds Beta-amyrin and Beta-amyrin acetate exhibited strong non-covalent interactions with NSP1. In contrast, the other three compounds, Luteolin, Chrysoeriol, and Isoorientin, displayed strong covalent interactions with the NSP1 binding pockets amino acids that fall in the 150–250 regions (Figures 7, 8). The MDS results indicated that Luteolin, Chrysoeriol, and Isoorientin could inhibit the function of NSP1 of DENV-2, as they demonstrated strong covalent interactions throughout the trajectory periods (Supplementary Material S2). Comparison of the dynamics trajectories of the five compounds and the control revealed that Luteolin, Chrysoeriol, and Isoorientin outperformed the control in all MDS parameters. While the control compound, Baicalein, remained bound to the same binding pocket as the other studied compounds, it showed significant displacement in the pocket regions as the simulation progressed. In contrast, none of our studied compounds exhibited such displacement during the simulation period (Supplementary Material S2). The higher RMSD fluctuations of up to 10 Å for the control further confirm that the five studied compounds performed better than the control (Figure 5). To gain a deeper understanding of these five compounds, the dual method (post-MDS MM-GBSA) was applied to confirm the efficiency of binding and stable interactions between the ligands and target proteins.

Figure 7. The interaction fraction indicates that these residues involved in protein-ligand contacts strongly.
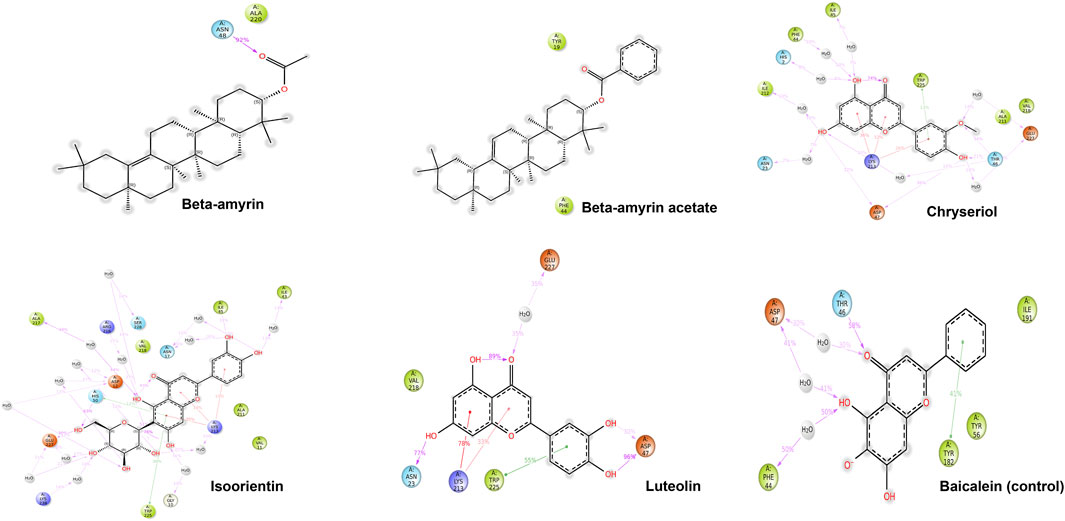
Figure 8. The detailed view of both covalent and non-covalent interactions between the receptor and the ligands over the 200 ns trajectories.
3.9 Post MDS thermal MM-GBSAThe MM-GBSA method was employed to estimate the free energies released from the interaction between NSP1 of DENV-2 and the compounds of V. cinerea. The most critical parameter, Gibbs free energy during binding (r_psp_MMGBSA_dG_Bind), demonstrated a negative value for each ligand-protein complex (Figure 9). A negative free energy indicates that the formation of the complex releases more energy than it consumes, signifying that the interaction between the compounds and NSP1 occurred spontaneously. Compared to Baicalein, all five compounds demonstrated stronger spontaneous interactions with NSP1. The next critical parameter was the release of electrostatic energy upon binding (r_psp_MMGBSA_dG_Bind Coulomb). In this parameter, Isoorientin released the highest free electrostatic energy upon binding with NSP1, revealing direct electrostatic interactions between the compounds in the bound state versus the unbound state. This parameter supports the MDS results, where Luteolin, Chrysoeriol, and Isoorientin exhibited better electrostatic interactions than both Beta-amyrin and the control.
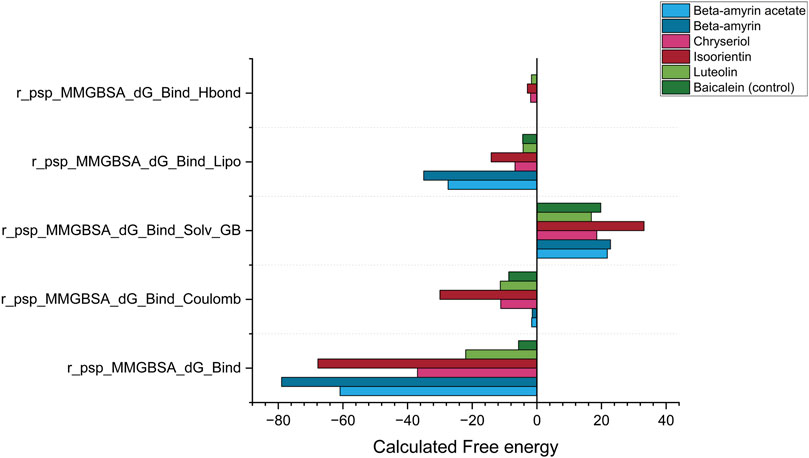
Figure 9. Post simulation thermal MM-GBSA analysis for NSP1, five phytocompounds of V. cinerea and control drug (Baicalein). The total MM-GBSA binding free energy was calculated, considering the Gibbs free energy, electrostatic energy (coulombic), generalized born electrostatic solvation energy, hydrogen bonding (H-bond) and lipophilic effects during binding to the receptor NSP1.
The next key parameter was the generalized Born electrostatic solvation energy (Bind Solv GB). The solvent molecules had a positive effect on the energetics of both the control and all studied compounds. A positive value for electrostatic solvation energy indicated that these compounds did not readily dissolve in water. Finally, two other critical parameters, the hydrogen bonding (H-bond) and lipophilic effects on the binding free energy of the system, were calculated as negative (Figure 9). Comparing all five parameters described the reasons for the suitable covalent and non-covalent interactions with NSP1. The energetically favorable interactions illustrated that these compounds can disrupt the biological function of NSP1.
4 DiscussionThe discovery and development of new drugs are both costly and time-consuming. A strategic computational approach to rational drug design has demonstrated its value by assessing the potential of selected phytochemicals before wet-lab experiments. This approach predicts their pharmacodynamic and pharmacokinetic properties, such as electrostatic potential, drug-likeness, oral bioavailability, efficacy, toxicity risk, and other relevant characteristics. In-silico screening and prediction of compounds with favourable properties significantly reduce research costs and time. This study identified potential inhibitors in V. cinerea for NSP1, a key virulence factor of DENV-2. Extracts from V. cinerea, a plant traditionally used for its medicinal properties (Alara et al., 2018; Joshi et al., 2021; Singh et al., 2021), were examined for their antiviral potential. We evaluated the inhibitory potential of five selected compounds such as Beta-amyrin, Beta-amyrin acetate, Chrysoeriol, Isoorientin, and Luteolin which demonstrated strong interactions with NSP1 of DENV-2 in virtual screenings, suggesting significant antiviral properties.
To compute the drug potential of the compounds under study, all active phytoconstituents were tested through thermodynamic calculations. This method allowed us to anticipate the reaction kinetics and chemical stability of the selected compounds. In this study, all calculated energies were found to be negative, which indicated the spontaneous binding potency of selected compounds with NSP1 and their high values s
留言 (0)