
記住我


Overweight and obesity are defined as abnormal or excessive fat accumulation that may impair the health of individuals (1). Body mass index (BMI) is a simple index of weight for height that is commonly used to classify overweight and obesity in adults and also stipulates the most useful population-level measure of overweight and obesity as it is the same for both sexes and for all ages (2, 3). A high BMI can designate high body fatness and is used for screens for weight categories that may lead to health problems; its range is differently categorized: Its range is divided into four categories: underweight (BMI less than 18.5), healthy weight (18.5 to 24.9), overweight (25.0 to 29.9), and obese (30.0 or higher) (4).
Currently, overweight and obesity are public health concerns, with obesity being one of the leading risk factors for premature death and 8% of global deaths being ascribed to obesity (5, 6). In most high-income countries, approximately two-thirds of adults are classified as overweight or obese; compared to the regions of South Asia and Sub-Saharan Africa, where the rate is closer, around one in five adults have a BMI greater than 25 (5). In addition, both obesity and overweight are associated with amplified disease-specific morbidity, 4.0 million deaths globally, and approximately 36.3 million YLLs, and cost a total of $4.32 trillion worldwide, $3.8 billion in health expenditure in Saudi Arabia, and $552.31 million in Ethiopia (7–12).
Factors related to the problem of overweight and obesity are unhealthy lifestyle habits, such as a sedentary lifestyle, smoking, and eating high-calorie, low-nutrient foods and beverages. Additionally, socioeconomic and health conditions can raise the overweight and obesity levels of individuals (13–16). Therefore, limiting unhealthy foods (refined grains and sweets, potatoes, and processed meat) and beverages (sugary drinks); increasing physical activity; limiting television, screen time, and other “sit time”; improving sleep; and reducing stress are all recommended as ways to prevent, treat, and control the health consequences of being overweight and obese (17, 18).
A lot of effort has been made to alleviate the burden of overweight and obesity. The World Health Organization (WHO) calls on all stakeholders to take action at the global, regional, and local levels to improve diets and physical activity patterns at the population level and recognizes that non-communicable diseases (NCDs) are a major challenge for sustainable development goals in the 2030 Agenda for Sustainable Development (19). The Ethiopian government has worked on the prevention and control of adult overweight and obesity through encouraging physical activity, promoting fruit intake and whole grain intake, educating on reducing processed meat intake, and providing mental health support (11). Even though many efforts were made on reducing overweight and obesity, the magnitude and morbidity of overweight and obesity are still increasing in developed and developing countries, including Ethiopia (20–22).
Overweight and obesity are complex issues caused by genetic, behavioral, cultural, and environmental factors. Changes in policies within the government, social environment, and cultural norms are required, in addition to individual behavioral changes. Most nutritional programs in Ethiopia focus on childhood undernutrition. Identifying factors influencing overweight and obesity is crucial for preventing and managing these developing public health issues in Ethiopia (23). Therefore, this study was conducted to further investigate the factors influencing overweight and obesity among adults in Ethiopia using representative data.
Methods and materialsStudy design, setting, and periodThe source of this study is the nationally representative 2016 Ethiopia Demographic and Health Survey (EDHS). Ethiopia is located between 3° and 15° North latitudes and 33° and 48° East longitudes. The country has nine regional states [Amhara, Oromia, Tigray, Benishangul-Gumuz, Somali, Afar, Harari, Southern Nations Nationalities and Peoples (SNNP), and Gambella] and two city administrations (Addis Ababa and Dire Dawa) (24, 25). The survey was conducted in a nationally representative sample and provided estimates at national and regional levels for rural and urban areas.
Population and samplingThe EDHS used a two-stage cluster sampling design with rural–urban regions as strata. In the first stage, enumeration areas (EAs) were selected with probability proportional to EA size, with independent selection in each sampling stratum. In the second stage, an appropriate number of households per cluster were selected with an equal probability of systematic selection. This study used a total sample of 39,749 adults in the analysis that was extracted from the EDHS survey. Further information regarding the sampling technique and questionnaire, in general about the survey, can be accessed from the EDHS 2016 report (26). Datasets for adults were downloaded from the MEASURE DHS website.
Study variables and measurementsThe outcome variables were as follows: underweight, normal, overweight, and obesity, based on the BMI measurement of adult people. Overweight and obesity are categorized based on the WHO Classification of BMI: BMI = weight in kilograms divided by height in meters squared. Individuals were classified as overweight if their BMI is 25.0–29.9 kg/m2 and as obese if their BMI is 30 kg/m2 or higher (27). The independent variables included demographic characteristics and behavior-related characteristics of adult people. In addition, the community-level factors like region and residence were considered as explanatory variables.
Statistical analysisFrequency distribution analysis was carried out. Data were analyzed using STATA version 14 statistical software. The data were weighted using sampling weight, primary sampling unit, and strata before any statistical analysis to ensure the representativeness of the survey and to consider the sampling design when calculating standard errors to get reliable statistical estimates.
To determine the relationship between household wealth index and overweight and obesity as well as to control confounders, logistic regression assumptions (chi-square and multicollinearity) were tested. Because members in a cluster shared a trait, the assumptions of the independence of observations and equal variance across clusters were broken. To ensure the accuracy of the standard error and unbiased estimate, it is important to overcome the violated independence assumption and take into account the variability between clusters in multilevel advanced statistical modeling.
Variables having a p-value of 0.25 were candidates for the individual level (Model II), community level (Model III), and the final model (Model IV). The mixed-effect model with the lowest Akaike and Bayesian Information Criteria (AIC and BIC) was chosen. A factor was designated as a significant predictor of obesity and overweight if its p-value was less than 0.05. The odds ratio was used to measure how strong the link was, with a 95% confidence interval. The estimation of the association between the BMI (underweight, normal, overweight, and obesity) and explanatory variables was performed using the fixed-effects model. An intra-cluster correlation coefficient (ICC) with standard deviation was employed to measure cluster variance. A null model (a model without independent variables), a model taking into account only individual-level factors, a model taking into account community-level variables, and a fourth model taking into account both individual and community-level variables were also fitted. The comparison of the multilevel-ordered logistic regression models was checked using the median odds ratio (MOR) and proportional change in variance (PCV). The best-fitting model among the fitted models was ultimately chosen using the AIC and BIC.
ResultsCommunity-level, household, and individual-related characteristics of the study participantsOut of a total of 41,357 adults, 39,749 were included in this study. Approximately 5,788 (14.56%), 5,346 (13.5%), 4,888 (12.3%), 4,604 (11.58%), and 4,358 (10.96%) adults were included from the Oromia, SNNPR, Somalia, Amhara, and Tigray regions, respectively. More than two-thirds [n = 32,581 (81.97%)] of the study participants resided in rural areas. The majority (n = 29,052 adults) had no formal education. The majority of the study participants were men. Nearly one-third of the participants had the poorest wealth index. About n = 38,046 (95.7%) had no health insurance coverage. The majority of the participants [n = 20,872 (52.5%)] were not working (Table 1).
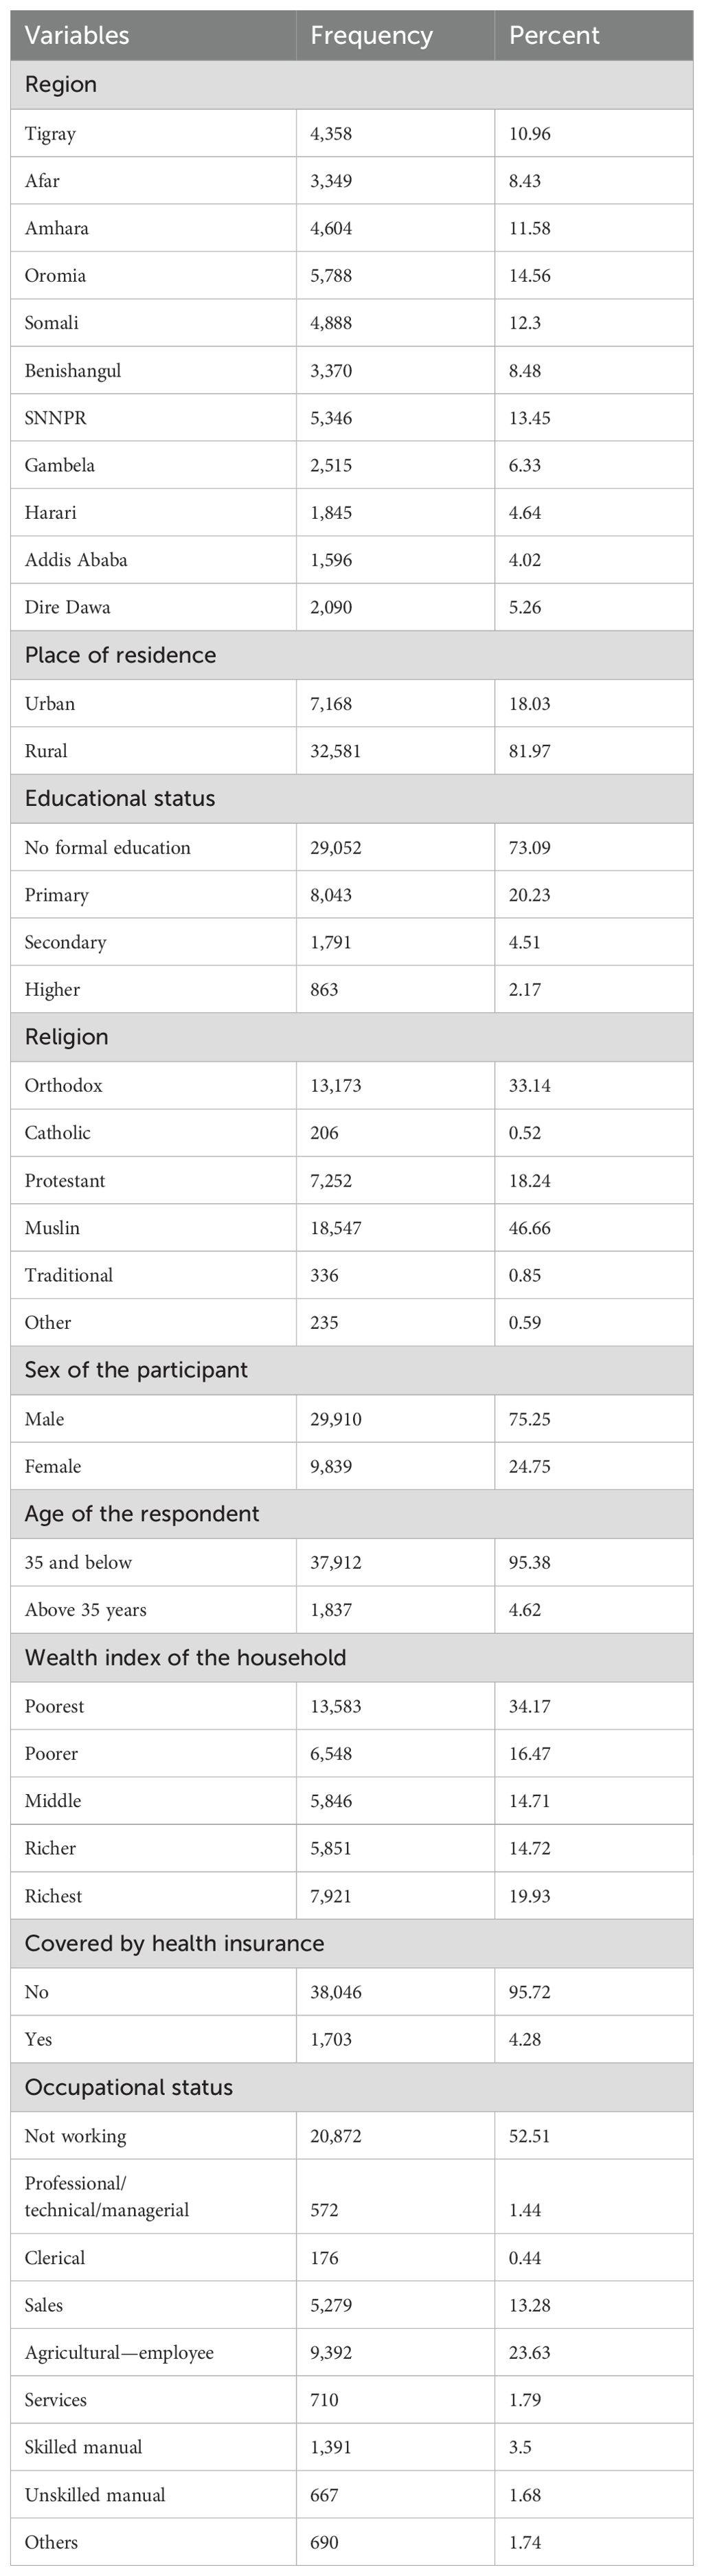
Table 1. Community-level, household, and individual-related characteristics of the study participants.
Behavioral characteristics of the study participantsAmong the total adults, nearly one-third [n = 11,972 (30.1%)] of the study participants had a history of alcohol consumption. A total of 513 (1.3%) study participants were smokers. A total of 4,940 (12.3%) adults had a history of chewing khat. More than half [n = 26,546 (66.78%)] were not working at the time of data collection. Nearly two-thirds of the n = 26,947 (67.8%) study subjects were sexually active 4 weeks before the data collection time (Table 2).

Table 2. Behavioral characteristics of the study participants.
The magnitude of BMI classificationsOut of the total n = 39,749 Ethiopian adult populations, n = 9,395 (23.6%), n = 25,844 (65%), n = 3,360 (8.4%), and n = 1,149 (2.95%) had underweight, normal, overweight, and obese BMI status, respectively (Figure 1).
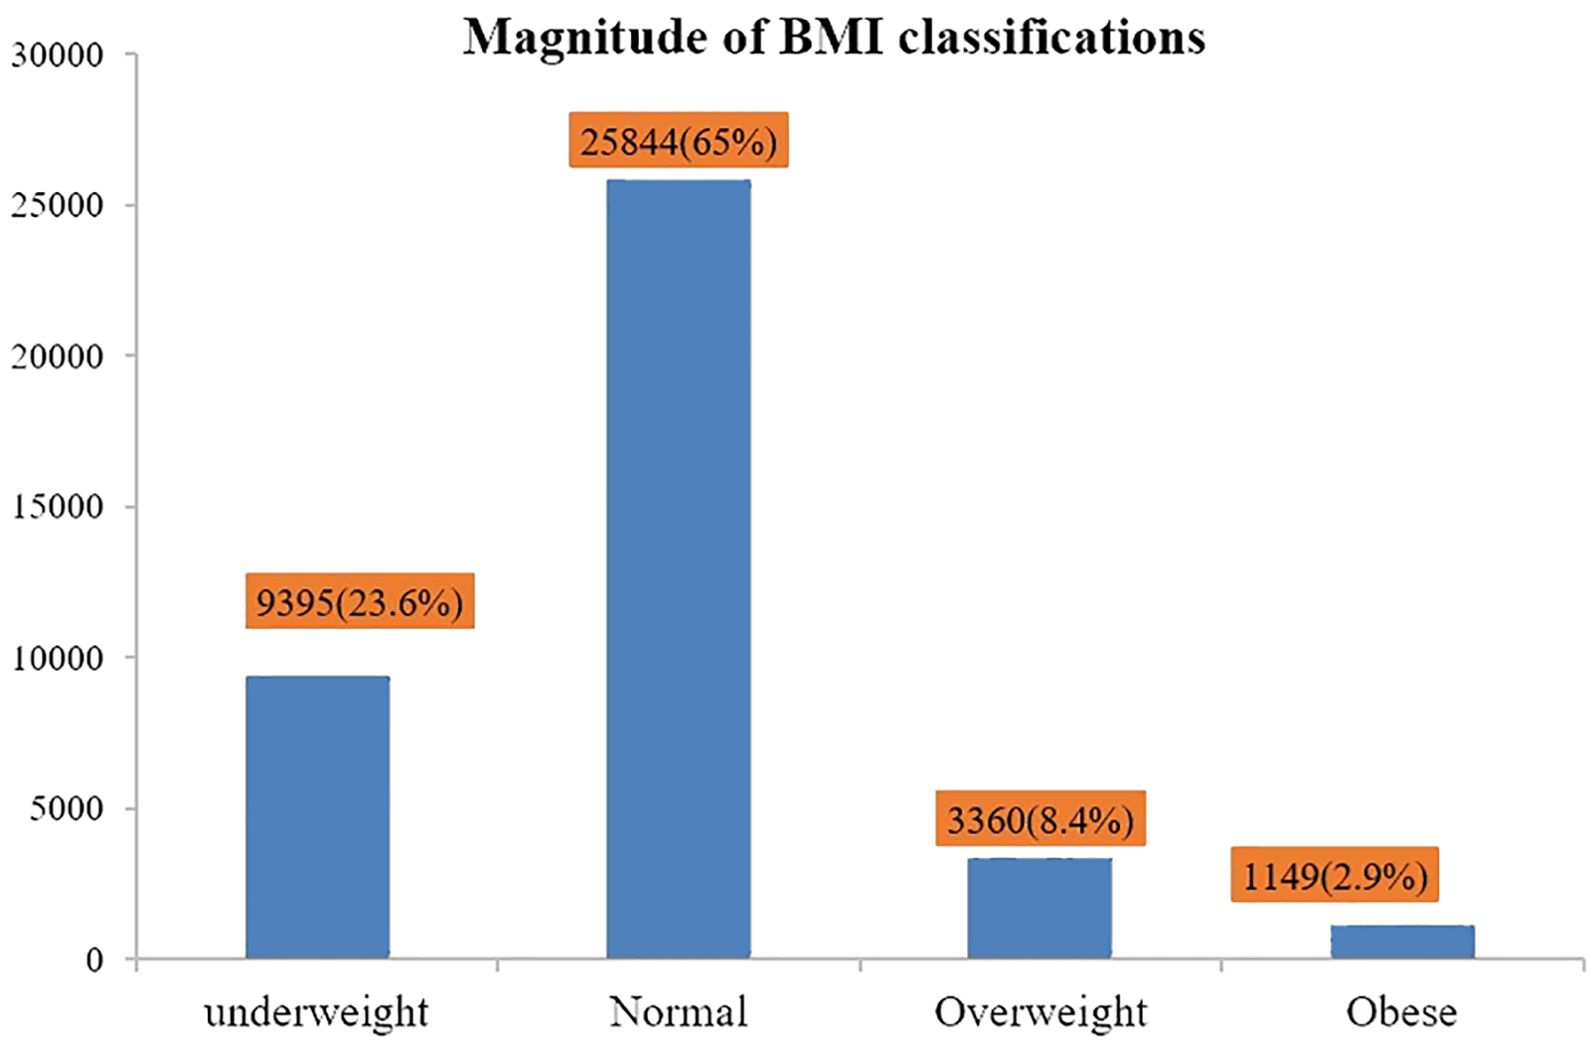
Figure 1. Magnitude of outcome variables (underweight, normal, overweight, and obesity).
Distribution of BMI classification among the study participantsAlmost a quarter [n = 1,743 (24.3%)] of rural residents were overweight. Additionally, n = 1,103 (11.2%) of women were also overweight. Almost 1 in 10 [n = 2,503 (9.0%)] adults over the age of 35 were overweight. Furthermore, 1 out of every 10 [n = 871 (11.0%)] richest adults was obese. Of the n = 513 smokers, 30 (5.8%) were obese (Table 3).
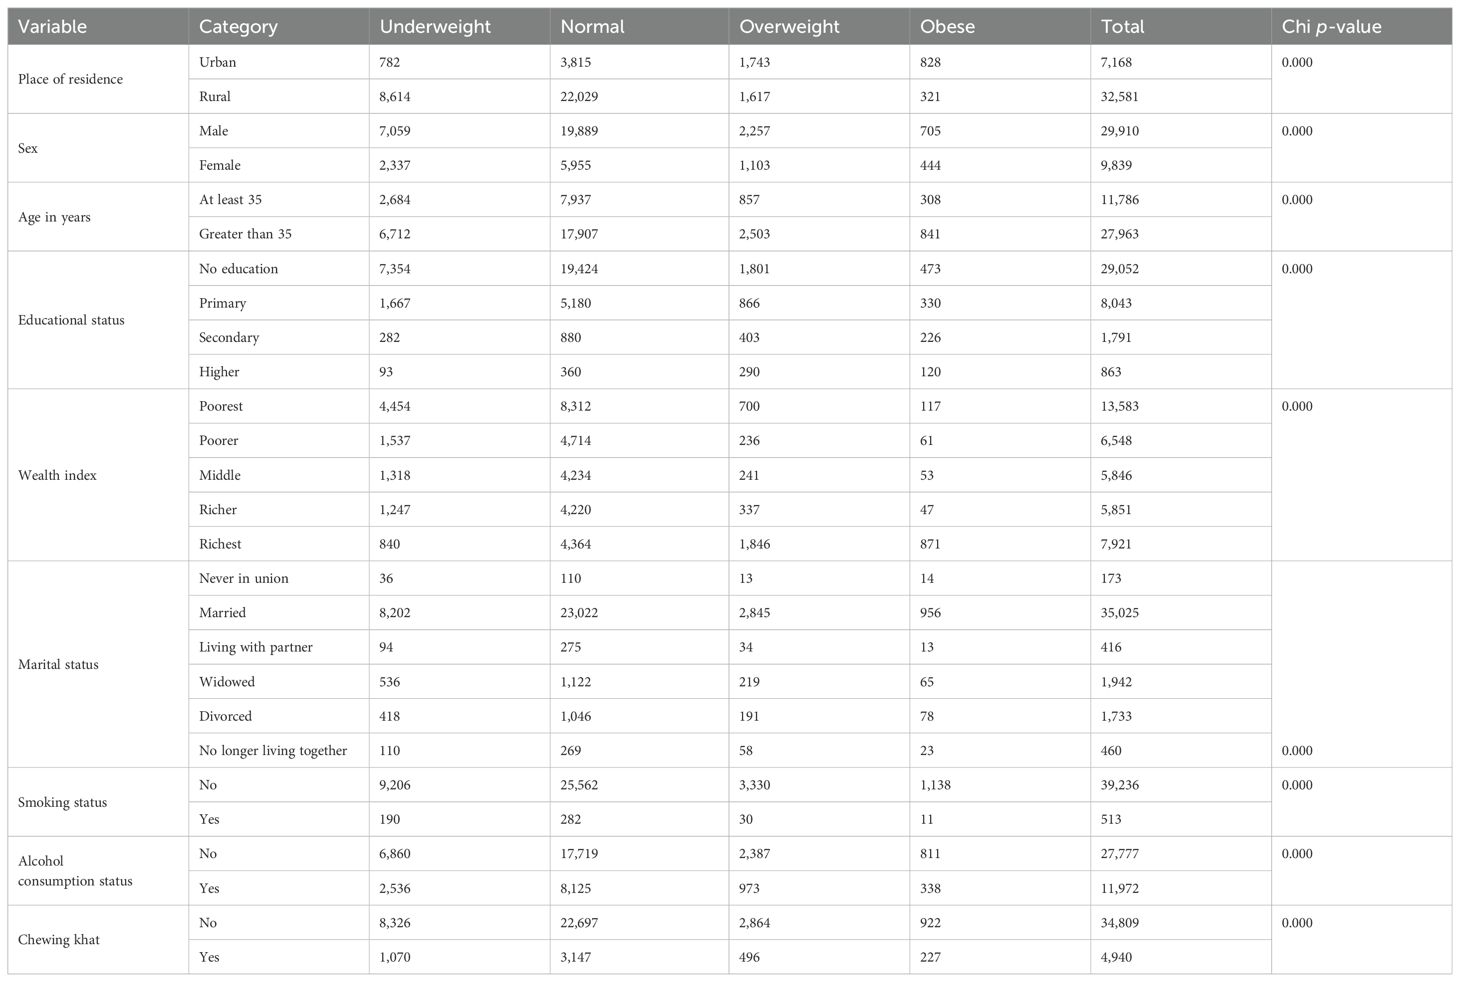
Table 3. The distribution of BMI classification and relationships with factors among study participants.
Factors associated with overweight and obesityThe bivariable analysis revealed that variables having a p-value less than 0.2 were transformed into multilevel multivariable ordinal logistic regression. Finally, it resulted in significant associations between predictor variables, including smoking, sex, marital status, educational status, wealth index, residence, and region, and the dependent variable (overweight and obesity) (Table 4). Accordingly, those adults who had a habit of smoking cigarettes were 47% less likely to be overweight or obese as compared to adults who did not smoke (POR = 0.53; 95% CI: 0.42–0.67). In addition, those adults who reside in rural areas were 52% less likely to be overweight or obese than their counterparts (POR = 0.48, 95% CI: 0.43–0.54).
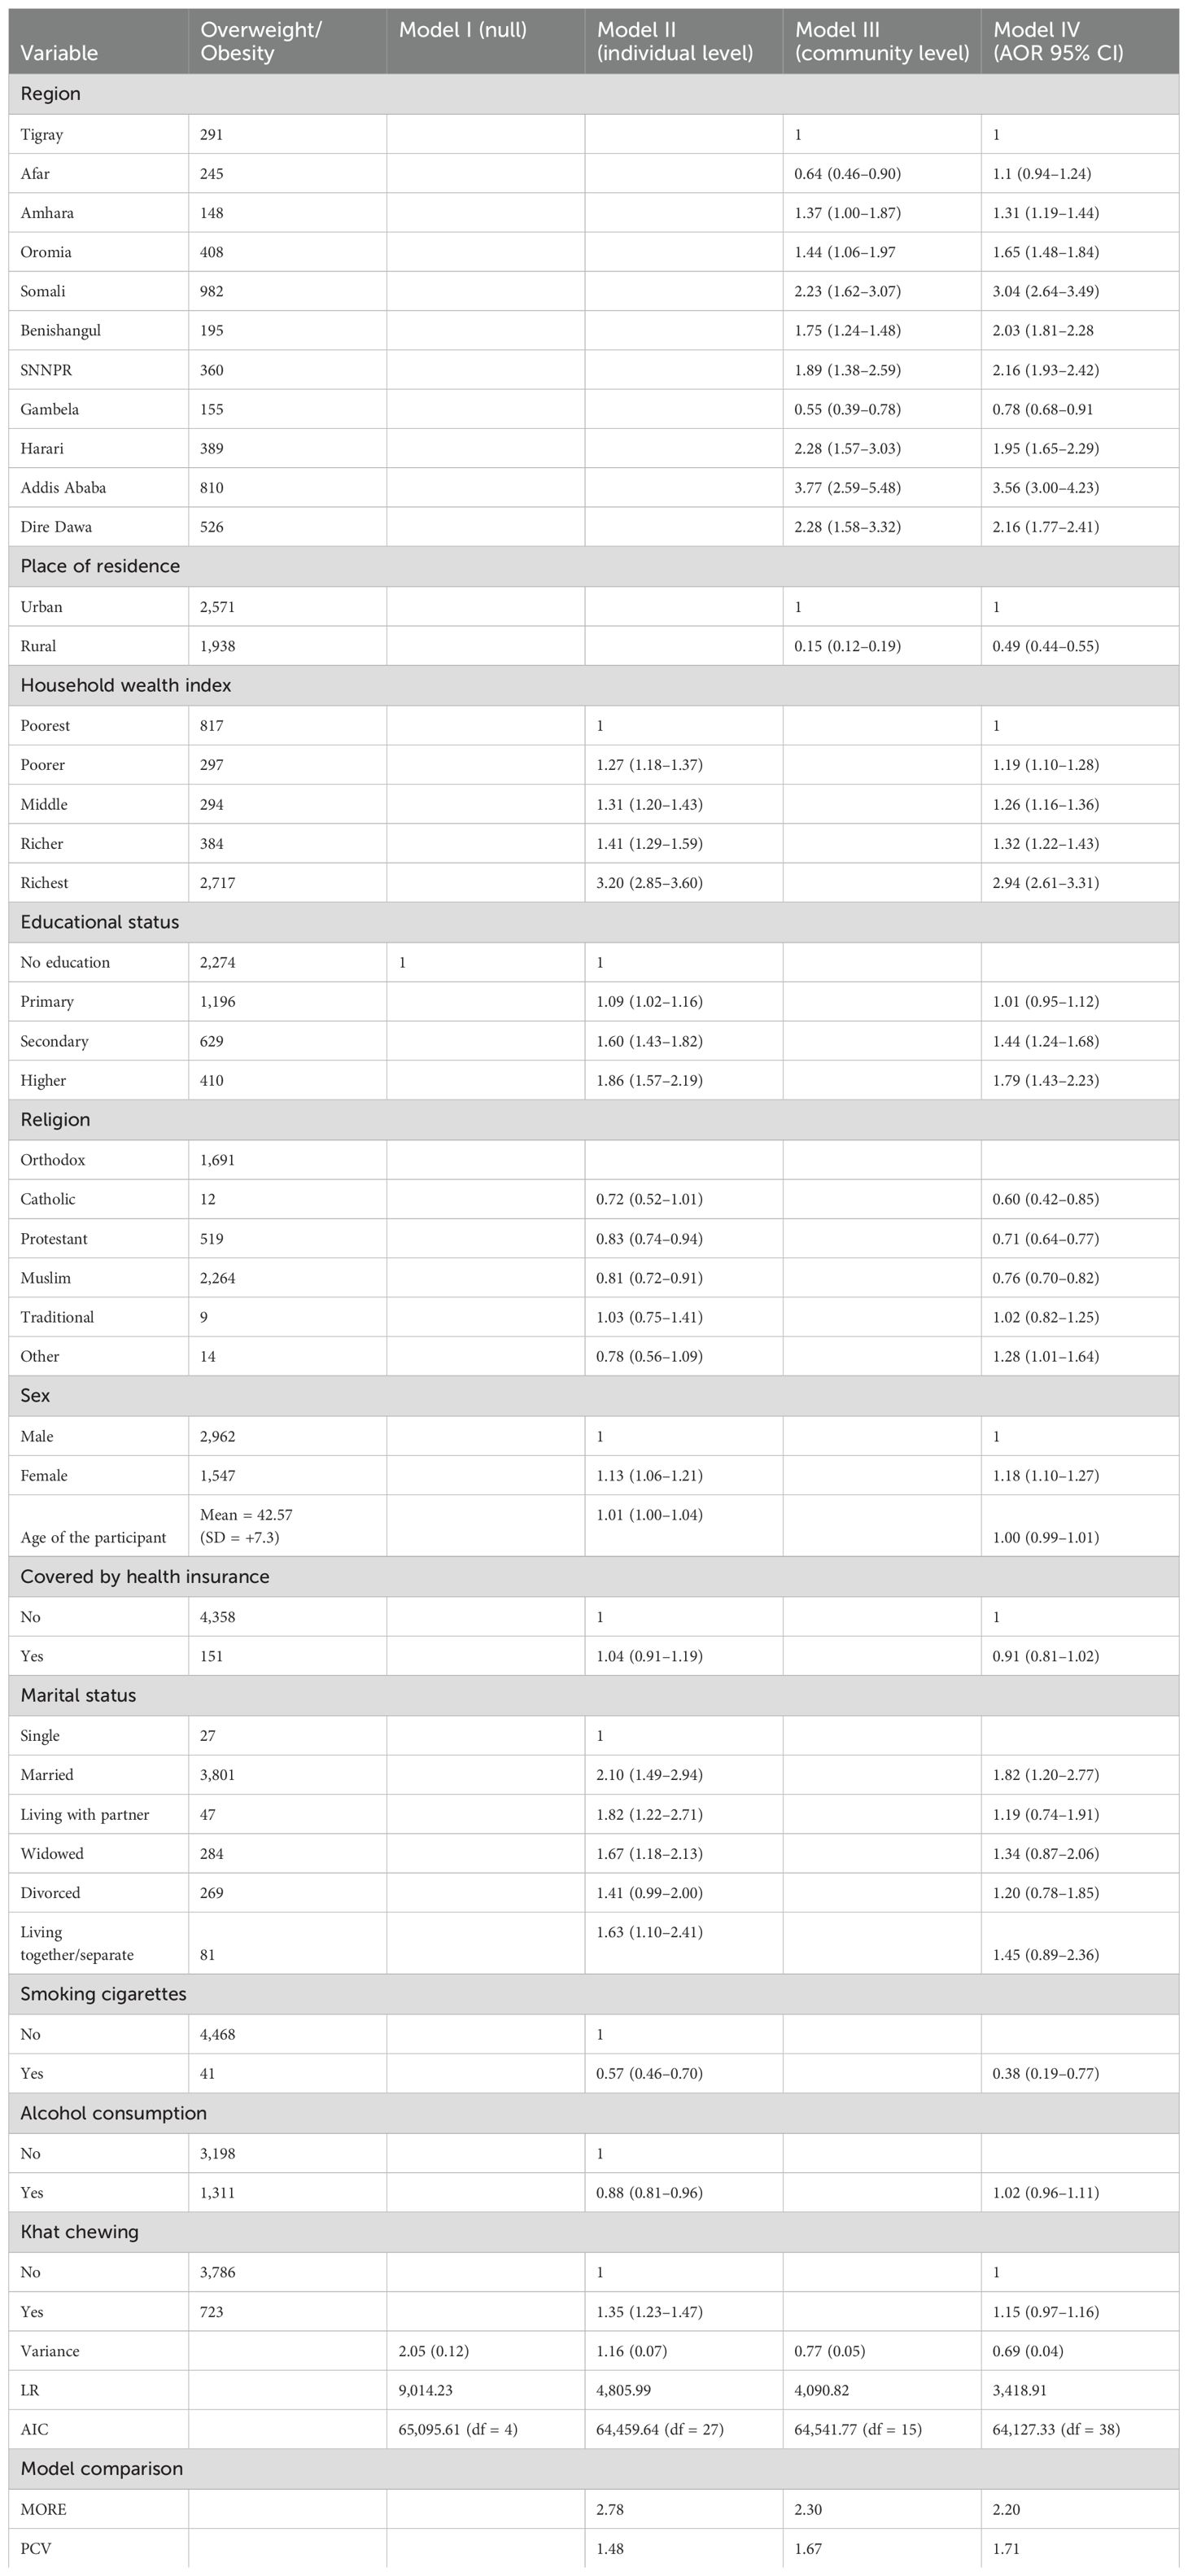
Table 4. A multilevel analysis of overweight and obesity determining factors.
In another way, adult households with a wealth index of poorer, middle, richer, and richest were 1.22, 1.30, 1.35, and 3.13 times more likely to be overweight or obese compared to adult households with a wealth index of poorest (POR = 1.22, 95% CI: 1.13–1.31; 1.30, 95% CI: 1.20–1.40; 1.35, 95% CI: 1.25–1.47; and 3.13, 95% CI: 2.79–3.51), respectively. Moreover, adults whose educational status was secondary and diploma and above were 1.42 and 1.78 times more likely to be overweight or obese compared to adult households whose educational status is no formal education (POR = 1.42, 95% CI: 2.23–1.64 and 1.78, 95% CI: 1.44–2.21), respectively. Furthermore, female adults were 1.21 times more likely to be overweight or obese compared to adult households who were male (POR = 1.21, 95% CI: 1.13–1.30). Finally, the study revealed that the odds of being overweight or obese were 1.95 times higher among married adults than unmarried adults (POR = 1.91, 95% CI: 1.26–2.90) (Table 4).
DiscussionThis study was conducted to determine the factors affecting overweight and obesity among adults in Ethiopia using representative data. According to this study, the overall magnitude of overweight and obesity among adult residents in Ethiopia was 8.5% (95% CI: 8.2% to 8.7%) and 2.9% (95% CI: 2.7% to 3.1%), respectively. The final model of multivariable ordinal logistic regression analysis indicated that predictor variables including smoking, sex, marital status, educational status, wealth index, residence, and region were significantly associated with overweight and obesity among adult households. The study revealed that, among overweight and obese adults, approximately 1.0% (95% CI: 0.6% to 1.2%) of them were cigarette smokers.
While some studies have shown no significant association between smoking status and obesity or overweight, others have suggested that smoking may significantly affect obesity or overweight (28–30). Our final model of multivariable analysis explicitly pointed out that adults’ habit of cigarette smoking was found to be associated with obesity/overweight. Accordingly, those adults who had a habit of cigarette smoking were 47% less likely to develop overweight or obesity as compared to adults who did not smoke. This finding is consistent with a study carried out in different regions of the world to determine the association between smoking and overweight or obesity (29, 31–33). One plausible explanation related to these facts could be that those who smoke cigarettes are less likely to have physical exercise, which inevitably leads those adults to experience overweight or obesity (29, 34–36).
The study also revealed that adult households with a wealth index of poorer, middle, richer, and richest had 1.22, 1.30, 1.35, and 3.13 times more likely to be overweight or obese compared to adult households with a wealth index of poorest. This finding is in line with similar studies that indicate that as the wealth index tertile rises, adults are more likely to be overweight or obese (37–39). This is explicitly related to the fact that as people’s income rises, sedentary lifestyles, such as traveling by automobile and eating a nutritious diet, may become more common at the individual or household levels; these activities increase the likelihood of developing overweight and obesity (40, 41). On this occasion, even though they are busy managing their wealth, they have the ability to consume the kind of food they need, and move from one place to another by car, and adults in this situation still need to think about healthy eating, physical activity, maintaining a healthy weight, managing stress, and getting enough quality sleep.
The study also depicted that adults whose educational status was secondary and diploma and above were 1.42 and 1.78 times more likely to be overweight or obese compared to adult households whose educational status is no formal education, respectively. This study is consistent with other research showing the relationship between educational attainment and the likelihood of being overweight or obese (42–44). One possible explanation could be that as educational attainment rises, the likelihood of earning a high income and residing in an urban area also rises. As a result, living in an urban area and earning a high income may expose adults to a sedentary lifestyle such as moving place to place by transportation, as well as increase the probability of consuming high-calorie food and drinks (45, 46).
In addition, our study revealed that female adults are 1.21 times more likely to be overweight or obese compared to male adult households. Our study is consistent with a study that revealed that the probability of being overweight or obese is higher among women (47–49). This is explicitly related to the fact that, most of the time, overweight and obesity are caused by individuals having a propensity to overeat and engage in prolonged periods of inactivity. Therefore, frequent consumption of junk food and snacks, eating in a hurry, eating regularly, and a sedentary lifestyle are all potential causes of obesity and overweight in women (50–53).
Moreover, our study revealed that, according to this study, the place where adults reside was found to be statistically significant to outcome variables. Accordingly, those who reside in rural areas were 52% less likely to develop overweight or obesity than their counterparts. This finding is consistent with studies conducted in China (54, 55). One of the possible justifications related to this could be that those who reside in rural areas may have the opportunity to consume organic and healthy food, which inevitably results to them not being prone to overweight or obesity. Moreover, the majority of outdoor activities in which rural dwellers engage undeniably play a prominent role in burning calories, thereby hindering obesity or overweight (55, 56).
Furthermore, according to this study, marital status of adults was one of the independent predictors of obesity or overweight. Accordingly, the odds of developing obesity or overweight were 1.95 times higher among married adults than those of their counterparts. This is in harmony with the studies conducted in Greece (57), USA (58), and Iran (59). This could be explained by the fact that in culturally deep-rooted counties such as Ethiopia, married men probably tend to be socially resigned, less focused on being attractive, and less physically active, which explicitly contribute to developing obesity or overweight.
Finally, our study revealed that overweight and obesity distribution was varied across Ethiopian regions. Socioeconomic variables, including economy, eating habits, productivity, and environmental circumstances, are strongly correlated with obesity and overweight (60–62). Therefore, in our study setting, Ethiopia has different regions, which are vividly found in the categories of several economic, agricultural, and environmental variations that either directly or indirectly expose people to those various socioeconomic and cultural elements that resulted in different levels of overweight and obesity among regions.
Practice implicationsThe findings of this study can be used to guide the development of programs aimed at preventing overweight and obesity in Ethiopia by informing policymakers and other stakeholders about this emerging nutrition-related problem among adult households in Ethiopia and also provide compelling evidence of the factors influencing overweight and obesity.
Limitations of the studyThe EDHS is a cross-sectional survey that limits its ability to establish cause-and-effect relationships between smoking and overweight or obesity. The EDHS relies on self-reported information that can be inaccurate due to social desirability bias or recall bias. While the EDHS aims to be nationally representative, there might be some groups underrepresented in the sample. This could limit the generalizability of the findings to the entire population in the study area. Moreover, BMI as a predictor of overweight/obesity is somewhat questionable since there are several studies with contradictory ideas. Thus, further studies using longitudinal data to assess the temporal relationship between independent variables and overweight or obesity would help to determine if these factors precede overweight/obesity or vice versa.
ConclusionThe study revealed that approximately 8.5% and 2.9% of Ethiopian adults were overweight and obese, respectively. Factors including smoking, sex, marital status, educational status, wealth index, residence, and region were significantly associated with overweight and obesity among adult households. As a result, enhancing lifestyle modification interventions on overweight and obesity is enormous, and conducting more assessments to have more tangible and clear evidence concerning the factors influencing BMI utilizing more representative data from local to global would be important.
Data availability statementThe original contributions presented in the study are included in the article/supplementary material. Further inquiries can be directed to the corresponding authors.
Ethics statementEthical approval was not required for the study involving humans in accordance with the local legislation and institutional requirements. Written informed consent to participate in this study was not required from the participants or the participants’ legal guardians/next of kin in accordance with the national legislation and the institutional requirements.
Author contributionsDF: Writing – review & editing, Writing – original draft, Methodology, Investigation, Formal analysis. IM: Writing – review & editing, Formal analysis. ADeb: Writing – review & editing, Formal analysis. AB: Writing – review & editing, Investigation, Formal analysis. MG: Writing – review & editing. AE: Writing – review & editing. DD: Writing – review & editing. UJ: Writing – review & editing. BB: Writing – review & editing. MT: Writing – review & editing. LR: Writing – review & editing, Methodology, Formal analysis. ADer: Writing – review & editing, Writing – original draft, Methodology, Investigation, Formal analysis.
FundingThe author(s) declare financial support was received for the research, authorship, and/or publication of this article. Haramaya University provided financial support for this study. However, the funding agency had no role in the collection, analysis, and interpretation of the data, as well as the writing of the manuscript.
AcknowledgmentsWe would like to thank the Measure Demographic and Health Survey (DHS) international program for providing the dataset and Haramaya University.
Conflict of interestThe authors declare that the research was conducted in the absence of any commercial or financial relationships that could be construed as a potential conflict of interest.
Publisher’s noteAll claims expressed in this article are solely those of the authors and do not necessarily represent those of their affiliated organizations, or those of the publisher, the editors and the reviewers. Any product that may be evaluated in this article, or claim that may be made by its manufacturer, is not guaranteed or endorsed by the publisher.
AbbreviationsBMI, body mass index; CI, confidence interval; CSA, Central Statistics Agency; EA, enumeration areas; EMDHS, Ethiopian Mini Demographic and Health Survey; EPHI, Ethiopian Public Health Institute; FMOH, Federal Ministry of Health; ICC, intraclass correlation coefficient; PHC, Population and Housing Census; POR, proportional odds ratio; SSA, Sub-Saharan Africa.
References6. Hecker J, Freijer K, Hiligsmann M, Evers SMAA. Burden of disease study of overweight and obesity; the societal impact in terms of cost-of-illness and health-related quality of life. BMC Public Health. (2022) 22:46. doi: 10.1186/s12889-021-12449-2
PubMed Abstract | Crossref Full Text | Google Scholar
7. Afshin A, Forouzanfar MH, Reitsma MB, Sur P, Estep K, Lee A, et al. Health effects of overweight and obesity in 195 countries over 25 years. N Engl J Med. (2017) 377:13–27. doi: 10.1056/NEJMoa1614362
PubMed Abstract | Crossref Full Text | Google Scholar
8. Lenz M, Richter T, Mühlhauser I. The morbidity and mortality associated with overweight and obesity in adulthood: a systematic review. Dtsch Arztebl Int. (2019) 106:641–8. doi: 10.3238/arztebl.2009.0641
Crossref Full Text | Google Scholar
9. Lung T, Jan S, Tan EJ, Killedar A, Hayes A. Impact of overweight, obesity and severe obesity on life expectancy of Australian adults. Int J Obes (Lond). (2019) 43:782–9. doi: 10.1038/s41366-018-0210-2
PubMed Abstract | Crossref Full Text | Google Scholar
10. Malkin JD, Baid D, Alsukait RF, Alghaith T, Alluhidan M, Alabdulkarim H, et al. The economic burden of overweight and obesity in Saudi Arabia. PloS One. (2022) 17:e0264993. doi: 10.1371/journal.pone.0264993
PubMed Abstract | Crossref Full Text | Google Scholar
11. Obesity W. Economic-impact of Overweight and obesity in Ethiopia. (2019).
13. Grover SA, Kaouache M, Rempel P, Joseph L, Dawes M, Lau DC, et al. Years of life lost and healthy life-years lost from diabetes and cardiovascular disease in overweight and obese people: a modelling study. Lancet Diabetes Endocrinol. (2015) 3:114. doi: 10.1016/S2213-8587(14)70229-3
PubMed Abstract | Crossref Full Text | Google Scholar
16. NIH. Overweight and obesity causes and risk factors. (2018).
18. CDC. Strategies to prevent obesity and other chronic diseases. (2016).
19. WHO. Global strategy on diet, physical activity and health. (2021).
20. Kassie AM, Abate BB, Kassaw MW. Prevalence of overweight/obesity among the adult population in Ethiopia: a systematic review and meta-analysis. BMJ Open in British (2020).
23. Dagne S, Gelaw YA, Abebe Z, Wassie MM. Factors associated with overweight and obesity among adults in northeast Ethiopia: a cross-sectional study. Diabetes Metab syndrome obesity: Targets Ther. (2019) 12:391–9. doi: 10.2147/DMSO.S179699
Crossref Full Text | Google Scholar
24. Toselli S, Zaccagni L, Celenza F, Albertini A, Gualdi-Russo E. Risk factors of overweight and obesity among preschool children with different ethnic background. Endocrine. (2015) 49:717–25. doi: 10.1007/s12020-014-0479-4
PubMed Abstract | Crossref Full Text | Google Scholar
25. Wolde HF, Gonete KA, Akalu TY, Baraki AG, Lakew AM. Factors affecting neonatal mortality in the general population: evidence from the 2016 Ethiopian Demographic and Health Survey (EDHS)—multilevel analysis. BMC Res Notes. (2019) 12:610. doi: 10.1186/s13104-019-4668-3
PubMed Abstract | Crossref Full Text | Google Scholar
26. Central statistical agency E, Calverton M, USA. Ethiopia demographic and health survey. Addis Ababa, Ethiopia (2016).
27. Organization WH. Global database on body mass index: BMI classification. World Health Organization (2006).
28. Zbikowski SM, Jack LM, McClure JB, Deprey M, Javitz HS, McAfee TA, et al. Utilization of services in a randomized trial testing phone- and web-based interventions for smoking cessation. Nicotine tobacco Res. (2011) 13:319–27. doi: 10.1093/ntr/ntq257
Crossref Full Text | Google Scholar
29. Klesges RC, Meyers AW, Klesges LM, La Vasque ME. Smoking, body weight, and their effects on smoking behavior: a comprehensive review of the literature. psychol bulletin. (1989) 106:204–30. doi: 10.1037/0033-2909.106.2.204
Crossref Full Text | Google Scholar
30. Munafò MR, Tilling K, Ben-Shlomo Y. Smoking status and body mass index: a longitudinal study. Nicotine tobacco Res. (2009) 11:765–71. doi: 10.1093/ntr/ntp062
Crossref Full Text | Google Scholar
31. Helvaci MR, Altintas E, Yalcin A, Muftuoglu OE, Abyad A, Pocock L. Smoking may not prevent overweight or obesity. EC Clin Med Case Rep. (2023) 6:21–8.
32. Dare S, Mackay DF, Pell JP. Relationship between smoking and obesity: a cross-sectional study of 499,504 middle-aged adults in the UK general population. PloS One. (2015) 10:e0123579. doi: 10.1371/journal.pone.0123579
PubMed Abstract | Crossref Full Text | Google Scholar
33. Potter BK, Pederson LL, Chan SS, Aubut J-AL, Koval JJJN, Research T. Does a relationship exist between body weight, concerns about weight, and smoking among adolescents? integration literature an emphasis gender. (2004) 6:397–425. doi: 10.1080/14622200410001696529
Crossref Full Text | Google Scholar
34. Klesges RC, Eck LH, Isbell TR, Fulliton W, Hanson CL. Smoking status: effects on the dietary intake, physical activity, and body fat of adult men. J Am J Clin Nutr. (1990) 51:784–9. doi: 10.1093/ajcn/51.5.784
Crossref Full Text | Google Scholar
35. Schumann A, Hapke U, Rumpf HJ, Meyer C, John U. The association between degree of nicotine dependence and other health behaviours. Findings from a German general population study. Eur J Public Health. (2001) 11:450–2. doi: 10.1093/eurpub/11.4.450
PubMed Abstract | Crossref Full Text | Google Scholar
36. Jeon HG, Kim G, Jeong HS, So WY. Association between cigarette smoking and physical fitness level of Korean adults and the elderly. Healthcare (Basel Switzerland). (2021) 9:185. doi: 10.3390/healthcare9020185
PubMed Abstract | Crossref Full Text | Google Scholar
37. Darebo T, Mesfin A, Gebremedhin S. Prevalence and factors associated with overweight and obesity among adults in Hawassa city, southern Ethiopia: a community based cross-sectional study. BMC Obes. (2019) 6:8. doi: 10.1186/s40608-019-0227-7
PubMed Abstract | Crossref Full Text | Google Scholar
38. Dagne S, Menber Y, Petrucka P, Wassihun Y. Prevalence and associated factors of abdominal obesity among the adult population in Woldia town, Northeast Ethiopia, 2020: Community-based cross-sectional study. PloS One. (2021) 16:e0247960. doi: 10.1371/journal.pone.0247960
PubMed Abstract | Crossref Full Text | Google Scholar
39. Templin T, Oliveira C, Hashiguchi T, Thomson B, Dieleman J, Bendavid E. The overweight and obesity transition from the wealthy to the poor in low- and middle-income countries: A survey of household data from 103 countries. PloS Med. (2019) 16:e1002968. doi: 10.1371/journal.pmed.1002968
PubMed Abstract | Crossref Full Text | Google Scholar
41. Haregu TN, Mohamed SF, Muthuri S, Khayeka-Wandabwa C, Kyobutungi C. Body mass index and wealth index: positively correlated indicators of health and wealth inequalities in Nairobi slums. Glob Health Epidemiol Genom. (2018) 3:e11. doi: 10.1017/gheg.2018.10
PubMed Abstract | Crossref Full Text | Google Scholar
42. Biswas T, Garnett SP, Pervin S, Rawal LB. The prevalence of underweight, overweight and obesity in Bangladeshi adults: Data from a national survey. PloS One. (2017) 12:e0177395. doi: 10.1371/journal.pone.0177395
PubMed Abstract | Crossref Full Text | Google Scholar
43. Abrha S, Shiferaw S, Ahmed KY. Overweight and obesity and its socio-demographic correlates among urban Ethiopian women: evidence from the 2011 EDHS. BMC Public Health. (2016) 16:1–7. doi: 10.1186/s12889-016-3315-3
PubMed Abstract | Crossref Full Text | Google Scholar
44. Nagata JM, Garber AK, Tabler JL, Murray SB, Bibbins-Domingo K. Prevalence and correlates of disordered eating behaviors among young adults with overweight or obesity. J Gen Internal Med. (2018) 33:1337–43. doi: 10.1007/s11606-018-4465-z
Crossref Full Text | Google Scholar
45. Pagliai G, Dinu M, Madarena M, Bonaccio M, Iacoviello L, Sofi F. Consumption of ultra-processed foods and health status: a systematic review and meta-analysis. Br J Nutr. (2021) 125:308–18. doi: 10.1017/S0007114520002688
PubMed Abstract | Crossref Full Text | Google Scholar
46. Wang L, Zhou B, Zhao Z, Yang L, Zhang M, Jiang Y, et al. Body-mass index and obesity in urban and rural China: findings from consecutive nationally representative surveys during 2004–18. Lancet. (2021) 398:53–63. doi: 10.1016/S0140-6736(21)00798-4
PubMed Abstract | Crossref Full Text | Google Scholar
47. Rachmi C, Li M, Baur LA. Overweight and obesity in Indonesia: prevalence and risk factors—a literature review. Public Health. (2017) 147:20–9. doi: 10.1016/j.puhe.2017.02.002
PubMed Abstract | Crossref Full Text | Google Scholar
48. Alqarni SSM. A review of prevalence of obesity in Saudi Arabia. J Obes Eat Disord. (2016) 2:1–6. doi: 10.21767/2471-8203.100025
Crossref Full Text | Google Scholar
49. Mannan M, Mamun A, Doi S, Clavarino A. Prospective associations between depression and obesity for adolescent males and females-a systematic review and meta-analysis of longitudinal studies. PloS One. (2016) 11:e0157240. doi: 10.1371/journal.pone.0157240
PubMed Abstract | Crossref Full Text | Google Scholar
50. health i. Why is Obesity Becoming Prevalent in Women. (2022).
51. Kulie T, Slattengren A, Redmer J, Counts H, Eglash A, Schrager S. Obesity and women's health: an evidence-based review. J Am Board Fam Med. (2011) 24:75–85. doi: 10.3122/jabfm.2011.01.100076
留言 (0)