
記住我

In the fields of neuroscience and clinical neurology, the intricate workings of ion channels (Graves and Hanna, 2005), particularly potassium channels, hold profound implications for human health and disease (Attali, 1996; Shieh et al., 2000). Recent research has focused on Kv channels, such as Kv1.2, in the context of KCNA2 mutations. These mutations, depending on whether they result in gain- or loss-of-function, cause epilepsy, developmental disorders (Masnada et al., 2017), and neurodegenerative diseases such as spinocerebellar ataxia, underscoring their clinical relevance (Helbig et al., 2016). More recently, Kv3.3 channels have gained importance in clinical and pathogenetic investigations. Kv3.3 channels, encoded by the KCNC3 gene, are critical in modulating neuronal membrane potential and regulating action potential firing, thus maintaining normal brain function. Investigations have revealed that Kv3.3 channels are crucial in the pathogenesis of developmental and neurodegenerative disorders, as described in an (French family with) adult onset-ataxia and cognitive delay and impairment (Herman-Bert et al., 2000) and in a Filipino family with cerebellar ataxia (Waters et al., 2005), highlighting the genetic mechanisms underlying these neurological disorders (Masnada et al., 2017). In common, all of these cases express brain stem and cerebellar dysfunction and have been historically early categorized within autosomal dominant cerebellar ataxia (ADCA) (Harding, 1993).
Spinocerebellar Ataxia (SCA) have been defined later, dependent on genetic transmission and can manifest through various inheritance patterns including autosomal dominant (AD), autosomal recessive (AR), X-linked, or mitochondrial modes. As a result, SCA is observed within a heterogeneous group of ataxia. In addition to a wide variety of specific genes that cause SCA, a common pathophysiological and neuronal correlate is the loss of Purkinje cells, leading toward the clinical manifestation of cerebellar dysfunction: ataxia of gait, balance, coordination of limb movements, speech and coordination of the oculomotor system (Huang and Verbeek, 2019; Rudaks et al., 2024). Loss of Purkinje cells is often observed within MRI-Imaging due to cerebellar atrophy (Paulson et al., 2017). In addition to cerebellar symptoms, motor-neuronal degeneration and pyramidal signs, movement disorders such as parkinsonism, peripheral neuropathy or non-neurological symptoms can be present (Teive et al., 2019).
Spinocerebellar ataxia type 13 (SCA13) is an autosomal dominant neurodegenerative disorder characterized by cerebellar atrophy, particularly affecting the cerebellar vermis, resulting in a cerebellar syndrome with ataxia, dysarthria and nystagmus (Middlebrooks et al., 2013). Additional features may include pyramidal signs, epilepsy, auditory deficits, and mild intellectual disability. SCA13 results from mutations in the voltage-gated potassium channel KCNC3 (Kv3.3), with a prevalence of about 1.5% in Europe.
Kv3 subfamily members of voltage-gated potassium channels are typically expressed in neurons capable of high firing rates (Kaczmarek and Zhang, 2017). Kv3.3 is predominantly found in Purkinje cells in the cerebellum and in nuclei of the auditory brainstem. Kv3.3 channels primarily conduct outward potassium currents and contribute to the repolarization phase of action potentials. Their activity is critical for the regulation of neuronal excitability, particularly in inhibitory interneurons within the central nervous system. Kv channels can inactivate with a slow (C-type) or fast (N-type) inactivation. The N-type is achieved by the so-called “ball and chain” mechanism, in which an amino-terminal amino acid sequence blocks the channel pore upon depolarization (Sukomon et al., 2023). The mRNA of Kv3.3 contains two individual putative start codons for methionine (Rudy et al., 1999; Rae and Shepard, 2000) and it has been demonstrated, that alternative translation initiation (ATI) from the two different start codons of Kv3.3 leads to differences in channel inactivation (Rudy et al., 1999; Fernandez et al., 2003) as N-type inactivation can only occur in the long channel variant, containing the inactivation ball.
Three distinct SCA13 phenotypes have been described. The first manifests in childhood with cerebellar hypoplasia, non-progressive limb ataxia, trunk ataxia, and gait disturbances, often accompanied by moderate intellectual disability. The second phenotype features slowly progressive cerebellar atrophy in childhood, with ataxia, dysarthria, delayed motor milestones, and mild to moderate intellectual disability. Finally, the third phenotype presents in adulthood with cerebellar atrophy, ataxia, and spasticity. The phenotype of SCA13, particularly in adulthood, may mimic the clinical presentation of hydropic inner ear disease in its early stages, presenting with nystagmus, auditory impairment, and vertigo symptoms.
Different disease-causing mutations in KCNC3 have been identified and functionally studied: p.D129N (Duarri et al., 2015), p.R420H (Waters et al., 2006), p.R423H (Figueroa et al., 2010; Figueroa et al., 2011), p.T428I (Nemeth et al., 2013; Parolin Schnekenberg et al., 2015), p.F448L (Waters et al., 2006; Figueroa et al., 2010), p.V535M (Duarri et al., 2015), p.S591G (Duarri et al., 2015) and p.G592R (Zhang et al., 2016; Zhang et al., 2021b). Interestingly, these mutations in KCNC3 show quite heterogeneous effects on the Kv3.3 channel function, causing both, gain- and loss-of-functions (Supplementary Table 1). The pathological consequences of these channel alterations have been validated by experimental studies in transgenic zebrafish and cellular models, revealing deficits in motor control due to suppressed excitability of motor neurons, defective axonal pathways, and reduced current amplitudes. In addition, studies in mice have demonstrated disrupted dendritic development and incipient cell death.
It has previously been reported, that Kv3.3 activates cerebellar TANK-binding kinase 1 (TBK1) and that this stimulation is largely increased in the disease-causing Kv3.3G592R mutant (Zhang et al., 2016; Zhang et al., 2021b). TBK1 is a serine/threonine protein kinase that regulates several cellular processes and TBK1 dysfunction can trigger neurodegeneration (Li et al., 2016; Oakes et al., 2017). On the other hand, TBK1 activity is required for Kv3.3 to bind to its auxiliary subunit Hax-1, preventing channel inactivation. Hax-1 is an anti-apoptotic protein required for the survival of cerebellar neurons. Overactivation of TBK1 by mutant Kv3.3 channels leads to the loss of Hax-1 binding to the channel by its accumulation in multivesicular bodies and lysosomes and stimulates the production of exosomes and increases the rate of cell death (Zhang et al., 2021b).
In the current study we report a patient with hereditary atypical SCA13 and a predominant central vertigo. Here, genetic testing revealed a heterozygous variant in KCNC3, which encodes a voltage-gated potassium channel essential for neuronal excitability regulation. This finding suggests a potential role for Kv3.3 channel dysfunction in cases of atypical SCA13 and/or isolated vertigo, challenging conventional diagnostic paradigms and highlighting the complex genetic architecture underlying vestibular disturbances.
2 Materials and methods 2.1 Gene diagnostic and sequence analysisWe did not perform a clinical study involving human participants. The individual patient described in this case provided a written informed consent to participate in this scientific study.
Genetic diagnostics were performed in the centers for human genetics of SynLab in Mannheim and Bad Nauheim. Additional molecular repeat analyses for certain SCA genes were performed by the Department for Human Genetics at the University Clinic of Tübingen.
Clinical exome analysis was performed using next-generation sequencing (NGS) techniques. A target-specific gene library was created utilizing the “TruSight Nextera Flex for Enrichment Technology/TruSight One Kit” by Illumina. The sequencing process was carried out with an Illumina Sequencer (NextSeq 500). Genetic data analysis involved comparison of the sequences obtained with the reference genome NCBI37/hg19 using the Varvis 1.10.1 software. Copy number variation (CNV) analysis was performed using the CNV module within the Varvis software. The classification of genetic variations was conducted in accordance with the ACMG guidelines (Richards et al., 2015). Classification of variants was based on clinical and familial data of the patient, compared with existing scientific literature and international databases. Variants falling under class 1 and 2, as well as synonymous variations considered irrelevant for mRNA splicing based on in silico predictions and current scientific knowledge, were not reported.
2.2 Allele frequency, amino acid sequence alignment and pathogenicity predictionAllele frequencies were obtained from the EVS server (Exome Variant Server) or the gnomAD database (gnomAD). Sequence alignment of human (NM_004977), Mus musculus (NM_008422.3) Rattus norvegicus (NM_053997.5), Bos taurus (XM_027515050.1), Pan troglodytes (XM_054672643.2), Canis lupus familiaris (XM_038656201.1) and Danio rerio (NP_001182170) Kv3.3 proteins was performed with Clustal Omega. The pathogenicity of the Kv3.3E675K, USH2AV2306L and LOXHD1A553V variants was predicted using SIFT, PolyPhen-2 and MutationTaster.
2.3 Cloning and site-directed mutagenesisHuman (h) Kv3.3 (NM_004977) was subcloned from the open reading frame (ORF) cDNA clone (Origene, RG222238) into the oocyte expression vector pSGEM using EcoRI and XhoI restriction enzymes (Fermentas). Mutations were introduced using the QuikChange Site-Directed Mutagenesis Kit (Agilent) and confirmed by Sanger sequencing (Seqlab).
2.4 Isolation of Xenopus laevis oocytesThe animal study with Xenopus laevis toads was approved by the Ethics Committee of the Regierungspräsidium Gießen (protocol code V54-19c 20 15 h 02 MR 20/28 Nr.A 23/2017, approved on 12.02.2018). Oocytes were isolated from anesthetized Xenopus laevis frogs and then incubated in OR2 solution containing in mM: 82.5 NaCl, 2 KCl, 1 MgCl2, 5 HEPES; pH 7.5 with NaOH, supplemented with collagenase (1.5 mg/mL) (Nordmark) to remove residual connective tissue. The oocytes were then stored in ND96 solution containing in mM: 96 NaCl, 2 KCl, 1.8 CaCl2, 1 MgCl2, 5 HEPES; pH 7.4 with NaOH, supplemented with Na-pyruvate (275 mg/L), theophylline (90 mg/L) and gentamicin (50 mg/L) at 18°C.
2.5 cRNA synthesis and injectionKv3.3 wild-type or mutant cDNAs were linearized with NheI and cRNA was synthesized using the HiScribe T7 ARCA mRNA Kit (New England Biolabs). Quantity and quality of cRNAs were assessed by agarose gel electrophoresis and spectroscopy (NanoDrop 2000c, Thermo Fisher Scientific). Stage IV and V oocytes were each injected with 50 nL of cRNA each using a Nanoject II microinjector (Süd-Laborbedarf GmbH).
2.6 Two-electrode voltage-clamp recordings in Xenopus laevis oocytesAll voltage-clamp recordings were performed at room temperature (20–22°C) using an Axon Axoclamp 900A Microelectrode Amplifier (Molecular Devices) and a Digidata 1440 Series (Axon Instruments) as an analog/digital converter or with a TurboTEC 10CD (npi) amplifier and a Digidata 1200 Series (Axon Instruments). Micropipettes were made from borosilicate glass capillaries (GB 150TF-8P, Science Products) and pulled using a DMZ-Universal Puller (Zeitz). The recording pipettes had a resistance of 0.5–1.0 MΩ when filled with 3 M KCl solution. ND96 (pH 7.5) was used as recording solution. Data were acquired with Clampex 10 (Molecular Devices) and analyzed with Clampfit 10 (Molecular Devices) and Origin 2016 (OriginLab Corp.). To analyze the kinetics of the recovery from inactivation the voltage was stepped from a holding potential of −80 mV to +50 mV for 200 ms, followed by another step from −80 mV to +50 mV after 20 ms. The depolarization step was repeated 17 times with increasing time for recovery, with an increment of 500 ms per step (Supplementary Figure 5F). The inter-sweep time interval was 30 s to guarantee complete inactivation recovery from the second pulse. For each sweep, the relative recovered current Irec was calculated by building the ratio of the peak current amplitude of the first I1max and the second depolarizing voltage step I2max after subtraction with the minimal current amplitude I1min at the end of the first voltage step (Equation 1):
Irec=(I1max−I1min)/(I2max−I1min) (1)A mono-exponential fit was used to analyze the time constants of current recovery. To record the current–voltage relationship (IV) the voltage was stepped for 500 ms from a holding potential of −80 mV to −60 mv to +80 mV in 20 mV increments (Supplementary Figure 5B). To analyze the conductance-voltage relationship (GV) the voltage was stepped for 25 ms from a holding potential of −80 mV to −70 to +60 mV, in 10 mV increments. The depolarization step was followed by a voltage step to −40 mV (or alternatively −25 or −15 mV for tail currents of small amplitude) for 400 ms to record the tail currents (Supplementary Figure 5A). Peak tail current amplitudes were analyzed for all applied voltages and normalized to the maximal current amplitude. The voltage at half-maximal activation (V1/2) and the slope of the Boltzmann fit (k value) was calculated using the Boltzmann equation. Both, the IV and the GV protocol, had an inter-sweep time interval of 7 s.
To analyze the voltage-dependence of inactivation, the voltage was stepped for 1 s from a holding potential of −80 mV to −100 to +30 mV with 10 mV increments [for the Kv3.3M1I variant 10 s steps were applied, as this variant does not show fast inactivation (Supplementary Figure 5D)]. The inter-sweep time interval was set to 10 s. Subsequently the voltage was stepped to +50 mV for 400 ms (Supplementary Figure 5C). Peak current amplitudes were analyzed at the second step, respectively and normalized to the maximal current amplitude. The voltage at half maximal inactivation (V1/2) and the slope of the Boltzmann fit (k) were calculated using the Boltzmann equation.
To quantify current amplitudes voltage was stepped for 200 ms from a holding potential of −80 mV to +50 mV (Supplementary Figure 5E). The peak current amplitude was analyzed and normalized to the mean current amplitude of Kv3.3 wild-type or Kv3.3M1I or Kv3.3M77I as indicated for each batch.
The TBK1 inhibitor MRT67307 (Millipore) was dissolved in DMSO. 24 h after cRNA injection, oocytes were incubated in ND96 solution containing 40 μM MRT67307 for 30 min and then recorded using the IV protocol. The current amplitude was normalized to the peak current amplitude. A bi-exponential fit was used to analyze the time constants.
Pharmacological modulation of Kv3.3 and the E675K variant were measured using the protocols mentioned above. Niflumic acid (100 mM stock, Sigma), carbamazepine (100 mM stock, Thermo Scientific) and riluzole (100 mM stock, TCI chemicals) were dissolved in DMSO. 4-aminopyridine (4-AP, Sigma) was dissolved in ddH2O (1 M stock). Prior to the measurements, the stocks were diluted in ND96 solution according to the desired final concentrations.
Extracellular potassium sensitivity of wild-type Kv3.3 and Kv3.3E675K was measured using modified ND96 solutions with varying potassium concentrations (1 mM, 2 mM, 4 mM, 8 mM, 98 mM) by replacing NaCl with KCl. To account for the consequential shift in reversal potential and the accompanying changes in driving force, the GV protocol was slightly adjusted for the different potassium concentrations by changing the voltage step for the tail current analysis (1 mM K+ = −25 mV, 8 mM K+ = −15 mV, 98 mM K+ = −40 mV). Extracellular potassium dependent changes in inactivation kinetics and recovery from inactivation were recorded and analyzed as described above. The time constant τ of the inactivation recovery was calculated using a mono-exponential fit in Origin 2016. To analyze the frequency dependence of inactivation accumulation, voltage was stepped for 5 ms from a holding potential of −80 mV to +40 mV with varying inter-sweep time intervals according to the required frequency (1 Hz = 1000 ms, 10 Hz = 100 ms, 50 Hz = 20 ms, 100 Hz = 10 ms) (Supplementary Figure 5G). Current amplitudes were analyzed at the end of the voltage step and normalized to the maximal current amplitude. Assuming an independence from extracellular potassium concentration, the theoretical reduction in current by changes in the driving force can be calculated based on the Goldman–Hodgkin–Katz equation as it was done by Larsen and colleagues (Larsen et al., 2011) (Equation 2):
IC1IC2=[K+]inC1−[K+]exC1∗exp(−Vm∗FR∗T)[K+]inC2−[K+]exC2∗exp(−Vm∗FR∗T) (2)The equation is used to calculate the theoretical current ratio IC1IC2 of two different extracellular potassium concentrations [K+]exC1 and [K+]exC2 using an intracellular potassium concentration [K+]in of 108.6 mM, based on the concentrations in Xenopus laevis oocytes gathered by Weber (1999). Vm is the utilized membrane potential, F the faraday constant, R the gas constant, and T the temperature. The time constant τ of the first 2 s of cumulative inactivation was calculated using a mono-exponential fit in Origin 2016 software.
2.7 Statistical analysesValues are expressed as mean ± s.e.m. For oocyte experiments N ≥ 3 different batches were used. Sample size was not predetermined, and the number of experiments required was estimated based on previous experiments and literature in this field. There were no exclusion criteria and no data were excluded from the analysis. No randomization or blinding was applied to the experiments. Statistical analysis was performed using Microsoft Excel 2013 and OriginPro 2016. The respective graphs show the number of replicates (n) from different samples. Significances are indicated by asterisks, which indicate the level of significance as follows: n.s., not significant, *p < 0.05; **p < 0.01; ***p < 0.001.
3 Results 3.1 Clinical findingsThe 55 years old patient’s medical journey commenced at the age of 27 with a gradual onset of symptoms, including progressive right sided hearing loss and rotational vertigo. Over the ensuing years, this evolved into severe right sided hearing loss, episodic rotational vertigo, and mild cerebellar ataxia. Notably, the rotational vertigo episodes escalated in both frequency (from once to twice daily) and intensity, lasting 30 min until hours. Initially misdiagnosed with Meniere’s disease, the individual underwent unsuccessful ototoxic and surgical interventions, including gentamicin treatment to both inner ears, saccotomies of the right vestibular organ in 1999 and 2003, saccotomies of the left vestibular organ in 2002 and 2004, and bilateral neurotomies of vestibulocochlear nerves in 2007 and 2009, leading to an iatrogenic injury of the left facial nerve.
Alongside these challenges, cerebellar symptoms such as ataxia of gait and stand have been additionally developed and mildly progressed. Given the clinical history and evolving doubts regarding the diagnosis of bilateral Meniere’s disease and as suspicions of an ataxia subtype had been raised, a genetic testing was initiated.
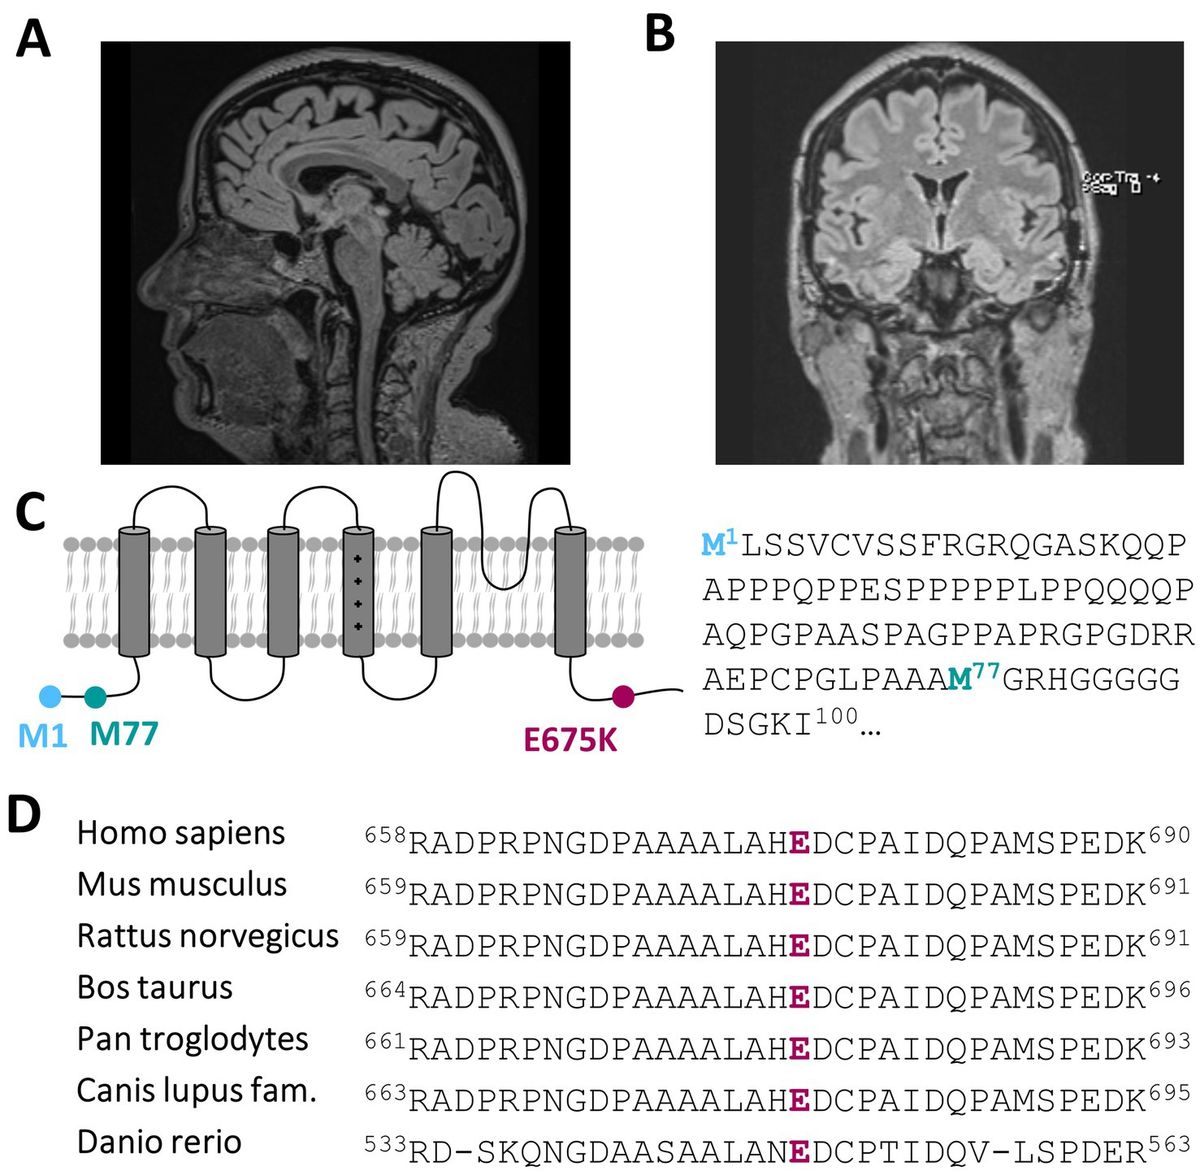
3.2 Actual clinical manifestation and diagnostic findingsRecent developments within the last 1–2 years have seen the emergence of mild to moderate deficits in short-term memory and signs of amnesic aphasia. This could be investigated and verified by neuropsychological testing showing signs of beginning dementia of unclear underlying etiology. Dementia screening has been investigated, showing only a mild cerebellar atrophy (Figure 1A; Supplementary Figures 1A–D) and morphologic changes due to global loss of brain volume via MRI (Figure 1B), albeit without a prove of ß-amyloid-or tau pathology within cerebrospinal fluid analysis.

Figure 1. A heterozygous KCNC3 variant in an atypical case of SCA13 with a dominant central rotational vertigo, only mild progressive cerebellar symptoms and an early onset of cognitive impairment. (A) Mid-sagittal T1/T2 and Flair-sequence MR image of the patient in 2024 showing a mild cerebellar atrophy and (B) a global reduction of brain volume. (C) Topology of a Kv3.3 channel subunit. The location of the E675K variant is highlighted in purple and the location of the alternative start of the N-terminus is highlighted in turquoise. (D) Partial amino acid sequence alignment of different Kv3.3 orthologues. The conserved E675 residue is highlighted in purple.
Further actual clinical examinations revealed truncal and extremity ataxia, alongside an unsteady gait and mild cerebellar dysarthria. No spontaneous nystagmus was observed, and a skew deviation was apparent during specific eye movements. The head impulse test was inconclusive due to a head tremor, while assessments for positional vertigo yielded unremarkable results. A skew deviation was observed upon upward and leftward gaze. Additionally, partial right facial nerve palsy was noted, reportedly unchanged since 2009. Herein, skew deviation and disconjugated eye movements were observed 2009, prompting further investigations via magnetic resonance imaging (MRI) of the cervical spine and brain with Acoustic Neuroma Protocol. However, no pathological findings were identified.
Audiometric assessments confirmed severe progressive hearing loss on the right side and indicated slight left sided impairment: Audiometric evaluation demonstrated left sided surditas and profound pan-tonal hearing loss in the right ear, approximately 70 dB. Compared to prior records, progressive bilateral hearing loss was documented. Given discrepancies between subjective and objective findings, Brainstem Auditory Evoked Response (BAER) testing was conducted in 2018. Results revealed a slight exacerbation of hearing loss in the right ear as previously noted, yet surditas in the left ear was not confirmed. Thus, progressive hearing loss exceeding 40 dB over several years was solely confirmed in the right ear. Caloric testing demonstrated reduced excitability on the left side.
3.3 Genetic findingsThe index patient has two children: a son and a younger daughter. The son of the index patient (28 years old at the time of genetic diagnosis) carries at least the same genotype of the KCNC3 variant (c.2023G > A, p.Glu675Lys). There are no symptoms identified in this variant carrier, which manifested in the index patient in the 2nd to 3rd decade of life. In addition, it might be that the variant has only a partial or sex-specific penetrance of the phenotype. No other family members are known to have the same symptoms of hearing impairment, ataxia or vertigo. gDNA of the parents of the index patient was not achievable and therefore investigations like trio-WES analyses were not realizable. To analyze the genetic origin of this disease, we performed a clinical exome analysis by next-generation sequencing (NGS). First, genes were categorized according to Human Phenotype Ontology (HPO) terms using search terms that describe the phenotype of the patient, like “ataxia,” “hearing impairment,” and “vertigo” to provide a clinical selection of the exome-analysis. Utilizing this approach and due to the atypical phenotype of our patient, the software analyzed a very large variety of 1098 syndromes with a genetic basis and screened for variants in 1114 genes. The genes that were screened by NGS and analyzed for variants are listed in Supplementary Table 2. The copy number variation (CNV) analysis for the studied genes did not show any signs of deletions or duplications.
The subsequent classification of variants was based on clinical and familial data of the patient, compared with existing scientific literature and public databases. We have identified three class 3 variances of unknown significance (VUS) in the genes USH2A, LOXHD1 or KCNC3, which were all present in a heterozygous state. We identified a variant in the usherin gene (USH2A) with an c.6916G > C exchange, leading to a p.Val2306Leu substitution of a conserved amino acid within the fibronectin type III domain with a chemically similar amino acid. This variant was not documented in ClinVar and the literature. The variant was very rare in the gnomAD database, with an allele frequency of 6.2 × 10⁻⁷. Following in silico prediction analysis using SIFT, PolyPhen-2 and MutationTaster, the potential pathogenicity of this variant remains uncertain. Most importantly, the clinical features, in particular the central vertigo, are not in agreement with an Usher syndrome. In addition, mutations in the USH2A gene are causing Usher syndrome type 2 only in the homozygous state. Therefore, this exchange was not further considered as a disease-causative variant.
Another variant was found in the lipoxygenase homology PLAT domains 1 gene (LOXHD1) with a heterozygous c.1658_1659delCCinsTT change in the PLAT/LH2 domain, resulting in a physicochemical relative neutral p.Ala553Val exchange of a conserved amino acid. This variant was absent in ClinVar and the literature. The variant was very rare in the gnomAD database, with an allele frequency of 1.16 × 10⁻⁵. However, two of the in silico prediction tools that we used predicted a benign impact of this exchange. The clinical features, in particular the central vertigo, are not in agreement with a LOXHD1 mutation. In light of the absence of a pathogenic in silico prediction of the variant and the fact that disease-causing LOXHD1 mutations follow a recessive inheritance trait, this nucleotide exchange was also not further considered as a disease-causative variant.
Most importantly, we identified a variant in the SCA13-associated gene KCNC3, encoding the voltage-gated Kv3.3 channel, with a c.2023G > A nucleotide exchange, that causes a charge reversing p.Glu675Lys amino acid exchange of a highly conserved amino acid in the cytosolic C-terminus of the channel protein (Figures 1C,D). While this variant has not been reported in the literature, it is listed in ClinVar and classified with uncertain significance. The variant was very rare in the gnomAD database with an allele frequency of 3.34 × 10⁻⁵. In addition to its rare prevalence, two of the three in silico pathogenicity prediction tools we used predicted that variant to be probably damaging or as not tolerated. The lack of this variant in public databases, the physiochemical nature of the amino acid exchange and the partly pathogenic disease causing in silico predictions, together with the fact that SCA13 mutations are primarily found in the heterozygous state, indicate that the KCNC3 variant is the most likely disease-associated variant in our patient with an atypical cerebellar ataxia.
Although mutations in USH2A and LOXHD1 can be associated with mechanotransduction defects in cochlear hair cells and hearing loss (Mori et al., 2015; Hartel et al., 2016; Lee et al., 2020; Trouillet et al., 2021; Crane et al., 2023), any potential peripheral contributions to vertigo of the patient caused by mutations in these two genes can be excluded due to bilateral vestibular neurectomy, which supports the hypothesis of a central vertigo mediated by the KCNC3 variant.
3.4 Early therapy approachesSince the exact dysfunction due to the mutation was not yet described in the literature, treatment commenced with 4-aminopyridine (4-AP), a drug shown to be beneficial in patients with potassium channel gain-of-function mutations (Humphries and Dart, 2015). Despite initial treatment, no improvement was noted and symptoms increased dramatically: the patient was referred again to the hospital with severe rotational vertigo. Therefore, subsequent titration of carbamazepine was realized, in order to explore another pharmacological treatment toward a putative potassium-channel loss-of-function. This resulted in prolonged intervals between symptom-episodes (from daily manifestation to weekly manifestation) and reduction of symptom severity. One year later, medication was switched from carbamazepine to riluzole (50 mg, twice daily), with again a positive effect on symptom severity and frequency of manifestation. Currently, the patient also receives 47.5 mg of metoprolol in the morning as anti-hypertensive treatment, which did not interfere with the vertigo phenotype.
To investigate whether the KCNC3 variant that we identified in the course of the therapeutic approaches leads to functional changes that are potentially disease-causing, we next analyzed the electrophysiological changes caused by the Kv3.3E675K variant, also aiming to identify a novel therapy approach.
3.5 Kv3.3E675K did not change channel gatingTo index analyze whether the variant might be disease-relevant, we compared the gating properties of the mutant voltage-gated channel with those of wild-type Kv3.3. Here, activation curves were recorded (Figure 2A) and the conductance-voltage relationships (GVs) of both channels were determined (Figures 2B,C). However, no differences between wild-type Kv3.3 and Kv3.3E675K were observed, also reflected by nearly identical voltages of half-maximal activation (V1/2) and k-values. Interestingly, ATI can result in a Kv3.3 channel lacking the first 76 N-terminal amino acids and thus the so-called inactivation ball. Therefore, we also analyzed the voltage-dependence of the Kv3.3E675K variant in both types of Kv3.3 channels. To this end, the short Kv3.3 channel background was generated by mutagenesis by removing the first start codon (M1I mutation) (Figures 1A, 2D–F) and the long channel variant by removing the second start codon (M77I) (Figures 1A, 2G–I). While both ATI variants showed a slightly shifted GV curve of about +5 mV toward more positive potentials (Supplementary Figure 2), the E675K variant did not lead to any further shift in the voltage-dependence in either the short (Figure 2F; Supplementary Figure 2) or the long Kv3.3 background (Figure 2I; Supplementary Figure 2). Moreover, activation and deactivation kinetics did not differ between the Kv3.3 wild-type channel and the Kv3.3E675K variant (Supplementary Tables 3, 4).
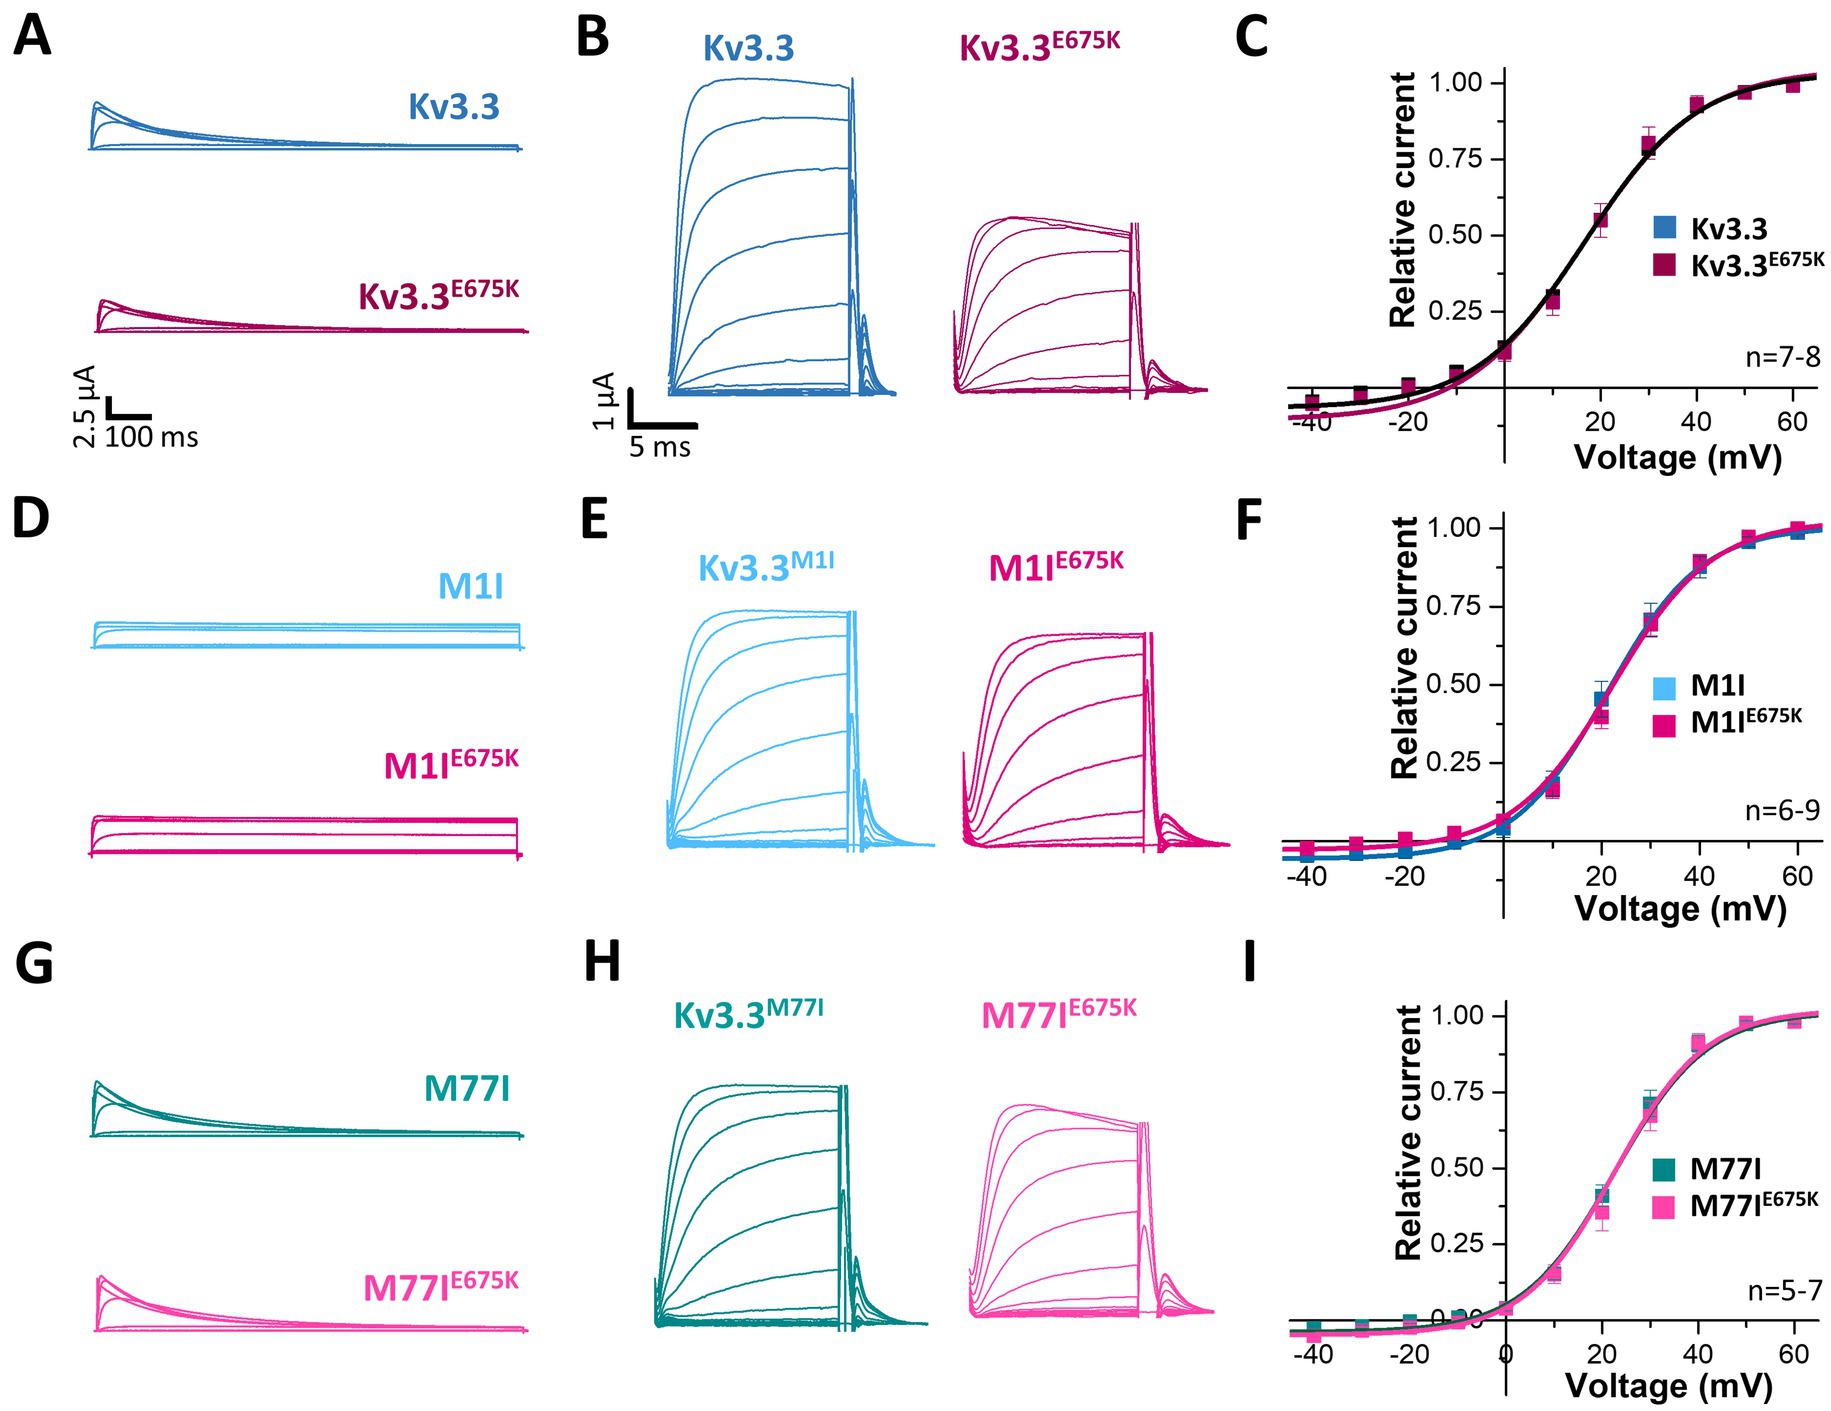
Figure 2. Voltage-dependence of activation of Kv3.3 and the Kv3.3E675K variant in different channel backgrounds. (A) Representative current traces of wild-type Kv3.3 (top) and Kv3.3E675K (bottom). The voltage protocol is illustrated in Supplementary Figure 5B. (B) Representative current traces using a short GV protocol (see Methods section and Supplementary Figure 5A) and (C) the conductance-voltage relationships derived from panel (B). (D–F) The same as in panel (A–C), but the E675K variant was studied in a forced short Kv3.3 channel (M1I mutant). (G–I) The same as in panel (A–C), but the E675K variant was studied in the in a forced long Kv3.3 channel (M77I mutant). Data are presented as mean ± s.e.m. The number of replicates is indicated within the graphs.
Next, we analyzed the voltage-dependent channel inactivation (Figures 3A–F) of the three different Kv3.3 channel constructs (wild-type, M1I, M77I) with and without the E675K variant. In the wild-type background (Figures 3A,B), the E675K variant did not alter the half-maximal voltage of inactivation (V1/2) or the k-values. As expected for a channel construct lacking the inactivation ball, the M1I Kv3.3 channel exhibits a reduced steady-state inactivation (Supplementary Figures 3A,C), and an increased k-value (Supplementary Figure 3C). However, in the long M77I Kv3.3 channel the inactivation parameters were not altered compared to wild-type Kv3.3 (Supplementary Figure 3), indicating that the long channel is the predominantly translated channel variant in our expression system. Similar as in the wild-type background (Figures 3A,B), the E675K variant did not lead to any changes in the inactivation properties compared to the channels in the M1I (Figures 3C,D) or M77I background (Figures 3E,F).
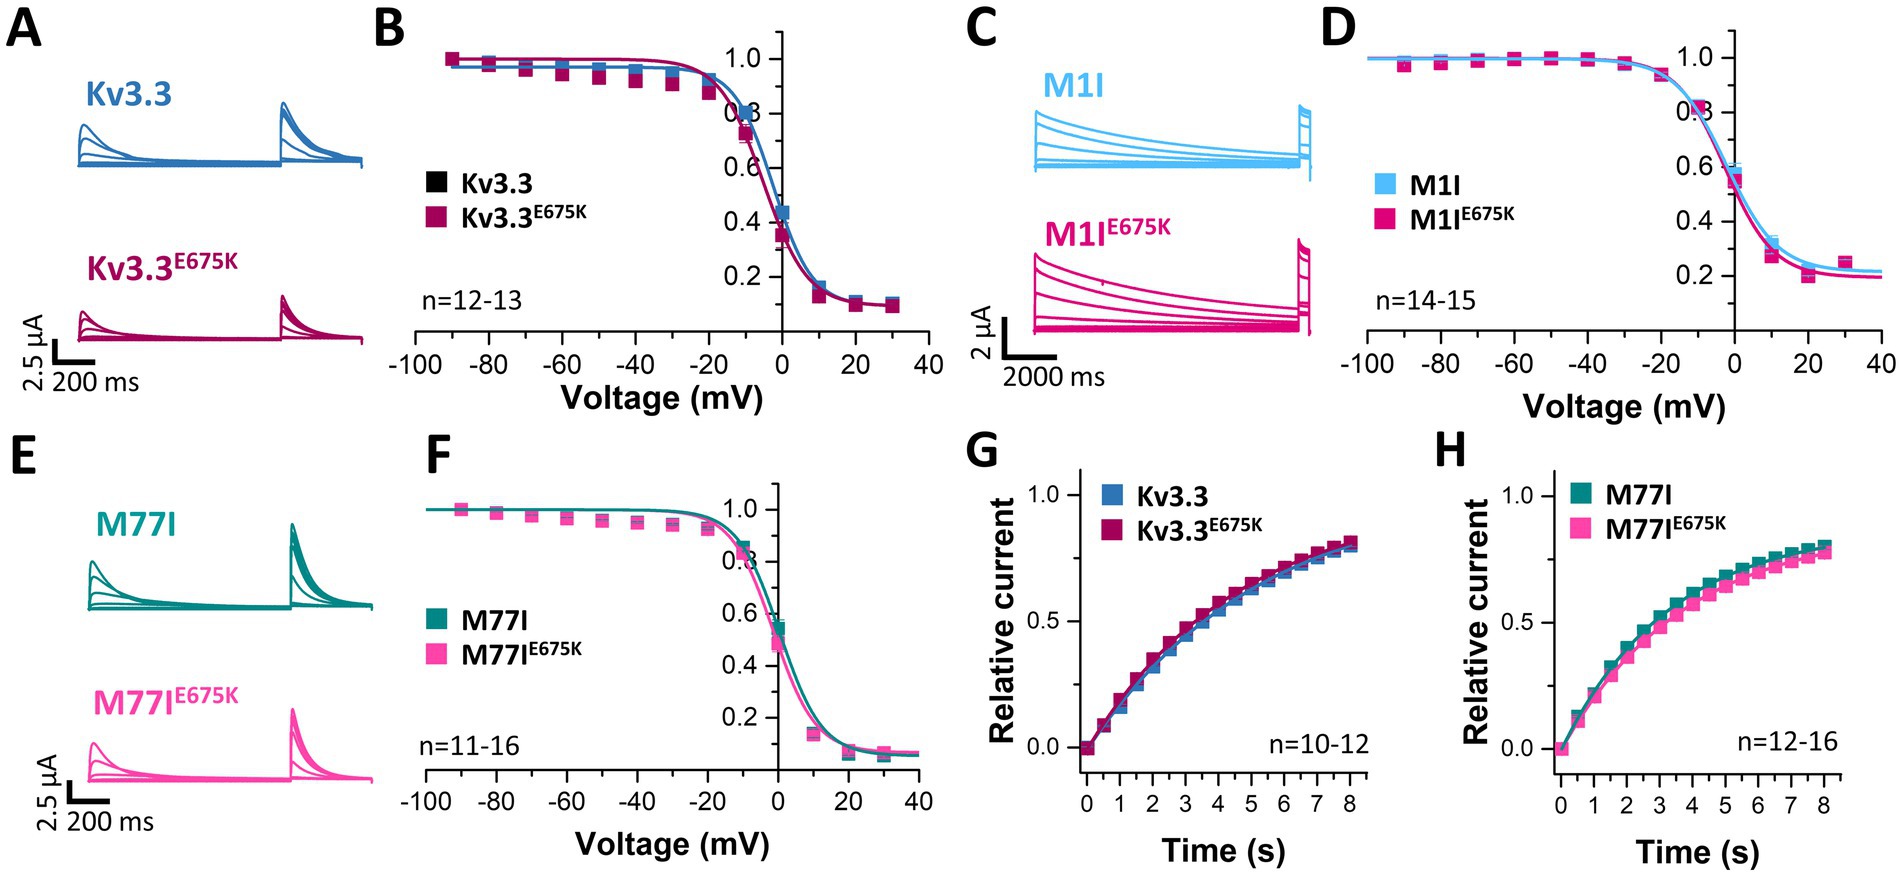
Figure 3. Voltage-dependence of inactivation and recovery from inactivation kinetics of Kv3.3 and the Kv3.3E675K variant in different channel backgrounds. (A) Representative current traces of wild-type Kv3.3 (top) and Kv3.3E675K (bottom) (The voltage protocol is illustrated in Supplementary Figure 5C) and (B) the derived inactivation curves. (C,D) The same as in panel (A,B), but the E675K variant was studied in a forced short Kv3.3 channel (M1I mutant) (The voltage protocol is illustrated in Supplementary Figure 5D). (E,F) The same as in panel (A,B), but the E675K variant was studied in the in a forced long Kv3.3 channel (M77I mutant). (G) Recovery from inactivation of wild-type Kv3.3 and Kv3.3E675K, fitted to a mono-exponential equation. The voltage protocol is illustrated in Supplementary Figure 5F. (H) The same as in panel (G), but the E675K variant was studied in the in a forced long Kv3.3 channel (M77I mutant). Data are presented as mean ± s.e.m. The number of replicates is indicated within the graphs.
Also the recovery from inactivation was comparable for wild-type Kv3.3 and the Kv3.3E675K variant, as well as for the M77I variant with and without the E675K exchange, respectively (Figures 3G,H). Note, that this parameter was not analyzed in the Kv3.3M1I background, as this variant does not show a fast inactivation per se.
3.6 The Kv3.3E675K variant does not interfere with the TBK1 modulationAs mentioned above, a mutation in the Kv3.3 channel (Kv3.3G592R) was reported to cause SCA13 by enhancing the activation of TBK1. TBK1 activity is required for the binding of Kv3.3 to its auxiliary subunit Hax-1, which prevents channel inactivation. Consequently, the application of the TBK1 inhibitor MRT67307 increases Kv3.3 channel inactivation by preventing Hax-1 binding and channel inactivation (Zhang et al., 2021b). Thus, we investigated, whether the Kv3.3E675K variant has an impact in this mechanism.
Here, we first compared the inactivation kinetics of wild-type Kv3.3 and Kv3.3E675K at different potentials in more detail (Figure 4A), to probe for a loss-of-function by a change in the basal inactivation kinetics, however, no differences were observed. Also in the long M77I channel background, the E675K variant has no impact on the inactivation kinetics (Figure 4B). These data suggest that Hax-1 binding is not altered in the Kv3.3E675K variant. Next, we incubated the Kv3.3 cRNA-injected oocytes before the electrophysiological measurements in recording solution containing the TBK1 inhibitor MRT67307. For these experiments, we studied the forced long M77I construct to ensure that all channels at the plasma membrane harbor an inactivation ball. As expected, TBK1 inhibition accelerated the rate of inactivation of the long M77I channel construct (Figure 4C). However, also for the E675K variant a highly similar effect, with a small acceleration of the rate of inactivation, was observed after the pre-treatment with the TBK1 inhibitor (Figure 4D).
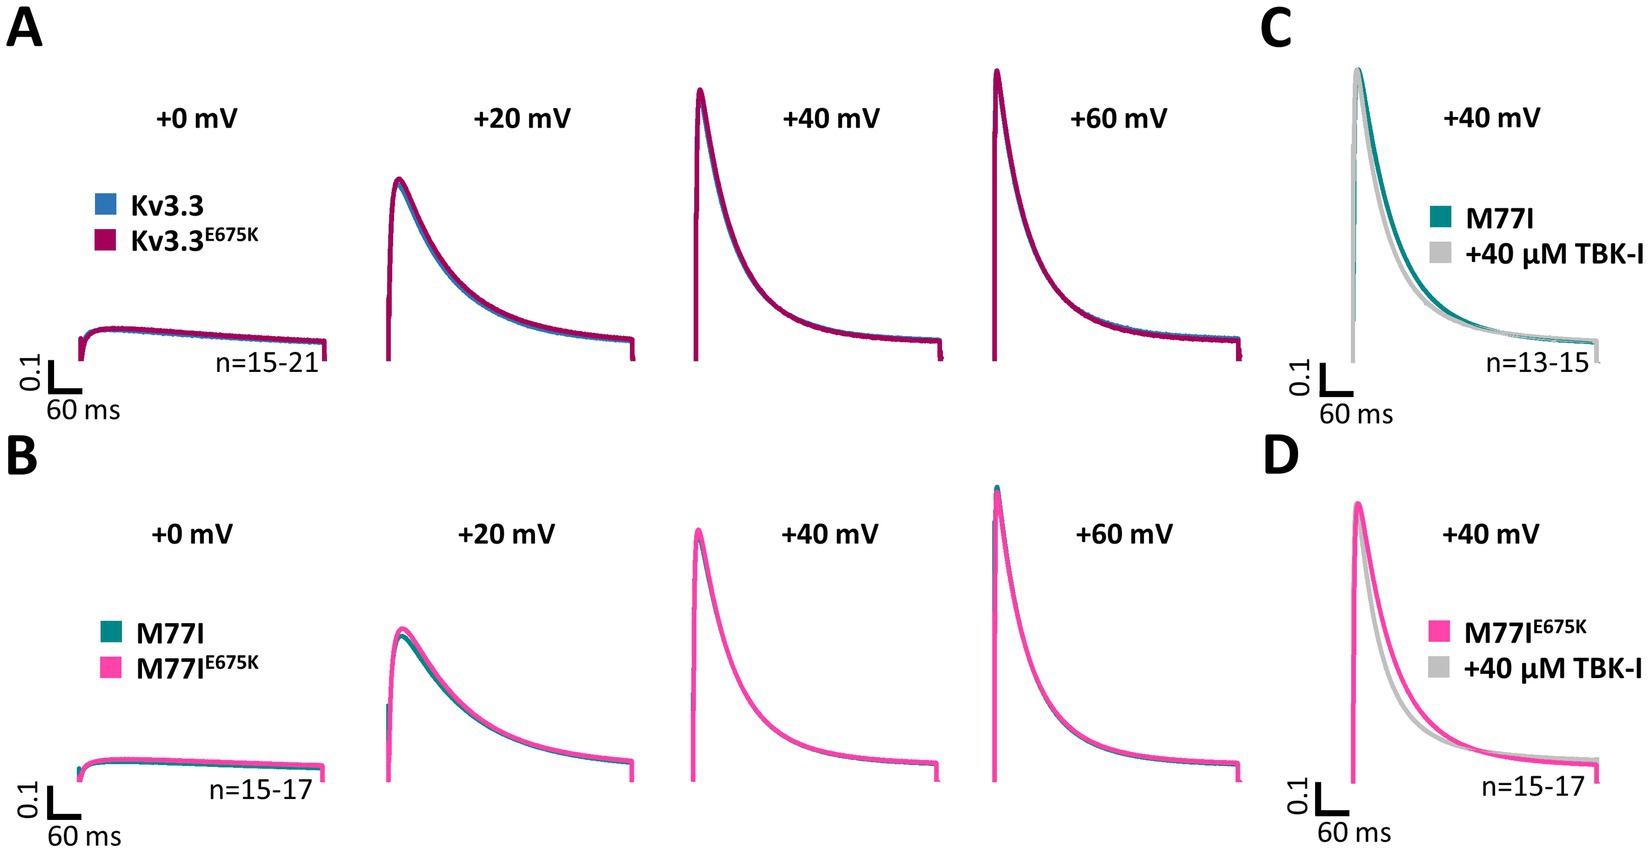
Figure 4. Inactivation kinetics and TBK1 modulation of Kv3.3 and the Kv3.3E675K variant. (A) Averaged current traces to illustrate the voltage-dependence of activation and the inactivation kinetics at different potentials for wild-type Kv3.3 and Kv3.3E675K (The voltage protocol is illustrated in Supplementary Figure 5B). (B) Similar as in panel (A) but the E675K variant was studied in the in a forced long Kv3.3 channel (M77I mutant). (C) Averaged current traces to illustrate the inactivation kinetics of the forced long Kv3.3 channel (M77I mutant) without or after pre-treatment with a TBK1 inhibitor. The time constants of inactivation of the M77I Kv3.3 channel after TBK1 inhibitor treatment were: τ1 = 144 ms, τ2 = 50 ms, A1/(A1 + A2) = 0.3. (D) The same as in panel (C), but for the forced long variant carrying the E675K variant. The time constants of inactivation of the M77I Kv3.3E675K variant after TBK1 inhibitor treatment were: τ1 = 136, τ2 = 43, A1/(A1 + A2) = 0.3. The number of replicates is indicated within the graphs.
3.7 Kv3.3E675K reduces the current amplitude and has no dominant-negative effect on wild-type Kv3.3 channelsSince voltage-dependence and current kinetics were not altered by the E675K variant, we probed for changes in the macroscopic current amplitude as a possible disease-causing mechanism. To this end, similar amounts of cRNA were injected for the Kv3.3, M1I, M77I channel constructs with or without the E675K exchange and peak current amplitudes were analyzed (Figure 5). Strikingly, the E675K variant reduced the current amplitudes by approximately 30% in all Kv3.3 channel backgrounds (Figures 5A–D). As the patient is a heterozygous mutation carrier, we also analyzed the current amplitudes in the heterozygous state by co-injecting half the amount of wild-type Kv3.3 with the Kv3.3E675K (Figure 5E). Similarly to the condition reflecting the homozygous state (Figures 5A–D), Kv3.3E675K reduced the current amplitudes compared to wild-type Kv3.3 (Figure 5E). Strikingly, this current reduction was not dominant-negative, as observed for the SCA13 causing Kv3.3R420H mutation (Waters et al., 2006) (Figure 5E). Note, that the patient described in the current study has a mild cerebellar ataxia with a dominant central vertigo and no classical SCA13, which may be reflected by this mechanistic difference between the two mutants.
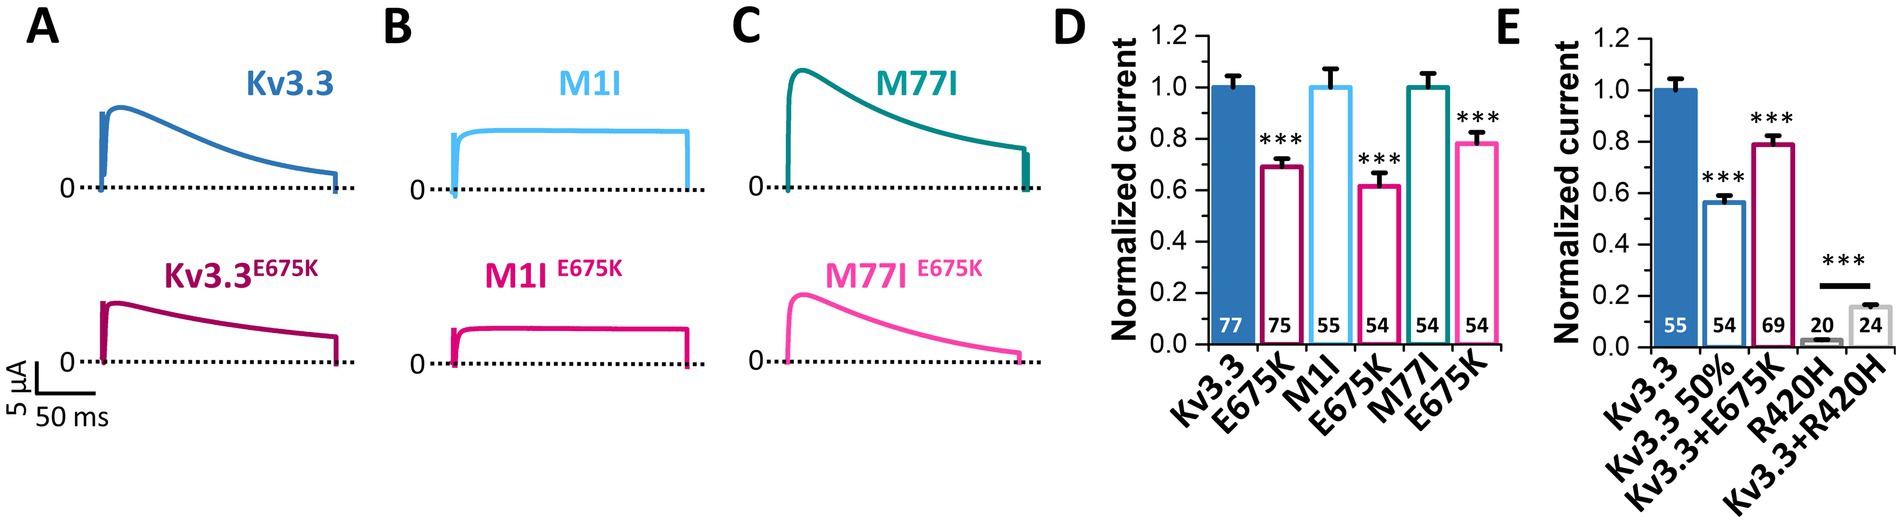
Figure 5. The Kv3.3E675K variant reduces the current amplitudes of Kv3.3 channels. (A) Representative current traces of Kv3.3 and the E675K variant introduced in wild-type Kv3.3. The voltage protocol is illustrated in Supplementary Figure 5E. (B) The same as in panel (A) but the E675K variant was introduced in the forced short M1I Kv3.3 channel or (C) the forced long M77I Kv3.3 channel background. (D) Peak current amplitude analyses derived from panel (A–C). Plotted are the current amplitudes of the respective Kv3.3 channel constructs, in the absence or presence of the E675K variant. Currents were analyzed after a voltage step to +50 mV, 2 days after injection of 0.5 ng cRNA of the respective channel construct into each oocyte. Currents were normalized to the respective Kv3.3 channel background. (E) Oocytes were injected with 0.5 ng (Kv3.3) or to mimic a haploinsufficiency with 0.25 ng (Kv3.3 50%) wild-type Kv3.3 cRNA. To mimic the heterozygous state of the patient, 0.25 ng wild-type Kv3.3 was co-injected with 0.25 ng Kv3.3E675K cRNA (Kv3.3 + E675K). As a comparison to a SCA13 mutant, we injected 0.5 ng cRNA of the dominant-negative Kv3.3R420H mutant (Kv3.3R420H) alone or 0.25 ng wild-type Kv3.3 together with 0.25 ng Kv3.3R420H. Currents were analyzed as in panel (D) and normalized to wild-type Kv3.3. Data are presented as mean ± s.e.m. The number of replicates is indicated within the graphs.
3.8 Pharmacological approaches to rescue Kv3.3E675K channel loss-of-functionNext, we probed for drugs to rescue Kv3.3 channel function. As Kv3.3E675K leads to reduced current amplitudes in the homozygous as well as in the heterozygous state, we applied different compounds in order to activate Kv3.3 (Supplementary Figure 4) and Kv3.3E675K (Figure 6). First, we tested the Kv1.1 activator niflumic acid (Servettini et al., 2023), however, only a slight, non-significant increase in Kv3.3E675K channel amplitude was observed at a concentration of 10 μM (Figures 6A,B). Unfortunately, even at 100 μM, a concentration that is most likely too high to be achieved in the plasma of patients, application of niflumic acid resulted only in a minimal non-significant decrease in currents of wild-type Kv3.3 (Supplementary Figure 4A) or the Kv3.3E675K variant (Figure 6A). Carbamazepine that is used in the treatment of epilepsy did not activate Kv3.3 (Figures 6A,C). On the other hand, 4-AP, as expected for an unspecific Kv channel blocker, caused an inhibition of Kv3.3E675K, albeit only in high concentrations (Figure 6A). Noteworthy, no improvement was noted by 4-AP treatment in the patient. In contrast, the symptoms increased dramatically under 4-AP treatment which is consistent with the hypotheses that reduced Kv channel amplitudes represent the disease-causing mechanism in our patient. Therefore, we next tested riluzole a drug that is used to treat amyotrophic lateral sclerosis (ALS), since it is known to activate potassium channels, e.g., the K2P channels TREK-1 and TRAAK (Duprat et al., 2000) or small-conductance Ca2+ activated potassium channels (Cao et al., 2002). However, no activation of Kv3.3E675K was observed (Figures 6A,D). Note, that riluzole, known to activate other potassium channels, showed a positive effect on symptom severity and frequency of manifestation in our patient, which might be caused by a rescue of collective potassium conductance. All tested drugs showed similar effects on wild-type Kv3.3 channels (Supplementary Figure 4).
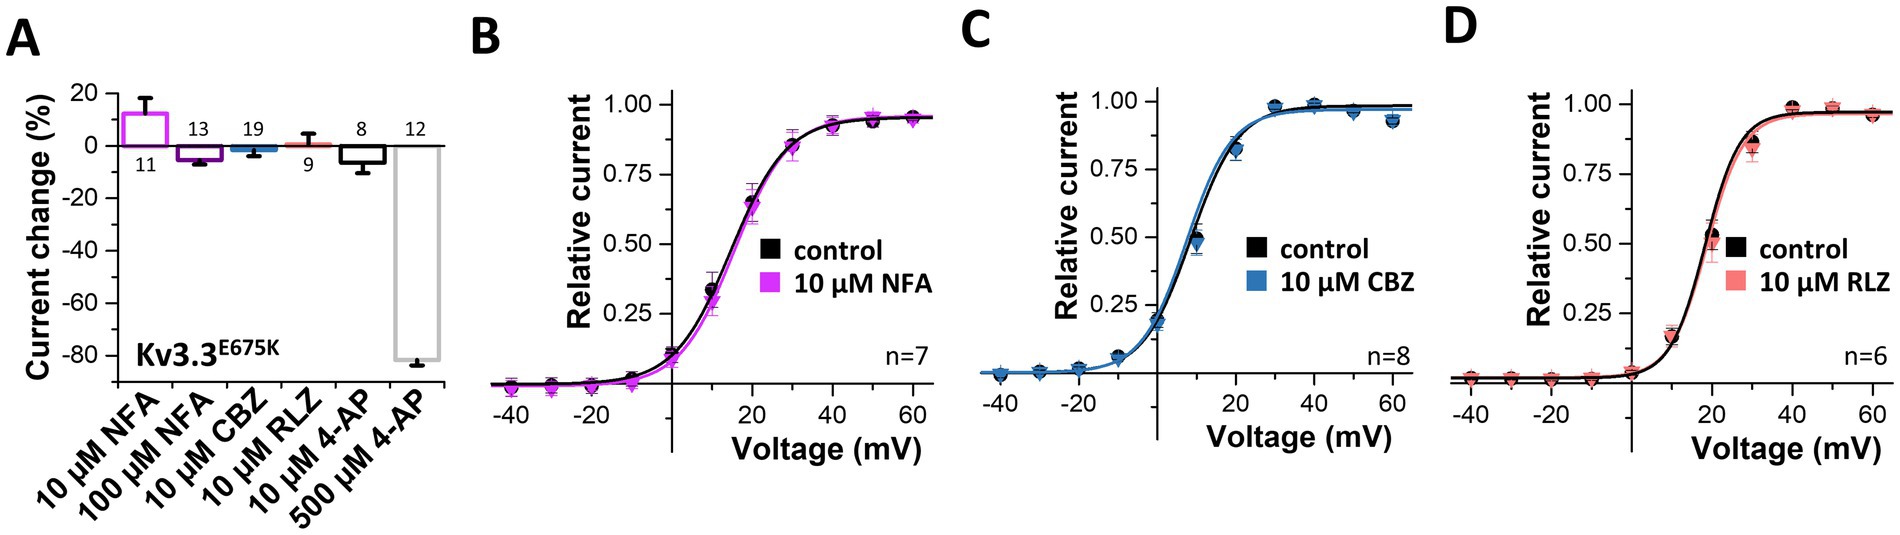
Figure 6. Search for drugs to rescue the Kv3.3E675K-mediated loss-of-function. (A) Analysis of the current changes of the Kv3.3E675K variant by the application of niflumic acid (NFA), carbamazepine (CBZ), riluzole (RLZ) or 4-AP, analyzed at +40 mV. (B) Conductance-voltage relationships before and after perfusion with 10 μM niflumic acid, (C) 10 μM carbamazepine or (D) 10 μM riluzole. The voltage protocol is illustrated in Supplementary Figure 5A. Data are presented as mean ± s.e.m. The number of replicates is indicated within the graphs.
3.9 Extracellular potassium ions increase the current density of wild-type and mutant Kv3.3 channelsVoltage-gated potassium channels, like hERG (Kv11.1) (Guo et al., 2009), or Kv7.1 (Abrahamyan et al., 2023) or inward rectifier potassium channels (Leech and Stanfield, 1981) are modulated by extracellular potassium ions ([K+]ex). Thus, we aimed to analyze, whether Kv3.3 is also dependent on [K+]ex, as channel activation by extracellular potassium might rescue the channel loss-of-function induced by the E675K variant. Indeed, a current increase by extracellular potassium ions was observed for wild-type Kv3.3 channels and Kv3.3E675K accompanied by a loss of channel inactivation (rectification) at depolarized potentials (Figure 7A). We also found that the GV curve was shifted to more depolarized potentials by increasing [K+]ex. However, a putative current reduction at potentials between +10 to +40 mV, caused by this rightward shift in the voltage-dependence by increased [K+]ex, was only observed at extremely high [K+]ex (Figure 7B). As the Kv3.3E675K variant showed a similar [K+]ex-dependence (Figures 7C,D), increasing extracellular potassium should result in a current increase for both, wild-type Kv3.3 and the Kv3.3E675K variant if [K+]ex concentrations are not far too supra-physiological (e.g., 8 mM).
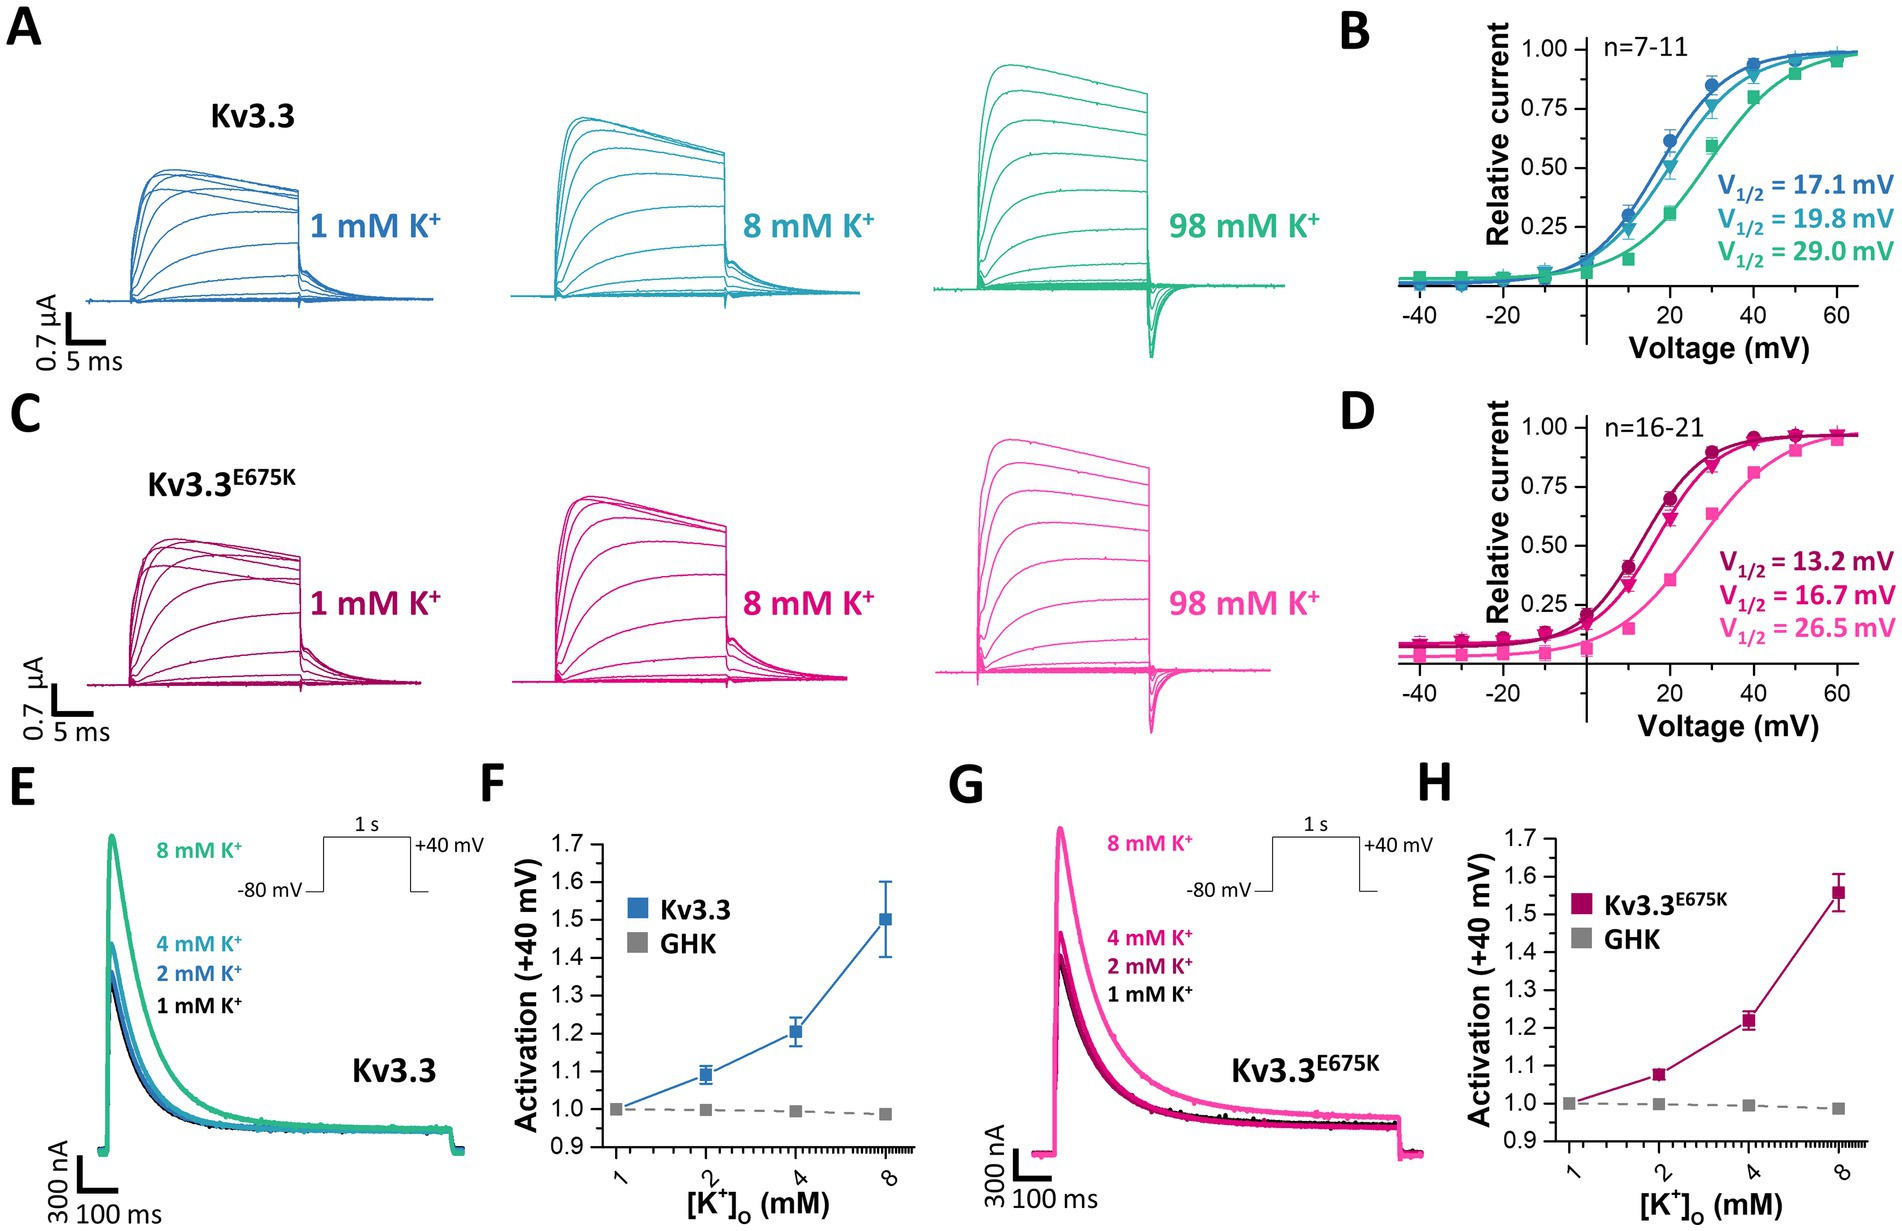
Figure 7. Rescue of Kv3.3 and Kv3.3E675K, by increased peak current amplitudes and reduced channel inactivation, mediated by [K+]ex. (A) Representative conductance-voltage (GV) recordings of Kv3.3 at different [K+]ex and (B) the derived GV relationships, analyzed from the tail currents at different [K+]ex. (C,D) Similar as in panel (A,B) but for the Kv3.3E675K variant. The voltage protocol is illustrated in Supplementary Figure 5A with a step to −15mV, −25mV and −40 mV, respectively. (E) A voltage step from −80 to +40 mV (see inset) was applied to record channel activation and peak currents of wild-type Kv3.3 at different [K+]ex. (F) Analysis of wild-type Kv3.3 channel activation at +40 mV by different [K+]ex. As a comparison to illustrate the paradoxical Kv3.3 activation by [K+]ex, the expected current changes, according to the Goldmann-Hodgkin-Katz equation, are illustrated as dotted line. (G,H) Similar as panel (E,F) but for the Kv3.3E675K variant. Data are presented as mean ± s.e.m. The number of replicates is indicated within the graphs.
Therefore, we next analyzed the peak current amplitudes of both, Kv3.3 and Kv3.3E675K, by increasing [K+]ex in the range of 1–8 mM (Figures 7E,G). Unlike expected from the Goldman-Hodgkin-Katz equation, an apparently paradoxical increase in outward currents was observed for both, wild-type Kv3.3 (Figures 7E,F) and the Kv3.3E675K variant (Figures 7G,H). Thus, Kv3.3 and Kv3.3E675K channels are indeed activated by increasing [K+]ex and consequently increasing [K+]ex might be in theory an option to rescue channel function if sufficient effects also occur in the physiological range.
3.10 Extracellular potassium ions destabilize inactivation of both, wild-type and Kv3.3E675K channelsAs we observed a loss of channel inactivation at depolarized potentials at elevated [K+]ex (Figure 7A), we studied the inactivation properties in relation to [K+]ex (Figure 8). The voltage of half-maximal inactivation was shifted rightwards by increasing [K+]ex for both, wild-type (Figure 8A) and mut
留言 (0)